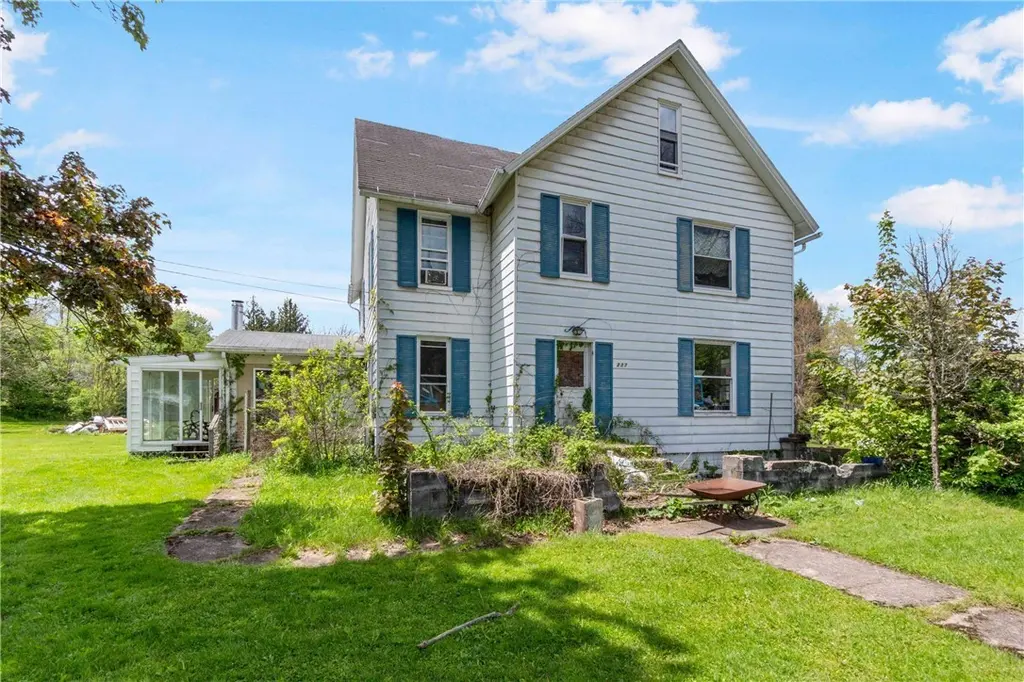
237 Parker St · Bruin, PA
Flood risk 1/10 · Minimal
- FEMA flood zone
- X (unshaded)
- Chance of flooding over 30 yrs
- 0.0%
- Est. flood insurance / yr
- $473 – $860
Fire risk 1/10 · Minimal
- Est. fire insurance / yr
- $511 – $949
Heat risk 3/10 · Minor
- Hot days now (above 96°F)
- 7 days/yr
- Hot days in 30 yrs
- 18 days/yr
Wind risk 1/10 · Minimal
- Chance of severe wind over 30 yrs
- —
Air-quality risk 2/10 · Minimal
- Unhealthy air days now
- 1 days/yr
- Unhealthy air days in 30 yrs
- 3 days/yr
Risk factors via First Street. Map © Google.
Why this score? — see what drove the B grade
The composite is a weighted blend of 9 inputs, each scored 0–100. Each bar is that input's sub-score; the figure is the points it added to the 100-point composite (weight × sub-score).
- Cash flow +30.0/30.0
- 1% rule +10.0/10.0
- DSCR +10.0/10.0
- ARV discount +7.5/15.0
- Appreciation +4.3/10.0
- Schools +3.6/10.0
- Livability +3.2/5.0
- Rent growth +2.5/5.0
- Condition / age +2.5/5.0
$65,000
🖨 Deal sheet (PDF) 📄 Offer letter ✓ Due diligence
Listing remarks MLS
Very spacious home situated on private corner lot, .82 acres, with frontage on two roads, homes has had some updates (bathrooms, hardwood flooring, trim) and others are still being completed. It has so many possibilities with the abundant amount of space inside. bathrooms updated. Several sheds on the property. Home has much character with interesting nooks and crannys thru out.
Key facts
- 0.81 acre lot
- Garage
- Built 1916
Property features AI
Exterior
- Parking: Detached garage
- Utilities: Public water; Public sewer
- Home design: Two-story residence; Resale property
- Exterior features: Approximately 0.44-acre lot
Interior
- Bathrooms: Two full bathrooms
- Heating & cooling: Forced air gas heating
- Interior features: Unfinished basement
Neighborhood map
What this means for you Summary
Snapshot
- This is a 5-bed/2.0-bath single-family listed at $65k.
Deal economics
- At list price, monthly cash flow is $591 ($7k/yr) — positive.
- The deal already cash-flows at list — no discount required.
- Meets the 1% rule at list price ($1k rent vs $65k).
- Recommended offer: $64k (1.5% below list) — sets the bar for market timing.
Location & tenants
- Location reads 64/100 on livability (#1,213 in PA) — a middle-class / working-renter tenant base. Strengths: cost of living A+, housing A+; Watch: health & safety C-, schools F, amenities F.
- Karns City Area SD (rural): math 33% / reading 51% proficiency, ranked #322 of 539 in PA (top 60%) — families likely to look elsewhere, expect single-tenant / working-renter base with shorter leases.
- Market conditions: 4 active listings in the ZIP; 987 units permitted in Butler County in 2024 (0 in 5+ unit buildings).
Forward outlook
- Local home prices are declining (-1.4%/yr); year-one equity from $449 of loan paydown is wiped out by about $903 of value loss. Plan a longer hold.
- Butler County population projected to shrink 5% by 2050 — rents likely to lag national; underwrite the cash flow, not the appreciation.
- At projected returns (-1.4% appreciation + 3.0% rent growth), your $18k cash investment doubles in ~3 years — after that, you're playing with house money.
Negotiation context
- It's been on market 19 days — a 2% lower offer ($64k) is reasonable based on typical stale-listing flexibility.
- 2 sale attempts since 10y ago with the ask held roughly flat each time — persistent listings suggest the price (not the market) is what's stuck; bring a comps-based counter.
Risks & watch-outs
- Watch-outs: built in 1916 — expect roof / HVAC / electrical / plumbing capex.
Questions for the listing agent
- Built in 1916 — when were the roof, HVAC, electrical panel, plumbing, and water heater last replaced?
- Is there a deadline driving the sale (1031 exchange, divorce, estate, relocation)? That informs how much negotiation room exists.
- Schools are F-rated, which usually means shorter tenancies and higher turnover. Who's the typical renter profile here, and what's been the actual vacancy rate?
- What's the average days-on-market for RENTAL listings here right now (not sales)? A rising rental-DOM trend means longer vacancies and softer asking-rent achievability than the comps imply.
- What's the recent tenant-quality profile in this submarket — average credit score on applications, eviction rate, late-payment / NSF rate, and stable-employment percentage? A property-management company in the area should have these aggregated.
- How much new for-sale + rental construction is in the pipeline within 1–3 miles? Heavy new supply typically softens prices + rents 12–24 months out; constrained supply supports both.
Investment metrics
- 1% rule
- 2.03% ✓
- Cap rate
- 17.21%
- Cash-on-cash
- 38.99%
- DSCR
- 2.73
- GRM
- 4.1
CMA / ARV
No comps found within radius.
Projected returns pro-forma
-1.39% appreciation · 3.0% rent growth · sell at horizon
- IRR
- 37.8%
- Equity multiple
- 2.74×
- Total profit
- $31,658
- Equity at exit
- $14,485
- IRR
- 42.5%
- Equity multiple
- 5.41×
- Total profit
- $80,296
- Equity at exit
- $14,205
Cash invested: $18,200 (down + closing). Projections, not guarantees.
Landlord ↔ Tenant lean methodology
- Overall (STATE)
- 62 Landlord-Friendly
- State Pennsylvania
- 62 Landlord-Friendly · EVEN
- County
- — inherits STATE
- City
- — inherits STATE
ZIP-level market 16022
- Home prices YoY
- -1.6%
- Active inventory
- 4
- Price-to-rent
- 4.1×
Monthly cashflow live
- Estimated rent
- $1,317 medium interval (Pro) →
- Mortgage (P&I)
- −$341
- Tax est. 1.5%
- −$81 /mo · $975/yr
- Insurance
- −$27
- HOA
- −$0
- Vacancy / Maint / Mgmt
- −$277
- Net cashflow
- $591
Break-even live
Sensitivity live
| Price | -10% $636 | -5% $614 | +0% $591 | +5% $569 | +10% $546 |
|---|---|---|---|---|---|
| Rent | -10% $487 | -5% $539 | +0% $591 | +5% $643 | +10% $695 |
| Rate | -1.0pp $624 | -0.5pp $608 | base $591 | +0.5pp $575 | +1.0pp $557 |
UW: 25.0% down · 7.5% · 30yr · 1.5% tax · 5.0% vac · 8.0% maint · 8.0% mgmt
Financing live
Cash to close
- Down payment
- $16,250
- Closing costs
- $1,950
- Reserves months
- —
- Total cash needed
- —
Loan-product check · same deal, 3 products live
Conventional
25% down · 7.5% · 30yr
- Down + closing
- —
- Monthly P&I
- —
- Monthly cashflow
- —
- DSCR
- —
- Eligible?
- —
Personal DTI + credit; lowest rate.
DSCR
20% down · 8.5% · 30yr
- Down + closing
- —
- Monthly P&I
- —
- Monthly cashflow
- —
- DSCR
- —
- Eligible?
- —
No personal income docs; deal must DSCR.
Hard money
10% down · 12.0% · 12mo
- Down + closing
- —
- Monthly P&I
- —
- Monthly cashflow
- —
- DSCR
- —
- Eligible?
- —
Short-term bridge; refi at stabilization.
Listing history 14 events
-
2026-06-21days on market $65,000 Active 19 DOM
-
2026-06-18days on market $65,000 Active 17 DOM
-
2026-06-17days on market $65,000 Active 16 DOM
-
2026-06-16days on market $65,000 Active 15 DOM
-
2026-06-15days on market $65,000 Active 14 DOM
-
2026-06-13days on market $65,000 Active 12 DOM
-
2026-06-12days on market $65,000 Active 11 DOM
-
2026-06-09days on market $65,000 Active 8 DOM
-
2026-06-08days on market $65,000 Active 7 DOM
-
2026-06-08days on market $65,000 Active 6 DOM
-
2026-06-07days on market $65,000 Active 5 DOM
-
2026-06-04days on market $65,000 Active 2 DOM
-
2026-06-01remarks 477-char remark
-
2026-06-01$65,000 Active 1 DOM
ⓘ Source: listings_history table (triggers on properties + properties_extension) + one-shot
backfill from property_details.listing_events for pre-trigger history.
Climate risk First Street
- Flood 1/10 Low FEMA zone X (unshaded) · 0% chance over 30 yrs
- Wildfire 1/10 Low
- Heat 3/10 Moderate 7 d/yr ≥96°F today · 18 d/yr by 30 yrs out
- Wind 1/10 Low
- Air quality 2/10 Low 1 unhealthy d/yr today · 3 by 30 yrs out
Nearby sold comps map
Loading sold comps map…
Walkable amenities ~0.75 mi
Loading nearby amenities…
Taxation est. · year 1
- Rental income
- $15,806
- − Mortgage interest
- −$3,641
- − Property taxes
- −$975
- − Insurance
- −$325
- − Repairs & maintenance
- −$1,265
- − Management
- −$1,265
- − Depreciation
- −$1,891
- Taxable income
- $6,445
- Est. tax owed @ 24.0%
- −$1,547
- After-tax cash flow
- $5,550/yr
For passive investors: Depreciation is non-cash, so a rental often shows a tax loss while cash-flowing — sheltering income. Rental losses are passive: they offset passive income freely, and up to $25,000/yr can offset ordinary (W-2) income if you actively participate and your MAGI is under $100k (phasing out to $0 by $150k); unused losses carry forward. On sale, claimed depreciation is recaptured at up to 25%, and gains may owe capital-gains tax (a 1031 exchange can defer both). Figures are a year-1 estimate at your 24.0% rate — not tax advice; consult a CPA.
Schools (NCES district)
- District
- Karns City Area SD
- NCES district ID
- 4209600
- Math proficiency
- 33% ▼ -14.00%
- Reading proficiency
- 51% ▼ -17.00%
- Median HH income
- $48,988
- Composite
- 35.99/100
- National rank
- #4792
- State rank
- #322 of 539 in PA
Livability — Bruin
- Score
- 64/100
- State rank
- #1213
- US rank
- #14343
Category grades
Schools grade is shown separately in the Schools card above.
Census & demographics
- Census place
- Bruin, PA
- City population
- 296
- Population (ZIP)
- 296
Population outlook (Butler County) Hauer SSP2
- Today (2025)
- 190,777 people
- By 2030
- 191,476 · +0.4%
- By 2040
- 189,474 · -0.7%
- By 2050
- 182,050 · -4.6%
- By 2075
- 159,526 · -16.4%
- By 2100
- 129,028 · -32.4%
Race, ethnicity, and origin ACS 2023
- Neighborhood character
- Predominantly White (98%)
- Race & ethnicity
- White 98% Two or more races 2%
- Common ancestry
- Iranian 4% Lithuanian 3% Romanian 2%
- Languages at home
- 99% English-only · Spanish 1%
Political lean MEDSL · Butler
- 2024 margin
- Solid R (+32.2) · D 33.5% · R 65.7%
- 2008→2024 swing
- -4.8pp toward R · 2008: -27.4pp · 2024: -32.2pp
- All cycles
- 2024: R+32.2 2020: R+32.5 2016: R+37.5 2012: R+34.9 2008: R+27.4
Not yet ingested
- Civics
- —
Market trends
- HPI YoY
- ▼ -1.39%
- Current HPI
- 86.5215
- Rent YoY
- —
- Metro
- —
- State GDP YoY
- ▲ 1.68%
- F500 in state
- 34
Industry mix (Fortune 500 HQ in PA)
| Industry | F500 HQs | Revenue |
|---|---|---|
| Healthcare | 2 | $309B |
|
||
| Insurance | 2 | $27B |
|
||
| Telecommunications / Media | 1 | $124B |
|
||
| Industrial Distribution | 1 | $22B |
|
||
| Financial Services | 1 | $20B |
|
||
| Chemicals / Materials | 1 | $18B |
|
||
Price history
-13.3% since first listed4 events — show timeline
- 2026-06-01 Listed $65,000 West Penn MLS
- 2016-12-19 Delisted — West Penn MLS
- 2016-10-21 Price Changed $76,900 West Penn MLS
- 2016-10-20 Listed $75,000 West Penn MLS
Cash-flow waterfall
monthlySold comps — $/sqft
last 12 mo · ≤1 miLoading sold comps…