 🏷️ Likely Rental
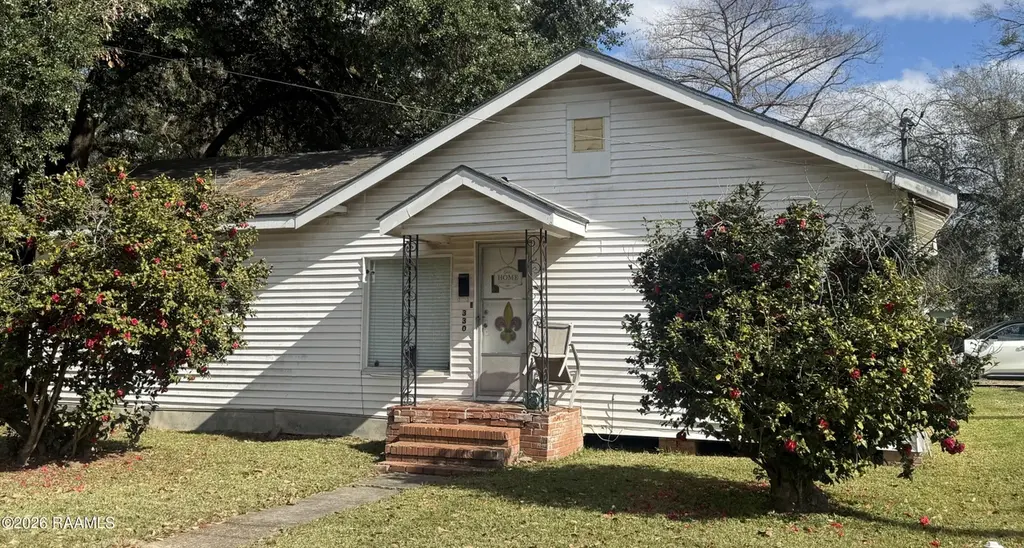
300 Boudreaux St · Eunice, LA
Flood risk 6/10 · Moderate
- FEMA flood zone
- AE
- Chance of flooding over 30 yrs
- 0.71%
- Est. flood insurance / yr
- $1,737 – $8,500
Fire risk 1/10 · Minimal
- Est. fire insurance / yr
- $1,269 – $2,357
Heat risk 8/10 · Major
- Hot days now (above 114°F)
- 7 days/yr
- Hot days in 30 yrs
- 20 days/yr
Wind risk 9/10 · Severe
- Chance of severe wind over 30 yrs
- 99.0%
Air-quality risk 1/10 · Minimal
- Unhealthy air days now
- 0 days/yr
- Unhealthy air days in 30 yrs
- 0 days/yr
Risk factors via First Street. Map © Google.
Why this score? — see what drove the B grade
The composite is a weighted blend of 9 inputs, each scored 0–100. Each bar is that input's sub-score; the figure is the points it added to the 100-point composite (weight × sub-score).
- Cash flow +30.0/30.0
- ARV discount +15.0/15.0
- DSCR +10.0/10.0
- 1% rule +7.4/10.0
- Livability +3.5/5.0
- Rent growth +2.5/5.0
- Condition / age +2.5/5.0
- Schools +2.2/10.0
- Appreciation +0.0/10.0
$84,500
🖨 Deal sheet (PDF) 📄 Offer letter ✓ Due diligence
Listing remarks MLS
Well maintained 3 bedroom, 2 bath home located on corner lot with mature trees. Features include an dining room, kitchen, generous living area, split floor plan and a 2 car carport. Tenant occupied -Appointment required.
Key facts
- Generous living area
- Kitchen
- Split floor plan
Tags
Neighborhood map
What this means for you Summary
Snapshot
- This is a 3-bed/2.0-bath single-family listed at $84k.
Deal economics
- At list price, monthly cash flow is $-105 ($-1k/yr) — negative.
- To cash-flow at today's rent, offer at most $66k (21.9% below list).
- Meets the 1% rule at list price ($1k rent vs $84k).
- Recommended offer: $66k (21.9% below list) — sets the bar for cash-flow.
- Cap rate 10.9% vs local median 4.2% in Eunice — top-decile yield for the area; either an underpriced asset or a hidden risk that comps aren't pricing in. Stress-test before assuming the spread holds.
Location & tenants
- Location reads 69/100 on livability (#69 in LA) — a middle-class / working-renter tenant base. Strengths: cost of living A+, housing A+, health & safety A+; Watch: crime F, amenities F, commute F.
- St. Landry Parish (town): math 20% / reading 33% proficiency, ranked #54 of 98 in LA (top 55%) — low school quality limits family demand, transient renter base, plan for 1-2y turnover; 73% free/reduced lunch — lower-income household profile, screen leases tightly.
- Zoned schools: Highland Early Learning Center (math 17% / reading 27%, grade F, #415 of 646 statewide, top 67%, 139 students, 71% FRL); Eunice Junior High School (math 28% / reading 44%, grade F, #84 of 218 statewide, top 41%, 344 students, 74% FRL); Eunice High School (math 37% / reading 42%, grade F, #80 of 265 statewide, top 32%, 650 students, 58% FRL).
- Market conditions: 106 active listings in the ZIP; 1 comparable units currently listed for rent nearby; 142 units permitted in St. Landry Parish in 2024 (0 in 5+ unit buildings).
Forward outlook
- Local home prices are declining (-3.0%/yr); year-one equity from $584 of loan paydown is wiped out by about $3k of value loss. Plan a longer hold.
- St. Landry County population projected to shrink 9% by 2050 — rents likely to lag national; underwrite the cash flow, not the appreciation.
Negotiation context
- It's been on market 154 days — a 12% lower offer ($74k) is reasonable based on typical stale-listing flexibility.
Risks & watch-outs
- Watch-outs: flood insurance adds $427/mo.
- Climate carrying-cost: in FEMA flood zone AE (mandatory federal flood insurance); severe wind risk, 99% chance of damaging wind over 30y; extreme-heat days projected 7→20/yr by 2055 (HVAC capex compounding) — expect insurance premiums to compound above CPI over the hold.
Questions for the listing agent
- What do current leases actually rent for vs. the listed asking? Can we see a recent rent roll and the last 12 months of T-12 income?
- It's been on market 154 days. Have you received any prior offers? Is the seller open to a 22% concession, seller financing, or rate buy-down credit?
- What's the actual annual flood-insurance premium (NFIP or private), and is the property in a SFHA with mandatory coverage?
- Why hasn't it sold? Are there any deal-killer items the seller is aware of (foundation, flood, title, zoning, code violations)?
- Is there a deadline driving the sale (1031 exchange, divorce, estate, relocation)? That informs how much negotiation room exists.
- Schools are B-rated — typically a magnet for longer-tenancy family renters. What's the average tenant stay here, and is there a school-zone premium baked into asking?
- Crime grade is F in this area — have there been break-ins, vandalism, or insurance claims at this property in the last 3 years? What carrier currently insures it and at what premium?
- What's the average days-on-market for RENTAL listings here right now (not sales)? A rising rental-DOM trend means longer vacancies and softer asking-rent achievability than the comps imply.
- What's the recent tenant-quality profile in this submarket — average credit score on applications, eviction rate, late-payment / NSF rate, and stable-employment percentage? A property-management company in the area should have these aggregated.
- How much new for-sale + rental construction is in the pipeline within 1–3 miles? Heavy new supply typically softens prices + rents 12–24 months out; constrained supply supports both.
Investment metrics
- 1% rule
- 1.24% ✓
- Cap rate
- 10.87%
- Cash-on-cash
- 16.33%
- DSCR
- 1.73
- GRM
- 6.7
CMA / ARV
- ARV (median comp)
- $110,424
- List price
- $84,500
- Delta
- -23.48%
- Verdict
- UNDERPRICED
- Comps
- 20 within 1.0 mi
Show comp detail 6 sales within ~0.75 mi
| Address | Dist | Beds/Ba | Sqft | Sold | Price | $/sf | Match |
|---|---|---|---|---|---|---|---|
| 142 E Ardoin St | 0.19mi | 4/2.0 (+1) | 1,484 (-6%) | 2mo | $70,000 | $47 | 74 |
| 530 W Gum Ave | 0.40mi | 3/2.0 | 1,500 (-5%) | 5mo | $40,000 | $27 | 68 |
| 650 Juanita St | 0.68mi | 3/2.0 | 1,485 (-6%) | 10mo | $125,000 | $84 | 49 |
| 500 S 5th St | 0.42mi | 2/2.0 (-1) | 1,390 (-12%) | 9mo | $162,500 | $117 | 47 |
| 800 Park Ave | 0.69mi | 3/2.0 | 1,742 (+10%) | 9mo | $180,000 | $103 | 44 |
| 311 S 9th St | 0.69mi | 4/3.0 (+1) | 1,800 (+14%) | 24mo | $52,900 | $29 | 16 |
Match score weights: distance 35% · size 25% · config 20% · recency 20%. Top-matched comps best support the ARV.
Projected returns pro-forma
-3.0% appreciation · 3.0% rent growth · sell at horizon
- IRR
- -24.9%
- Equity multiple
- 0.15×
- Total profit
- $-20,121
- Equity at exit
- $12,599
- IRR
- -19.8%
- Equity multiple
- -0.06×
- Total profit
- $-25,158
- Equity at exit
- $7,306
Cash invested: $23,660 (down + closing). Projections, not guarantees.
Landlord ↔ Tenant lean methodology
- Overall (STATE)
- 90 Strongly Landlord-Friendly
- State Louisiana
- 90 Strongly Landlord-Friendly · R+12
- County
- — inherits STATE
- City
- — inherits STATE
ZIP-level market 70535
- Home prices YoY
- -32.2%
- Active inventory
- 106
- Price-to-rent
- 6.7×
Monthly cashflow live
- Estimated rent
- $1,050 medium interval (Pro) →
- Mortgage (P&I)
- −$443
- Tax from tax record
- −$29 /mo · $350/yr
- Insurance
- −$35
- Flood insurance flood zone
- −$427 /mo · $5,118/yr
- HOA
- −$0
- Vacancy / Maint / Mgmt
- −$220
- Net cashflow
- $-105
Break-even live
Sensitivity live
| Price | -10% $-57 | -5% $-81 | +0% $-105 | +5% $-128 | +10% $-152 |
|---|---|---|---|---|---|
| Rent | -10% $-188 | -5% $-146 | +0% $-105 | +5% $-63 | +10% $-22 |
| Rate | -1.0pp $-62 | -0.5pp $-83 | base $-105 | +0.5pp $-126 | +1.0pp $-149 |
UW: 25.0% down · 7.5% · 30yr · 1.5% tax · 5.0% vac · 8.0% maint · 8.0% mgmt
Financing live
Cash to close
- Down payment
- $21,125
- Closing costs
- $2,535
- Reserves months
- —
- Total cash needed
- —
Loan-product check · same deal, 3 products live
Conventional
25% down · 7.5% · 30yr
- Down + closing
- —
- Monthly P&I
- —
- Monthly cashflow
- —
- DSCR
- —
- Eligible?
- —
Personal DTI + credit; lowest rate.
DSCR
20% down · 8.5% · 30yr
- Down + closing
- —
- Monthly P&I
- —
- Monthly cashflow
- —
- DSCR
- —
- Eligible?
- —
No personal income docs; deal must DSCR.
Hard money
10% down · 12.0% · 12mo
- Down + closing
- —
- Monthly P&I
- —
- Monthly cashflow
- —
- DSCR
- —
- Eligible?
- —
Short-term bridge; refi at stabilization.
Rent comps 1 comps
| Address | Beds | Baths | Sqft | Rent | $/sqft | DOM | Units | Dist |
|---|---|---|---|---|---|---|---|---|
| 311 June St Eunice, LA | 2.0 | 1.0 | 1058 | $1,050 | $0.99 | 45d | 1 | 1.18mi |
Listing history 19 events
-
2026-06-22days on market $84,500 Active 154 DOM
-
2026-06-21days on market $84,500 Active 153 DOM
-
2026-06-21days on market $84,500 Active 152 DOM
-
2026-06-18days on market $84,500 Active 150 DOM
-
2026-06-17days on market $84,500 Active 149 DOM
-
2026-06-16days on market $84,500 Active 148 DOM
-
2026-06-15days on market $84,500 Active 147 DOM
-
2026-06-13days on market $84,500 Active 145 DOM
-
2026-06-12days on market $84,500 Active 144 DOM
-
2026-06-09days on market $84,500 Active 141 DOM
-
2026-06-08days on market $84,500 Active 140 DOM
-
2026-06-07days on market $84,500 Active 139 DOM
-
2026-06-07days on market $84,500 Active 138 DOM
-
2026-06-04days on market $84,500 Active 135 DOM
-
2026-06-02days on market $84,500 Active 134 DOM
-
2026-06-01days on market $84,500 Active 133 DOM
-
2026-05-31days on market $84,500 Active 132 DOM
-
2026-05-31days on market $84,500 Active 131 DOM
-
2026-01-19$84,500 Active 220-char remark
Show marketing remark (220 chars)
Well maintained 3 bedroom, 2 bath home located on corner lot with mature trees. Features include an dining room, kitchen, generous living area, split floor plan and a 2 car carport. Tenant occupied -Appointment required.
ⓘ Source: listings_history table (triggers on properties + properties_extension) + one-shot
backfill from property_details.listing_events for pre-trigger history.
Tax reassessment forecast LA · Resets to sale price
- Current annual tax
- $350 · $29/mo
- Projected year-2 tax
- $465 · $39/mo
- Expected delta
- +$115/yr (+$10/mo · 32.7%)
ⓘ Screening estimate from a state-policy table — verify with the county assessor before closing.
Climate risk First Street
- Flood 6/10 Major FEMA zone AE · 71% chance over 30 yrs
- Wildfire 1/10 Low
- Heat 8/10 Severe 7 d/yr ≥114°F today · 20 d/yr by 30 yrs out
- Wind 9/10 Extreme 99% chance of damaging wind over 30 yrs
- Air quality 1/10 Low 0 unhealthy d/yr today · 0 by 30 yrs out
Nearby sold comps map
Loading sold comps map…
Walkable amenities ~0.75 mi
Loading nearby amenities…
Taxation est. · year 1
- Rental income
- $12,600
- − Mortgage interest
- −$4,733
- − Property taxes
- −$350
- − Insurance
- −$5,541
- − Repairs & maintenance
- −$1,008
- − Management
- −$1,008
- − Depreciation
- −$2,458
- Taxable loss
- −$2,499
- Est. tax savings @ 24.0%
- +$600
- After-tax cash flow
- $-655/yr
For passive investors: Depreciation is non-cash, so a rental often shows a tax loss while cash-flowing — sheltering income. Rental losses are passive: they offset passive income freely, and up to $25,000/yr can offset ordinary (W-2) income if you actively participate and your MAGI is under $100k (phasing out to $0 by $150k); unused losses carry forward. On sale, claimed depreciation is recaptured at up to 25%, and gains may owe capital-gains tax (a 1031 exchange can defer both). Figures are a year-1 estimate at your 24.0% rate — not tax advice; consult a CPA.
Schools (NCES district)
- District
- St. Landry Parish
- NCES district ID
- 2201560
- Math proficiency
- 20% ▼ -43.00%
- Reading proficiency
- 33% ▼ -35.00%
- Median HH income
- $32,635
- Composite
- 21.59/100
- National rank
- #8303
- State rank
- #54 of 98 in LA
Livability — Eunice
- Score
- 69/100
- State rank
- #69
- US rank
- #8447
Category grades
Schools grade is shown separately in the Schools card above.
Census & demographics
- Census place
- Eunice, LA
- Population (ZIP)
- 17,813
Population outlook (St. Landry County) Hauer SSP2
- Today (2025)
- 83,114 people
- By 2030
- 82,110 · -1.2%
- By 2040
- 79,445 · -4.4%
- By 2050
- 75,855 · -8.7%
- By 2075
- 65,684 · -21.0%
- By 2100
- 51,739 · -37.7%
Race, ethnicity, and origin ACS 2023
- Neighborhood character
- Predominantly White (67%)
- Race & ethnicity
- White 67% Black 25% Two or more races 5% Hispanic / Latino 4%
- Common ancestry
- Lithuanian 14% Italian 1%
- Foreign-born
- 1% · Canada
- Languages at home
- 92% English-only · French/Haitian/Cajun 6% Spanish 2%
Political lean MEDSL · St. Landry
- 2024 margin
- R (+18.8) · D 40.0% · R 58.9% · Other 1.1%
- 2008→2024 swing
- -15.6pp toward R · 2008: -3.2pp · 2024: -18.8pp
- All cycles
- 2024: R+18.8 2020: R+14.1 2016: R+11.9 2012: R+4.3 2008: R+3.2
Not yet ingested
- Civics
- —
Market trends
- HPI YoY
- ▼ -53.63%
- Current HPI
- 112.8329
- Rent YoY
- —
- Metro
- —
- State GDP YoY
- ▲ 3.29%
- F500 in state
- 10
Industry mix (Fortune 500 HQ in LA)
| Industry | F500 HQs | Revenue |
|---|---|---|
| Telecommunications | 2 | $23B |
|
||
| Utilities | 1 | $12B |
|
||
| Wholesale / Distribution | 1 | $5B |
|
||
| Advertising | 1 | $2B |
|
||
Price history
1 event — show timeline
- 2026-01-19 Listed $84,500 AcadianaMLS
Property tax history
+0.8%/yrLatest (2025): $350 · +0.0% YoY. Source: county tax records.
Cash-flow waterfall
monthlySold comps — $/sqft
last 12 mo · ≤1 miLoading sold comps…