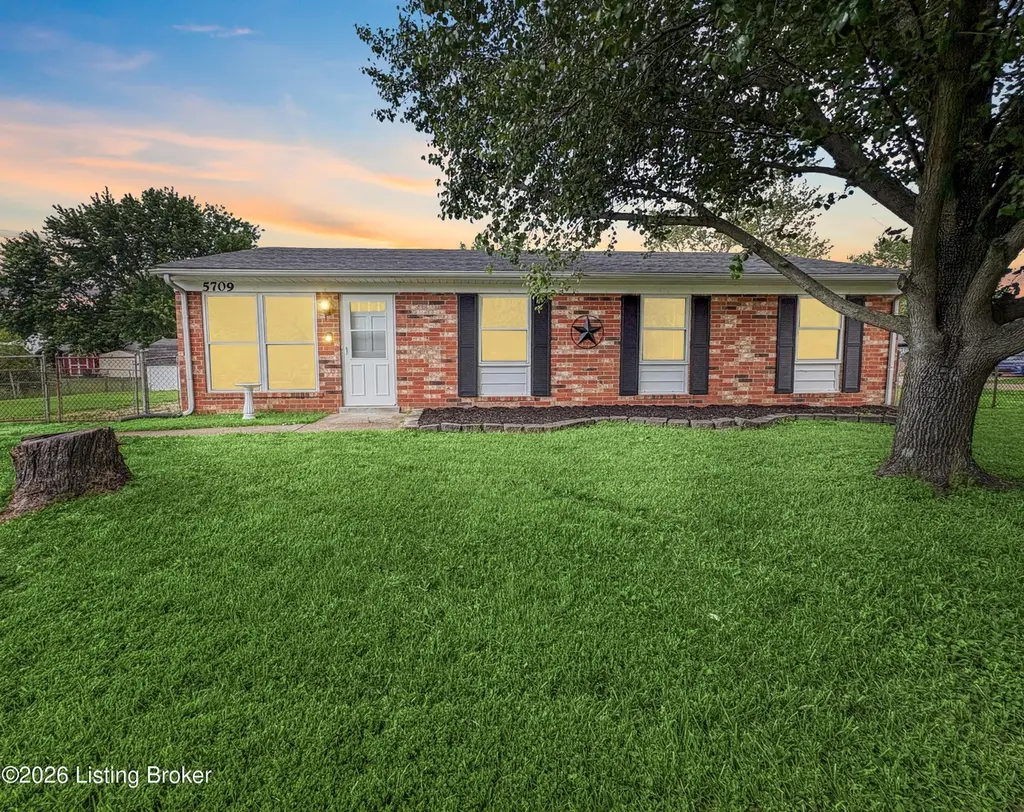
5709 Larkgrove Dr · Louisville/Jefferson County metro government (balance), KY
Flood risk 1/10 · Minimal
- FEMA flood zone
- X (unshaded)
- Chance of flooding over 30 yrs
- 0.0%
- Est. flood insurance / yr
- $507 – $1,088
Fire risk 2/10 · Minimal
- Est. fire insurance / yr
- $839 – $1,559
Heat risk 5/10 · Moderate
- Hot days now (above 104°F)
- 7 days/yr
- Hot days in 30 yrs
- 19 days/yr
Wind risk 2/10 · Minimal
- Chance of severe wind over 30 yrs
- 3.0%
Air-quality risk 3/10 · Minor
- Unhealthy air days now
- 2 days/yr
- Unhealthy air days in 30 yrs
- 5 days/yr
Risk factors via First Street. Map © Google.
Why this score? — see what drove the D grade
The composite is a weighted blend of 9 inputs, each scored 0–100. Each bar is that input's sub-score; the figure is the points it added to the 100-point composite (weight × sub-score).
- Cash flow +14.3/30.0
- ARV discount +11.3/15.0
- DSCR +4.3/10.0
- Rent growth +3.9/5.0
- 1% rule +3.5/10.0
- Livability +2.5/5.0
- Condition / age +2.5/5.0
- Schools +2.3/10.0
- Appreciation +0.0/10.0
$226,000
🖨 Deal sheet 📄 Offer letter ✓ Due diligence
Listing remarks
Welcome to this beautifully updated all-brick home in the desirable Larkgrove subdivision! Offering 4 bedrooms, 1.5 full bathrooms, and 1,215 square feet of well-designed living space, this home combines classic charm with modern updates throughout. Step inside to find fresh paint throughout the entire home, creating a clean and inviting atmosphere. The kitchen has been refreshed with a brand-new floor, while both bathrooms feature new vanities and updated faucets for a modern touch. You'll also love the new lighting installed throughout the home, adding warmth and style to every room. Major improvements have already been taken care of for you, including a roof that's only 9 months old and
Key facts
- New deck
- Updated faucets
- New vanities
Tags
Property features AI
Finance
- Other: Located in the LARKGROVE subdivision
- HOA & community: No association fee
Exterior
- Parking: Driveway
- Utilities: Electricity connected; Natural gas available
- Home design: Single-family ranch-style home; Single-story; Entry level and main living on the first floor
- Construction: Built in 1974; Brick construction; Shingle roof; Slab foundation
- Exterior features: Cleared lot; Chain link fencing
Interior
- Kitchen: Kitchen with eat-in area on the first floor
- Bedrooms: Four bedrooms, all on the first floor
- Bathrooms: One full bathroom on the first floor; One half bathroom on the first floor
- Heating & cooling: Forced air heating; Central air conditioning
- Interior features: Six total rooms; Six closets; No basement; First-floor primary bedroom
- Laundry & utility: First-floor laundry
Neighborhood map
What this means for you Summary
Snapshot
- This is a 4-bed/1.5-bath single-family listed at $226k.
Deal economics
- At list price, monthly cash flow is $40 ($483/yr) — positive.
- The deal already cash-flows at list — no discount required.
- To meet the 1% rule (rent ≥ 1% of price), the offer needs to be $192k (14.9% below list).
- Recommended offer: $192k (14.9% below list) — sets the bar for 1% rule.
- Cap rate 6.5% vs local median 4.0% in Louisville/Jefferson County metro government (balance) — top-decile yield for the area; either an underpriced asset or a hidden risk that comps aren't pricing in. Stress-test before assuming the spread holds.
Location & tenants
- Location reads: area grade D — affects rentability + tenant quality, not the cash-flow math above.
- Jefferson County (urban): math 19% / reading 35% proficiency, ranked #121 of 165 in KY (top 73%) — low school quality limits family demand, transient renter base, plan for 1-2y turnover.
- Market conditions: Rents rising fast (+5.5%/yr); 243 active listings in the ZIP; 6 comparable units currently listed for rent nearby; rentals leasing fast (median 3d on market — plan ~1-2 weeks tenant-placement turnaround); solid renter incomes; 2,836 units permitted in Jefferson County in 2024 (1,558 in 5+ unit buildings).
Forward outlook
- Local home prices are declining (-3.0%/yr); year-one equity from $2k of loan paydown is wiped out by about $7k of value loss. Plan a longer hold.
- Jefferson County population projected at +13% by 2050 — modest demand growth; plan on rents tracking national, not racing it.
Negotiation context
- Only 9 days on market — expect competitive offers; lowballing is unlikely to land.
- 6 sale attempts since 23y ago with the ask held roughly flat each time — persistent listings suggest the price (not the market) is what's stuck; bring a comps-based counter.
- Current owner paid $65k; list at $226k implies a 248% gain — meaningful room to come down on a strong offer.
Risks & watch-outs
- Climate carrying-cost: extreme-heat days projected 7→19/yr by 2055 (HVAC capex compounding) — expect insurance premiums to compound above CPI over the hold.
Questions for the listing agent
- Built in 1974 — when were the roof, HVAC, electrical panel, plumbing, and water heater last replaced?
- Is there a deadline driving the sale (1031 exchange, divorce, estate, relocation)? That informs how much negotiation room exists.
- The area grade is low — what's the realistic commute time and amenity access for the typical tenant pool here? Any planned neighborhood developments (good or bad) we should know about?
- What's the average days-on-market for RENTAL listings here right now (not sales)? A rising rental-DOM trend means longer vacancies and softer asking-rent achievability than the comps imply.
- What's the recent tenant-quality profile in this submarket — average credit score on applications, eviction rate, late-payment / NSF rate, and stable-employment percentage? A property-management company in the area should have these aggregated.
- How much new for-sale + rental construction is in the pipeline within 1–3 miles? Heavy new supply typically softens prices + rents 12–24 months out; constrained supply supports both.
Investment metrics
- 1% rule
- 0.85% ✗
- Cap rate
- 6.51%
- Cash-on-cash
- 0.76%
- DSCR
- 1.03
- GRM
- 9.8
CMA / ARV
- ARV (on-the-fly)
- $246,645
- Comps found
- 12
Show comp detail 12 sales within ~0.75 mi
| Address | Dist | Beds/Ba | Sqft | Sold | Price | $/sf | Match |
|---|---|---|---|---|---|---|---|
| 10812 Waycross Ave | 0.13mi | 3/1.5 (-1) | 1,153 (-5%) | 2mo | $217,600 | $189 | 79 |
| 6115 Kirkwood Ct | 0.27mi | 4/2.0 | 1,272 (+5%) | 8mo | $272,000 | $214 | 70 |
| 11003 Lanette Ct | 0.05mi | 3/1.5 (-1) | 1,107 (-9%) | 10mo | $215,000 | $194 | 70 |
| 11007 Marbado Ct | 0.12mi | 3/1.0 (-1) | 1,115 (-8%) | 6mo | $225,000 | $202 | 68 |
| 10913 Altsheler Pl | 0.09mi | 4/2.0 | 1,055 (-13%) | 6mo | $234,000 | $222 | 67 |
| 11015 Oreland Mill Rd | 0.31mi | 3/1.0 (-1) | 1,130 (-7%) | 0mo | $229,900 | $203 | 67 |
| 6902 Charles Lindsey Ct | 0.42mi | 3/2.0 (-1) | 1,228 (+1%) | 7mo | $282,700 | $230 | 66 |
| 5616 Locust Way | 0.31mi | 3/1.0 (-1) | 1,123 (-8%) | 2mo | $218,500 | $195 | 64 |
| 5606 Walnut Way | 0.41mi | 3/1.0 (-1) | 1,188 (-2%) | 10mo | $225,000 | $189 | 62 |
| 5705 Bartview Ct | 0.35mi | 3/2.0 (-1) | 1,305 (+7%) | 8mo | $270,000 | $207 | 57 |
| 6401 Meadow Creek Cir | 0.58mi | 3/2.0 (-1) | 1,272 (+5%) | 8mo | $309,110 | $243 | 52 |
| 162 Ledgewood Ct | 0.70mi | 3/1.0 (-1) | 1,080 (-11%) | 8mo | $177,000 | $164 | 35 |
Match score weights: distance 35% · size 25% · config 20% · recency 20%. Top-matched comps best support the ARV.
Projected returns pro-forma
-3.0% appreciation · 5.46% rent growth · sell at horizon
- IRR
- -12.5%
- Equity multiple
- 0.54×
- Total profit
- $-29,202
- Equity at exit
- $33,697
- IRR
- -0.2%
- Equity multiple
- 0.98×
- Total profit
- $-1,167
- Equity at exit
- $19,540
Cash invested: $63,280 (down + closing). Projections, not guarantees.
Landlord ↔ Tenant lean methodology
- Overall (STATE)
- 83 Strongly Landlord-Friendly
- State Kentucky
- 83 Strongly Landlord-Friendly · R+16
- County
- — inherits STATE
- City
- — inherits STATE
ZIP-level market 40229
- Rents YoY
- 5.5%
- Active inventory
- 243
- Price-to-rent
- 9.8×
Monthly cashflow live
- Estimated rent
- $1,923 high interval (Pro) →
- Mortgage (P&I)
- −$1,185
- Tax from tax record
- −$200 /mo · $2,396/yr
- Insurance
- −$94
- HOA
- −$0
- Vacancy / Maint / Mgmt
- −$404
- Net cashflow
- $40
Break-even live
UW: 25.0% down · 7.5% · 30yr · 1.5% tax · 5.0% vac · 8.0% maint · 8.0% mgmt
Financing live
Cash to close
- Down payment
- $56,500
- Closing costs
- $6,780
- Reserves months
- —
- Total cash needed
- —
Loan-product check · same deal, 3 products live
Conventional
25% down · 7.5% · 30yr
- Down + closing
- —
- Monthly P&I
- —
- Monthly cashflow
- —
- DSCR
- —
- Eligible?
- —
Personal DTI + credit; lowest rate.
DSCR
20% down · 8.5% · 30yr
- Down + closing
- —
- Monthly P&I
- —
- Monthly cashflow
- —
- DSCR
- —
- Eligible?
- —
No personal income docs; deal must DSCR.
Hard money
10% down · 12.0% · 12mo
- Down + closing
- —
- Monthly P&I
- —
- Monthly cashflow
- —
- DSCR
- —
- Eligible?
- —
Short-term bridge; refi at stabilization.
Rent comps 6 comps
| Address | Beds | Baths | Sqft | Rent | $/sqft | DOM | Units | Dist |
|---|---|---|---|---|---|---|---|---|
| 11706 Maple Way Louisville, KY | 4.0 | 1.0 | 1400 | $1,799 | $1.28 | 11d | 1 | 0.58mi |
| 11616 Maple Way Louisville, KY | 3.0 | 2.0 | 1135 | $1,895 | $1.67 | 3d | 1 | 0.63mi |
| 11602 Apex View Dr Louisville, KY | 1.0–3.0 | 1.0–2.0 | 1050 | $2,049 | $1.95 | 1d | 35 | 0.97mi |
| 6507 Rod N Reel Ct Louisville, KY | 3.0 | 2.0 | 1150 | $1,550 | $1.35 | 23d | 1 | 1.18mi |
| 6115 Red Spruce Dr Louisville, KY | 3.0 | 1.0 | 975 | $1,395 | $1.43 | 3d | 1 | 1.37mi |
| 6128 Cooper Chapel Rd Louisville, KY | 3.0 | 1.0 | 964 | $1,400 | $1.45 | 3d | 1 | 1.48mi |
Listing history 13 events
-
2026-05-13status Pending
-
2026-05-06$226,000 Active
-
2011-03-06historical
-
2011-01-06$104,900
-
2011-01-01historical
-
2010-07-01$99,900
-
2010-02-25soldstatus $65,000
-
2009-09-11$72,000
-
2006-07-10soldstatus $106,000
-
2006-06-30soldstatus $106,000
-
2006-04-03$104,900
-
2003-10-09historical
-
2003-06-27$96,000
ⓘ Source: listings_history table (triggers on properties + properties_extension) + one-shot
backfill from property_details.listing_events for pre-trigger history.
Tax reassessment forecast KY · Resets to sale price
- Current annual tax
- $2,396 · $200/mo
- Projected year-2 tax
- $2,396 · $200/mo
- Expected delta
- $0/yr ($0/mo · 0.0%)
ⓘ Screening estimate from a state-policy table — verify with the county assessor before closing.
Climate risk First Street
- Flood 1/10 Low FEMA zone X (unshaded) · 0% chance over 30 yrs
- Wildfire 2/10 Low
- Heat 5/10 Major 7 d/yr ≥104°F today · 19 d/yr by 30 yrs out
- Wind 2/10 Low 3% chance of damaging wind over 30 yrs
- Air quality 3/10 Moderate 2 unhealthy d/yr today · 5 by 30 yrs out
Nearby sold comps map
Loading sold comps map…
Walkable amenities ~0.75 mi
Loading nearby amenities…
Taxation est. · year 1
- Rental income
- $23,078
- − Mortgage interest
- −$12,660
- − Property taxes
- −$2,396
- − Insurance
- −$1,130
- − Repairs & maintenance
- −$1,846
- − Management
- −$1,846
- − Depreciation
- −$6,575
- Taxable loss
- −$3,375
- Est. tax savings @ 24.0%
- +$810
- After-tax cash flow
- $1,293/yr
For passive investors: Depreciation is non-cash, so a rental often shows a tax loss while cash-flowing — sheltering income. Rental losses are passive: they offset passive income freely, and up to $25,000/yr can offset ordinary (W-2) income if you actively participate and your MAGI is under $100k (phasing out to $0 by $150k); unused losses carry forward. On sale, claimed depreciation is recaptured at up to 25%, and gains may owe capital-gains tax (a 1031 exchange can defer both). Figures are a year-1 estimate at your 24.0% rate — not tax advice; consult a CPA.
Schools (NCES district)
- District
- Jefferson County
- NCES district ID
- 2102990
- Math proficiency
- 19% ▼ -17.00%
- Reading proficiency
- 35% ▼ -11.00%
- Median HH income
- $47,885
- Composite
- 23.45/100
- National rank
- #7884
- State rank
- #121 of 165 in KY
Livability — Louisville/Jefferson County metro government (balance)
No livability data for this city. (Only ~50 U.S. cities are tracked.)
Census & demographics
- Census place
- Louisville/Jefferson County metro government (balance), KY
- County
- Jefferson County · 790,184 people
- City population
- 419,741
- Metro
- Louisville/Jefferson County, KY-IN
- Population (ZIP)
- 41,299
- Household income
- $79,936
- Rent vs Own
- Severe rent burden
- 628.0
Population outlook (Jefferson County) Hauer SSP2
- Today (2025)
- 823,112 people
- By 2030
- 849,343 · +3.2%
- By 2040
- 895,696 · +8.8%
- By 2050
- 933,630 · +13.4%
- By 2075
- 1,028,262 · +24.9%
- By 2100
- 1,072,675 · +30.3%
Race, ethnicity, and origin ACS 2023
- Neighborhood character
- Predominantly White (71%)
- Race & ethnicity
- White 71% Black 12% Hispanic / Latino 12% Two or more races 9% Asian 1%
- Hispanic origin (detail)
- Mexican 3% Cuban 6%
- Common ancestry
- Lithuanian 2% Slovak 2% Italian 1%
- Foreign-born
- 9% · Canada
- Languages at home
- 87% English-only · Spanish 10% Other Indo-European 1%
Political lean MEDSL · Jefferson
- 2024 margin
- D (+16.6) · D 57.4% · R 40.9% · Other 1.7%
- 2008→2024 swing
- +4.5pp toward D · 2008: 12.0pp · 2024: 16.6pp
- All cycles
- 2024: D+16.6 2020: D+20.1 2016: D+13.3 2012: D+11.1 2008: D+12.0
Not yet ingested
- Civics
- —
Market trends
- HPI YoY
- ▼ -148.38%
- Current HPI
- 244.2747
- Rent YoY
- ▲ 5.46%
- Metro
- Louisville/Jefferson County, KY-IN
- State GDP YoY
- ▲ 1.81%
- F500 in state
- 4
Industry mix (Fortune 500 HQ in KY)
| Industry | F500 HQs | Revenue |
|---|---|---|
| Healthcare | 1 | $118B |
|
||
| Food / Beverage | 1 | $7B |
|
||
Price history
+135.4% since first listed13 events — show timeline
- 2026-05-13 Pending — Metro Search MLS
- 2026-05-06 Listed $226,000 Metro Search MLS
- 2011-03-06 Listing Removed — Metro Search MLS
- 2011-01-06 Listed $104,900 Metro Search MLS
- 2011-01-01 Listing Removed — Metro Search MLS
- 2010-07-01 Listed $99,900 Metro Search MLS
- 2010-02-25 Sold (MLS) $65,000 Metro Search MLS
- 2009-09-11 Listed $72,000 Metro Search MLS
- 2006-07-10 Sold (Public Records) $106,000 Public Records
- 2006-06-30 Sold (MLS) $106,000 Metro Search MLS
- 2006-04-03 Listed $104,900 Metro Search MLS
- 2003-10-09 Listing Removed — Metro Search MLS
- 2003-06-27 Listed $96,000 Metro Search MLS
Property tax history
+7.5%/yrLatest (2025): $2,396 · +45.5% YoY. Source: county tax records.
Cash-flow waterfall
monthlySold comps — $/sqft
last 12 mo · ≤1 miLoading sold comps…