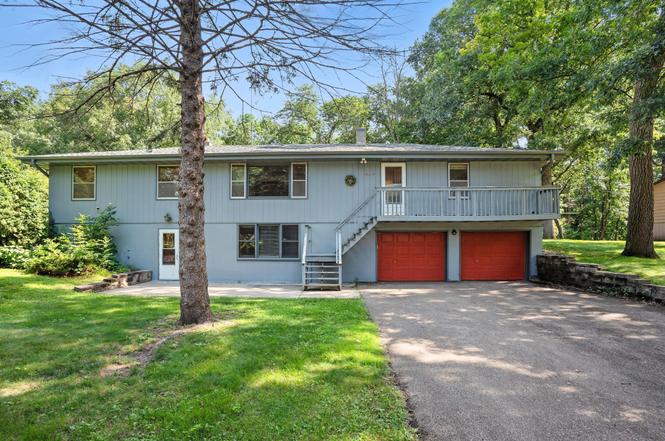
10279 Upper 196th Way W · Lakeville, MN
Flood risk 4/10 · Minor
- FEMA flood zone
- X (unshaded)
- Chance of flooding over 30 yrs
- 0.24%
- Est. flood insurance / yr
- $507 – $1,088
Fire risk 1/10 · Minimal
- Est. fire insurance / yr
- $888 – $1,650
Heat risk 2/10 · Minimal
- Hot days now (above 99°F)
- 7 days/yr
- Hot days in 30 yrs
- 14 days/yr
Wind risk 2/10 · Minimal
- Chance of severe wind over 30 yrs
- —
Air-quality risk 2/10 · Minimal
- Unhealthy air days now
- 1 days/yr
- Unhealthy air days in 30 yrs
- 1 days/yr
Risk factors via First Street. Map © Google.
Why this score? — see what drove the D+ grade
The composite is a weighted blend of 9 inputs, each scored 0–100. Each bar is that input's sub-score; the figure is the points it added to the 100-point composite (weight × sub-score).
- ARV discount +15.0/15.0
- Cash flow +11.4/30.0
- Schools +5.6/10.0
- Livability +4.2/5.0
- DSCR +3.3/10.0
- Rent growth +3.3/5.0
- 1% rule +2.9/10.0
- Condition / age +2.5/5.0
- Appreciation +0.0/10.0
$399,900
🖨 Deal sheet 📄 Offer letter ✓ Due diligence
Listing remarks
Hard to find 6 bedroom, (yes we said 6 bedroom), home in a well established Lakeville neighborhood, steps away from Lake Marion. This home is easily sub-dividable, to offer 2 separate living areas. Perfect for multi-generational families, families in need of a teen retreat, possible rental income. Four bedrooms on the upper level with 2 large gathering areas, eat in kitchen, walk out to backyard. Two bedrooms on the lower level with second kitchen, family room and a roll in shower. This home has original hardwood floors, new carpet and new interior paint. Location couldn't be better as you have easy walking or biking to the beach, parks, schools and shopping. Enjoy your private backyard on
Key facts
- 0.61 acre lot
- 2 garage spots
- Built 1960
Neighborhood map
What this means for you Summary
Snapshot
- This is a 5-bed/2.0-bath single-family listed at $400k.
Deal economics
- At list price, monthly cash flow is $-141 ($-2k/yr) — negative.
- To cash-flow at today's rent, offer at most $375k (6.2% below list).
- To meet the 1% rule (rent ≥ 1% of price), the offer needs to be $318k (20.6% below list).
- Recommended offer: $318k (20.6% below list) — sets the bar for 1% rule.
- Cap rate 5.9% vs local median 3.2% in Lakeville — top-decile yield for the area; either an underpriced asset or a hidden risk that comps aren't pricing in. Stress-test before assuming the spread holds.
Location & tenants
- Location reads 84/100 on livability (#25 in MN, #711 nationally) — a professional / high-income tenant draw. Strengths: schools A+, crime A+, employment A+; Watch: amenities D+, commute F, cost of living F.
- Lakeville Public School District (suburban): math 57% / reading 65% proficiency, ranked #21 of 301 in MN (top 7%) — acceptable for families but not a draw, mixed tenant base, ~2y average lease; only 10% free/reduced lunch — higher-income household profile.
- Market conditions: Rents rising (+3.4%/yr); 713 active listings in the ZIP; 1 comparable units currently listed for rent nearby; high-income renter base; 2,134 units permitted in Dakota County in 2024 (898 in 5+ unit buildings).
Forward outlook
- Local home prices are declining (-3.0%/yr); year-one equity from $3k of loan paydown is wiped out by about $12k of value loss. Plan a longer hold.
- Dakota County population projected at +11% by 2050 — modest demand growth; plan on rents tracking national, not racing it.
Negotiation context
- It's been on market 252 days — a 12% lower offer ($352k) is reasonable based on typical stale-listing flexibility.
- 2 sale attempts; this cycle's ask has dropped $39k (9%) from the opening price — seller is motivated, your offer sets the floor, not the list.
Questions for the listing agent
- What do current leases actually rent for vs. the listed asking? Can we see a recent rent roll and the last 12 months of T-12 income?
- It's been on market 252 days. Have you received any prior offers? Is the seller open to a 21% concession, seller financing, or rate buy-down credit?
- Built in 1960 — when were the roof, HVAC, electrical panel, plumbing, and water heater last replaced?
- Why hasn't it sold? Are there any deal-killer items the seller is aware of (foundation, flood, title, zoning, code violations)?
- Is there a deadline driving the sale (1031 exchange, divorce, estate, relocation)? That informs how much negotiation room exists.
- Schools are A-rated — typically a magnet for longer-tenancy family renters. What's the average tenant stay here, and is there a school-zone premium baked into asking?
- The area grade is low — what's the realistic commute time and amenity access for the typical tenant pool here? Any planned neighborhood developments (good or bad) we should know about?
- What's the average days-on-market for RENTAL listings here right now (not sales)? A rising rental-DOM trend means longer vacancies and softer asking-rent achievability than the comps imply.
- What's the recent tenant-quality profile in this submarket — average credit score on applications, eviction rate, late-payment / NSF rate, and stable-employment percentage? A property-management company in the area should have these aggregated.
- How much new for-sale + rental construction is in the pipeline within 1–3 miles? Heavy new supply typically softens prices + rents 12–24 months out; constrained supply supports both.
Investment metrics
- 1% rule
- 0.79% ✗
- Cap rate
- 5.87%
- Cash-on-cash
- -1.51%
- DSCR
- 0.93
- GRM
- 10.5
CMA / ARV
- ARV (on-the-fly)
- $561,960
- Comps found
- 1
Show comp detail 1 sale within ~0.75 mi
| Address | Dist | Beds/Ba | Sqft | Sold | Price | $/sf | Match |
|---|---|---|---|---|---|---|---|
| 19827 Iris Way | 0.59mi | 4/3.0 (-1) | 2,552 (-5%) | 22mo | $535,000 | $210 | 37 |
Match score weights: distance 35% · size 25% · config 20% · recency 20%. Top-matched comps best support the ARV.
Projected returns pro-forma
-3.0% appreciation · 3.38% rent growth · sell at horizon
- IRR
- -18.4%
- Equity multiple
- 0.35×
- Total profit
- $-72,606
- Equity at exit
- $59,626
- IRR
- -10.1%
- Equity multiple
- 0.38×
- Total profit
- $-69,863
- Equity at exit
- $34,576
Cash invested: $111,972 (down + closing). Projections, not guarantees.
Landlord ↔ Tenant lean methodology
- Overall (STATE)
- 46 Balanced
- State Minnesota
- 46 Balanced · D+2
- County
- — inherits STATE
- City
- — inherits STATE
ZIP-level market 55044
- Rents YoY
- 3.4%
- Active inventory
- 713
- Price-to-rent
- 10.5×
Monthly cashflow live
- Estimated rent
- $3,176 medium interval (Pro) →
- Mortgage (P&I)
- −$2,097
- Tax from tax record
- −$387 /mo · $4,642/yr
- Insurance
- −$167
- HOA
- −$0
- Vacancy / Maint / Mgmt
- −$667
- Net cashflow
- $-141
Break-even live
UW: 25.0% down · 7.5% · 30yr · 1.5% tax · 5.0% vac · 8.0% maint · 8.0% mgmt
Financing live
Cash to close
- Down payment
- $99,975
- Closing costs
- $11,997
- Reserves months
- —
- Total cash needed
- —
Loan-product check · same deal, 3 products live
Conventional
25% down · 7.5% · 30yr
- Down + closing
- —
- Monthly P&I
- —
- Monthly cashflow
- —
- DSCR
- —
- Eligible?
- —
Personal DTI + credit; lowest rate.
DSCR
20% down · 8.5% · 30yr
- Down + closing
- —
- Monthly P&I
- —
- Monthly cashflow
- —
- DSCR
- —
- Eligible?
- —
No personal income docs; deal must DSCR.
Hard money
10% down · 12.0% · 12mo
- Down + closing
- —
- Monthly P&I
- —
- Monthly cashflow
- —
- DSCR
- —
- Eligible?
- —
Short-term bridge; refi at stabilization.
Rent comps 1 comps
| Address | Beds | Baths | Sqft | Rent | $/sqft | DOM | Units | Dist |
|---|---|---|---|---|---|---|---|---|
| 20427 Jupiter Way Lakeville, MN | 4.0 | 4.0 | 2876 | $3,700 | $1.29 | 43d | 1 | 0.89mi |
Listing history 8 events
-
2026-04-03status Pending
-
2026-03-30historical Contingent - Inspection
-
2025-11-10status Active
-
2025-11-02historical Contingent - Inspection
-
2025-10-26price $399,900
-
2025-08-12price $429,900
-
2025-07-26$439,000 Active
-
2025-07-24historical $439,000
ⓘ Source: listings_history table (triggers on properties + properties_extension) + one-shot
backfill from property_details.listing_events for pre-trigger history.
Tax reassessment forecast MN · Partial reset (capped growth)
- Current annual tax
- $4,642 · $387/mo
- Projected year-2 tax
- $4,642 · $387/mo
- Expected delta
- $0/yr ($0/mo · 0.0%)
ⓘ Screening estimate from a state-policy table — verify with the county assessor before closing.
Climate risk First Street
- Flood 4/10 Moderate FEMA zone X (unshaded) · 24% chance over 30 yrs
- Wildfire 1/10 Low
- Heat 2/10 Low 7 d/yr ≥99°F today · 14 d/yr by 30 yrs out
- Wind 2/10 Low
- Air quality 2/10 Low 1 unhealthy d/yr today · 1 by 30 yrs out
Nearby sold comps map
Loading sold comps map…
Walkable amenities ~0.75 mi
Loading nearby amenities…
Taxation est. · year 1
- Rental income
- $38,115
- − Mortgage interest
- −$22,401
- − Property taxes
- −$4,642
- − Insurance
- −$2,000
- − Repairs & maintenance
- −$3,049
- − Management
- −$3,049
- − Depreciation
- −$11,633
- Taxable loss
- −$8,659
- Est. tax savings @ 24.0%
- +$2,078
- After-tax cash flow
- $382/yr
For passive investors: Depreciation is non-cash, so a rental often shows a tax loss while cash-flowing — sheltering income. Rental losses are passive: they offset passive income freely, and up to $25,000/yr can offset ordinary (W-2) income if you actively participate and your MAGI is under $100k (phasing out to $0 by $150k); unused losses carry forward. On sale, claimed depreciation is recaptured at up to 25%, and gains may owe capital-gains tax (a 1031 exchange can defer both). Figures are a year-1 estimate at your 24.0% rate — not tax advice; consult a CPA.
Schools (NCES district)
- District
- Lakeville Public School District
- NCES district ID
- 2717780
- Math proficiency
- 57% ▼ -12.00%
- Reading proficiency
- 65% ▼ -8.00%
- Median HH income
- $96,899
- Composite
- 56.36/100
- National rank
- #1164
- State rank
- #21 of 301 in MN
Livability — Lakeville
- Score
- 84/100
- State rank
- #25
- US rank
- #711
Category grades
Schools grade is shown separately in the Schools card above.
Census & demographics
- Census place
- Lakeville, MN
- County
- Dakota County · 417,704 people
- City population
- 64,762
- Metro
- Minneapolis-St. Paul-Bloomington, MN-WI
- Population (ZIP)
- 64,762
- Household income
- $141,551
- Rent vs Own
- Severe rent burden
- 956.0
Population outlook (Dakota County) Hauer SSP2
- Today (2025)
- 450,671 people
- By 2030
- 465,068 · +3.2%
- By 2040
- 486,770 · +8.0%
- By 2050
- 498,743 · +10.7%
- By 2075
- 533,865 · +18.5%
- By 2100
- 550,133 · +22.1%
Race, ethnicity, and origin ACS 2023
- Neighborhood character
- Predominantly White (80%)
- Race & ethnicity
- White 80% Hispanic / Latino 6% Asian 6% Two or more races 5% Black 4%
- Hispanic origin (detail)
- Mexican 4%
- Common ancestry
- Portuguese 13% Romanian 4% Italian 3%
- Foreign-born
- 9% · Canada, Vietnam, South Korea
- Languages at home
- 88% English-only · Spanish 4% Other Asian/Pacific 2% Vietnamese 1%
Political lean MEDSL · Dakota
- 2024 margin
- D (+12.9) · D 55.4% · R 42.5% · Other 2.1%
- 2008→2024 swing
- +7.4pp toward D · 2008: 5.5pp · 2024: 12.9pp
- All cycles
- 2024: D+12.9 2020: D+13.9 2016: D+4.7 2012: D+2.9 2008: D+5.5
Not yet ingested
- Civics
- —
Market trends
- HPI YoY
- ▼ -165.50%
- Current HPI
- 216.0601
- Rent YoY
- ▲ 3.38%
- Metro
- Minneapolis-St. Paul-Bloomington, MN-WI
- State GDP YoY
- ▲ 2.41%
- F500 in state
- 34
Industry mix (Fortune 500 HQ in MN)
| Industry | F500 HQs | Revenue |
|---|---|---|
| Healthcare | 2 | $407B |
|
||
| Retail | 2 | $150B |
|
||
| Consumer Goods | 2 | $32B |
|
||
| Industrial Machinery | 2 | $6B |
|
||
| Agriculture | 1 | $40B |
|
||
| Healthcare / Medical Devices | 1 | $32B |
|
||
Price history
-8.9% since first listed8 events — show timeline
- 2026-04-03 Pending — NORTHSTARMLS as Distributed by MLS Grid
- 2026-03-30 Contingent — NORTHSTARMLS as Distributed by MLS Grid
- 2025-11-10 Relisted — NORTHSTARMLS as Distributed by MLS Grid
- 2025-11-02 Contingent — NORTHSTARMLS as Distributed by MLS Grid
- 2025-10-26 Price Changed $399,900 NORTHSTARMLS as Distributed by MLS Grid
- 2025-08-12 Price Changed $429,900 NORTHSTARMLS as Distributed by MLS Grid
- 2025-07-26 Listed $439,000 NORTHSTARMLS as Distributed by MLS Grid
- 2025-07-24 Coming Soon $439,000 NORTHSTARMLS as Distributed by MLS Grid
Property tax history
+4.5%/yrLatest (2025): $4,642 · -1.2% YoY. Source: county tax records.
Cash-flow waterfall
monthlySold comps — $/sqft
last 12 mo · ≤1 miLoading sold comps…