68-101 Waialua Beach Rd #103 · Mokuleia, HI
Flood risk 6/10 · Moderate
- FEMA flood zone
- X (shaded)
- Chance of flooding over 30 yrs
- 0.7%
- Est. flood insurance / yr
- $507 – $1,088
Fire risk No data
- Est. fire insurance / yr
- —
Heat risk No data
- Hot days now (above threshold)
- —
- Hot days in 30 yrs
- —
Wind risk No data
- Chance of severe wind over 30 yrs
- —
Air-quality risk 1/10 · Minimal
- Unhealthy air days now
- —
- Unhealthy air days in 30 yrs
- —
Risk factors via First Street. Map © Google.
Why this score? — see what drove the D grade
The composite is a weighted blend of 9 inputs, each scored 0–100. Each bar is that input's sub-score; the figure is the points it added to the 100-point composite (weight × sub-score).
- ARV discount +10.2/15.0
- Appreciation +7.2/10.0
- Cash flow +7.0/30.0
- Schools +3.7/10.0
- 1% rule +2.9/10.0
- Livability +2.9/5.0
- Rent growth +2.5/5.0
- Condition / age +2.5/5.0
- DSCR +1.2/10.0
$359,000
🖨 Deal sheet (PDF) 📄 Offer letter ✓ Due diligence
Listing remarks MLS
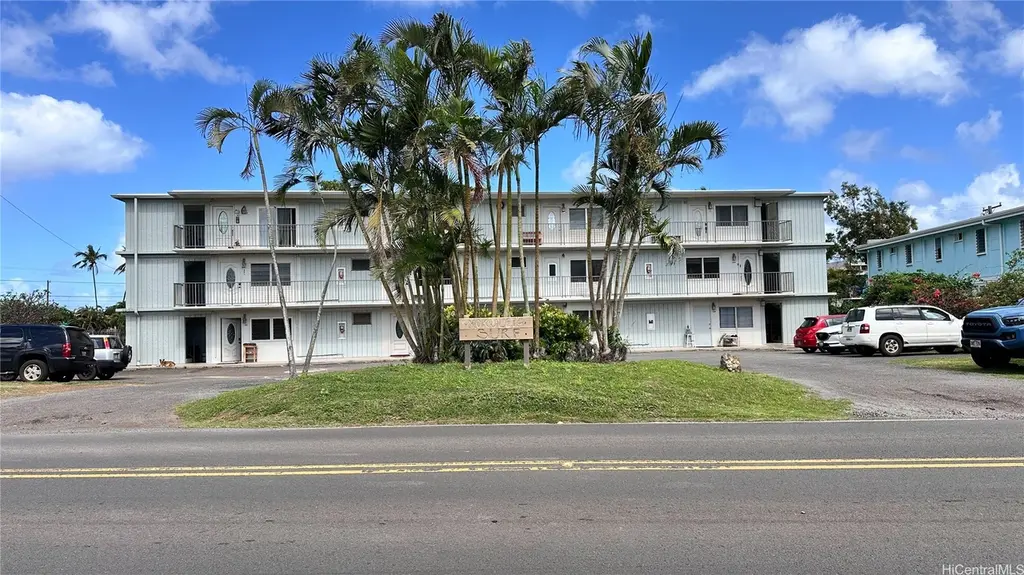
Discover the charm of Mokuleia Surf! This ground floor condo is just 2 blocks from the beach, offering cool breezes and beautiful mountain views. Embrace the North Shore lifestyle in this desirable Waialua location-close to surf spots, hiking trails, and the heart of Haleiwa Town. This fixer upper is ready for your custom touch-bring your ideas and transform this space into your perfect island retreat. Whether you're an investor, first-time buyer, or searching for a second home, this property offers a great potential and the laid-back vibe that makes the North Shore so special.
Key facts
- Ground floor condo
- Waialua location
- Surf spots
Tags
Neighborhood map
What this means for you Summary
Snapshot
- This is a 2-bed/1.0-bath condo listed at $359k.
Deal economics
- At list price, monthly cash flow is $-529 ($-6k/yr) — negative.
- To cash-flow at today's rent, offer at most $266k (26.0% below list).
- To meet the 1% rule (rent ≥ 1% of price), the offer needs to be $285k (20.6% below list).
- Recommended offer: $266k (26.0% below list) — sets the bar for cash-flow.
Location & tenants
- Location reads 58/100 on livability (#112 in HI) — a working-class tenant base; expect higher turnover. Strengths: crime A+, employment A+; Watch: health & safety C-, amenities F, commute F.
- Hawaii Department Of Education (suburban): math 32% / reading 50% proficiency, ranked #1 of 1 in HI (top 100%) — families likely to look elsewhere, expect single-tenant / working-renter base with shorter leases.
- Zoned schools: Waialua Elementary School (math 59% / reading 65%, grade B, #26 of 183 statewide, top 14%, 442 students, 46% FRL); Waialua High & Intermediate School (math 30% / reading 61%, grade D-, #19 of 43 statewide, top 43%, 621 students, 43% FRL).
- Zoned-school proficiency averages 54% at this address vs 41% district-wide (+13 pts) — the actual schools serving this property are materially stronger than the Hawaii Department Of Education average implies; a family-tenant draw the district grade alone would hide.
- Market conditions: 71 active listings in the ZIP; 5 comparable units currently listed for rent nearby; rentals at typical pace (median 26d on market — plan ~3-4 weeks tenant-placement turnaround); solid renter incomes; 1,638 units permitted in Honolulu County in 2024 (793 in 5+ unit buildings).
- This rent runs 35% of the median local income ($97k/yr) — at the standard rent-burdened threshold; future hikes will face affordability resistance.
Forward outlook
- In year one you build about $18k of equity ($2k loan paydown + $16k appreciation (4.3% local appreciation)).
- Honolulu County population projected at +17% by 2050 — long-run rental-demand tailwind backs the buy-and-hold thesis.
- By year 3, paydown + projected appreciation supports a ~$45k cash-out refi (75% LTV) — recoverable capital for the next deal without selling this one.
Negotiation context
- It's been on market 107 days — a 9% lower offer ($327k) is reasonable based on typical stale-listing flexibility.
- Current owner paid $135k; list at $359k implies a 166% gain — meaningful room to come down on a strong offer.
Risks & watch-outs
- Watch-outs: HOA is 23% of rent.
- Climate carrying-cost: major flood risk — expect insurance premiums to compound above CPI over the hold.
Questions for the listing agent
- What do current leases actually rent for vs. the listed asking? Can we see a recent rent roll and the last 12 months of T-12 income?
- It's been on market 107 days. Have you received any prior offers? Is the seller open to a 26% concession, seller financing, or rate buy-down credit?
- Built in 1975 — when were the roof, HVAC, electrical panel, plumbing, and water heater last replaced?
- What does the HOA fee cover, when was the last increase, and are there any pending special assessments or reserve-fund shortfalls?
- Any open or pending special assessments — roof, HVAC, plumbing, elevator, façade? What's the per-unit balance and payoff schedule, and is the seller paying it off at close or rolling it to the buyer?
- Why hasn't it sold? Are there any deal-killer items the seller is aware of (foundation, flood, title, zoning, code violations)?
- Is there a deadline driving the sale (1031 exchange, divorce, estate, relocation)? That informs how much negotiation room exists.
- The area grade is low — what's the realistic commute time and amenity access for the typical tenant pool here? Any planned neighborhood developments (good or bad) we should know about?
- What's the average days-on-market for RENTAL listings here right now (not sales)? A rising rental-DOM trend means longer vacancies and softer asking-rent achievability than the comps imply.
- What's the recent tenant-quality profile in this submarket — average credit score on applications, eviction rate, late-payment / NSF rate, and stable-employment percentage? A property-management company in the area should have these aggregated.
- How much new apartment / multifamily construction is in the pipeline within 1–3 miles? Heavy new supply (>2% of stock underway) typically softens rents 12–24 months out; light construction supports rent growth.
Investment metrics
- 1% rule
- 0.79% ✗
- Cap rate
- 4.53%
- Cash-on-cash
- -6.31%
- DSCR
- 0.72
- GRM
- 10.5
CMA / ARV
- ARV (median comp)
- $382,299
- List price
- $359,000
- Delta
- -6.09%
- Verdict
- FAIR
- Comps
- 20 within 1.0 mi
Projected returns pro-forma
4.33% appreciation · 3.0% rent growth · sell at horizon
- IRR
- 5.7%
- Equity multiple
- 1.35×
- Total profit
- $35,626
- Equity at exit
- $188,903
- IRR
- 8.2%
- Equity multiple
- 2.44×
- Total profit
- $144,304
- Equity at exit
- $314,591
Cash invested: $100,520 (down + closing). Projections, not guarantees.
Landlord ↔ Tenant lean methodology
- Overall (STATE)
- 37 Tenant-Leaning
- State Hawaii
- 37 Tenant-Leaning · D+13
- County
- — inherits STATE
- City
- — inherits STATE
ZIP-level market 96791
- Home prices YoY
- 0.9%
- Active inventory
- 71
- Price-to-rent
- 10.5×
Monthly cashflow live
- Estimated rent
- $2,850 high interval (Pro) →
- Mortgage (P&I)
- −$1,883
- Tax from tax record
- −$80 /mo · $961/yr
- Insurance
- −$150
- HOA
- −$668
- Vacancy / Maint / Mgmt
- −$598
- Net cashflow
- $-529
Break-even live
Sensitivity live
| Price | -10% $-326 | -5% $-427 | +0% $-529 | +5% $-630 | +10% $-732 |
|---|---|---|---|---|---|
| Rent | -10% $-754 | -5% $-641 | +0% $-529 | +5% $-416 | +10% $-304 |
| Rate | -1.0pp $-348 | -0.5pp $-438 | base $-529 | +0.5pp $-622 | +1.0pp $-716 |
UW: 25.0% down · 7.5% · 30yr · 1.5% tax · 5.0% vac · 8.0% maint · 8.0% mgmt
Financing live
Cash to close
- Down payment
- $89,750
- Closing costs
- $10,770
- Reserves months
- —
- Total cash needed
- —
Loan-product check · same deal, 3 products live
Conventional
25% down · 7.5% · 30yr
- Down + closing
- —
- Monthly P&I
- —
- Monthly cashflow
- —
- DSCR
- —
- Eligible?
- —
Personal DTI + credit; lowest rate.
DSCR
20% down · 8.5% · 30yr
- Down + closing
- —
- Monthly P&I
- —
- Monthly cashflow
- —
- DSCR
- —
- Eligible?
- —
No personal income docs; deal must DSCR.
Hard money
10% down · 12.0% · 12mo
- Down + closing
- —
- Monthly P&I
- —
- Monthly cashflow
- —
- DSCR
- —
- Eligible?
- —
Short-term bridge; refi at stabilization.
Rent comps 5 comps
| Address | Beds | Baths | Sqft | Rent | $/sqft | DOM | Units | Dist |
|---|---|---|---|---|---|---|---|---|
| 68-077 Akule St Unit B Waialua, HI | 2.0 | 1.0 | 600 | $2,800 | $4.67 | 25d | 1 | 0.07mi |
| 68-041 Waialua Beach Rd Waialua, HI | 2.0 | 1.0 | 600 | $2,775 | $4.62 | 46d | 1 | 0.13mi |
| 68-147 Akule St Unit A Waialua, HI | 2.0 | 1.0 | 600 | $2,800 | $4.67 | 25d | 1 | 0.14mi |
| 68-036 Apuhihi St Waialua, HI | 1.0 | 1.0 | 440 | $1,900 | $4.32 | 25d | 1 | 0.18mi |
| 68-269 Crozier Loop Waialua, HI | 2.0 | 1.0 | 728 | $4,150 | $5.70 | 25d | 1 | 0.29mi |
HOA detail condo
- Monthly dues
- $668 · $8,016/yr
- Assessments
- None detected in remarks — confirm with the listing agent.
Listing history 25 events
-
2026-06-21days on market $359,000 Active 107 DOM
-
2026-06-18days on market $359,000 Active 104 DOM
-
2026-06-17days on market $359,000 Active 103 DOM
-
2026-06-16days on market $359,000 Active 102 DOM
-
2026-06-15days on market $359,000 Active 101 DOM
-
2026-06-13days on market $359,000 Active 99 DOM
-
2026-06-13days on market $359,000 Active 98 DOM
-
2026-06-10days on market $359,000 Active 96 DOM
-
2026-06-09days on market $359,000 Active 95 DOM
-
2026-06-08days on market $359,000 Active 94 DOM
-
2026-06-07days on market $359,000 Active 93 DOM
-
2026-06-05days on market $359,000 Active 90 DOM
-
2026-06-03days on market $359,000 Active 89 DOM
-
2026-06-02days on market $359,000 Active 88 DOM
-
2026-06-01days on market $359,000 Active 87 DOM
-
2026-05-31days on market $359,000 Active 86 DOM
-
2026-03-06$377,000 Active 584-char remark
Show marketing remark (584 chars)
Discover the charm of Mokuleia Surf! This ground floor condo is just 2 blocks from the beach, offering cool breezes and beautiful mountain views. Embrace the North Shore lifestyle in this desirable Waialua location-close to surf spots, hiking trails, and the heart of Haleiwa Town. This fixer upper is ready for your custom touch-bring your ideas and transform this space into your perfect island retreat. Whether you're an investor, first-time buyer, or searching for a second home, this property offers a great potential and the laid-back vibe that makes the North Shore so special.
-
2005-01-21soldstatus $135,000
-
2003-03-07soldstatus $43,000
-
1991-08-27soldstatus $90,000
-
1990-06-04soldstatus $42,500
-
1987-11-01soldstatus $17,000
-
1985-02-01soldstatus $24,000
-
1982-01-01soldstatus $65,000
-
1980-06-01soldstatus $300,000
ⓘ Source: listings_history table (triggers on properties + properties_extension) + one-shot
backfill from property_details.listing_events for pre-trigger history.
Tax reassessment forecast HI · Partial reset (capped growth)
- Current annual tax
- $961 · $80/mo
- Projected year-2 tax
- $983 · $82/mo
- Expected delta
- +$22/yr (+$2/mo · 2.3%)
ⓘ Screening estimate from a state-policy table — verify with the county assessor before closing.
Climate risk First Street
- Flood 6/10 Major FEMA zone X (shaded) · 70% chance over 30 yrs
- Air quality 1/10 Low
Nearby sold comps map
Loading sold comps map…
Walkable amenities ~0.75 mi
Loading nearby amenities…
Taxation est. · year 1
- Rental income
- $34,200
- − Mortgage interest
- −$20,110
- − Property taxes
- −$961
- − Insurance
- −$1,795
- − Repairs & maintenance
- −$2,736
- − Management
- −$2,736
- − HOA
- −$8,016
- − Depreciation
- −$10,444
- Taxable loss
- −$12,597
- Est. tax savings @ 24.0%
- +$3,023
- After-tax cash flow
- $-3,322/yr
For passive investors: Depreciation is non-cash, so a rental often shows a tax loss while cash-flowing — sheltering income. Rental losses are passive: they offset passive income freely, and up to $25,000/yr can offset ordinary (W-2) income if you actively participate and your MAGI is under $100k (phasing out to $0 by $150k); unused losses carry forward. On sale, claimed depreciation is recaptured at up to 25%, and gains may owe capital-gains tax (a 1031 exchange can defer both). Figures are a year-1 estimate at your 24.0% rate — not tax advice; consult a CPA.
Schools (NCES district)
- District
- Hawaii Department Of Education
- NCES district ID
- 1500030
- Math proficiency
- 32% ▼ -10.00%
- Reading proficiency
- 50% ▼ -3.00%
- Median HH income
- $69,005
- Composite
- 37.07/100
- National rank
- #4504
- State rank
- #1 of 1 in HI
Livability — Mokuleia
- Score
- 58/100
- State rank
- #112
- US rank
- #21514
Category grades
Schools grade is shown separately in the Schools card above.
Census & demographics
- Census place
- Mokuleia, HI
- County
- Honolulu County · 963,448 people
- Metro
- Urban Honolulu, HI
- Population (ZIP)
- 6,377
- Household income
- $97,470
- Rent vs Own
- Severe rent burden
- 203.0
Population outlook (Honolulu County) Hauer SSP2
- Today (2025)
- 1,072,641 people
- By 2030
- 1,110,460 · +3.5%
- By 2040
- 1,181,593 · +10.2%
- By 2050
- 1,257,584 · +17.2%
- By 2075
- 1,501,120 · +39.9%
- By 2100
- 1,764,430 · +64.5%
Race, ethnicity, and origin ACS 2023
- Neighborhood character
- Highly diverse neighborhood (Simpson 0.78)
- Race & ethnicity
- White 33% Asian 32% Two or more races 25% Hispanic / Latino 7% Pacific Islander 6%
- Hispanic origin (detail)
- Mexican 2% Puerto Rican 2%
- Common ancestry
- Lithuanian 3% Russian 2% Italian 1%
- Foreign-born
- 20% · Canada
- Languages at home
- 78% English-only · Other Asian/Pacific 8% Tagalog/Filipino 8% Other Indo-European 2%
Political lean MEDSL · Honolulu
- 2024 margin
- Strong D (+21.6) · D 59.9% · R 38.3% · Other 1.8%
- 2008→2024 swing
- -19.4pp toward R · 2008: 41.1pp · 2024: 21.6pp
- All cycles
- 2024: D+21.6 2020: D+26.9 2016: D+29.9 2012: D+39.1 2008: D+41.1
Not yet ingested
- Civics
- —
Market trends
- HPI YoY
- ▲ 4.33%
- Current HPI
- 473.2549
- Rent YoY
- —
- Metro
- Urban Honolulu, HI
- State GDP YoY
- —
- F500 in state
- 0
Price history
+25.7% since first listed9 events — show timeline
- 2026-03-06 Listed $377,000 HiCentral MLS
- 2005-01-21 Sold (Public Records) $135,000 Public Records
- 2003-03-07 Sold (Public Records) $43,000 Public Records
- 1991-08-27 Sold (Public Records) $90,000 Public Records
- 1990-06-04 Sold (Public Records) $42,500 Public Records
- 1987-11-01 Sold (Public Records) $17,000 Public Records
- 1985-02-01 Sold (Public Records) $24,000 Public Records
- 1982-01-01 Sold (Public Records) $65,000 Public Records
- 1980-06-01 Sold (Public Records) $300,000 Public Records
Property tax history
+4.8%/yrLatest (2022): $961 · +17.5% YoY. Source: county tax records.
Cash-flow waterfall
monthlySold comps — $/sqft
last 12 mo · ≤1 miLoading sold comps…