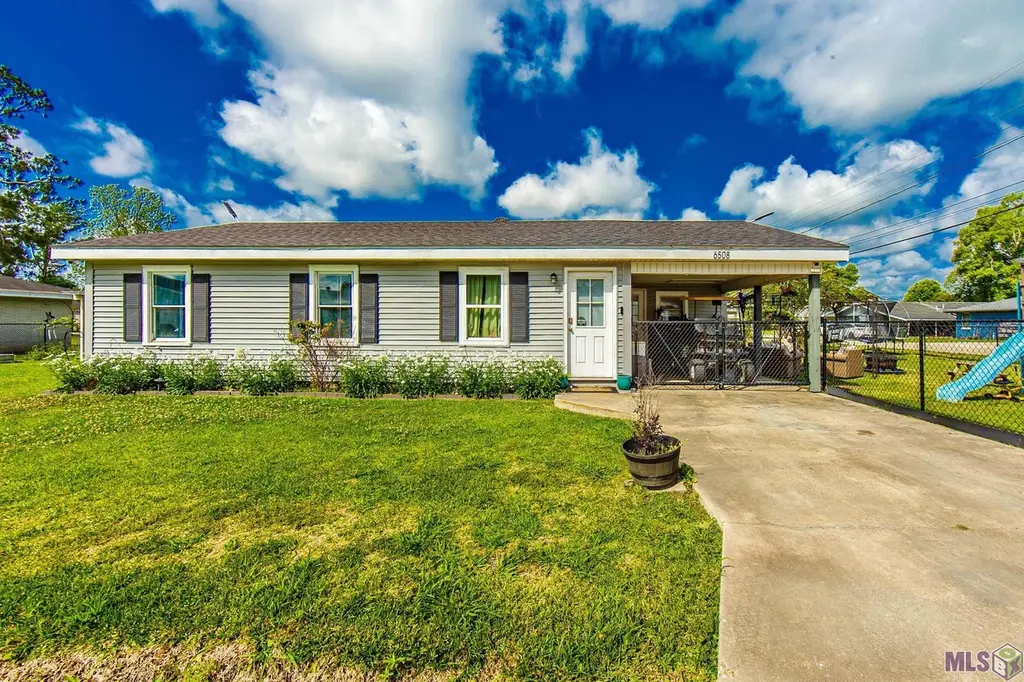
6508 Mccoy St · Bayou Cane, LA
Flood risk 6/10 · Moderate
- FEMA flood zone
- X (unshaded)
- Chance of flooding over 30 yrs
- 0.27%
- Est. flood insurance / yr
- $507 – $1,088
Fire risk 1/10 · Minimal
- Est. fire insurance / yr
- $1,269 – $2,357
Heat risk 9/10 · Severe
- Hot days now (above 107°F)
- 7 days/yr
- Hot days in 30 yrs
- 22 days/yr
Wind risk 9/10 · Severe
- Chance of severe wind over 30 yrs
- 99.0%
Air-quality risk 1/10 · Minimal
- Unhealthy air days now
- 0 days/yr
- Unhealthy air days in 30 yrs
- 0 days/yr
Risk factors via First Street. Map © Google.
Why this score? — see what drove the D- grade
The composite is a weighted blend of 9 inputs, each scored 0–100. Each bar is that input's sub-score; the figure is the points it added to the 100-point composite (weight × sub-score).
- Cash flow +14.4/30.0
- DSCR +4.4/10.0
- Schools +3.3/10.0
- Rent growth +3.2/5.0
- Livability +3.2/5.0
- 1% rule +3.0/10.0
- Condition / age +2.5/5.0
- ARV discount +0.9/15.0
- Appreciation +0.0/10.0
$180,000
🖨 Deal sheet (PDF) 📄 Offer letter ✓ Due diligence
Listing remarks MLS
Well-maintained 3 bedroom, 2 bathroom home offering approximately 1,179 living square feet. Interior features an open living and kitchen area with updated cabinetry, granite countertops, and stainless appliances. Durable flooring runs throughout the main living spaces for easy maintenance. Exterior highlights include covered parking, a spacious fenced backyard, and a great setup for outdoor enjoyment with a patio/pergola area and plenty of room for gatherings or play. Conveniently located in Houma with easy access to local amenities. All measurements and zoning to be verified by buyer.
Key facts
- Durable flooring
- Covered parking
- Stainless appliances
Tags
Neighborhood map
What this means for you Summary
Snapshot
- This is a 3-bed/2.0-bath single-family listed at $180k.
Deal economics
- At list price, monthly cash flow is $38 ($450/yr) — positive.
- The deal already cash-flows at list — no discount required.
- To meet the 1% rule (rent ≥ 1% of price), the offer needs to be $145k (19.6% below list).
- Recommended offer: $145k (19.6% below list) — sets the bar for 1% rule.
- Cap rate 6.5% vs local median 3.3% in Bayou Cane — top-decile yield for the area; either an underpriced asset or a hidden risk that comps aren't pricing in. Stress-test before assuming the spread holds.
Location & tenants
- Location reads 65/100 on livability (#140 in LA) — a middle-class / working-renter tenant base. Strengths: cost of living A+, housing A+, health & safety B+; Watch: crime D-, amenities F, commute F.
- Terrebonne Parish (other): math 32% / reading 46% proficiency, ranked #23 of 98 in LA (top 24%) — families likely to look elsewhere, expect single-tenant / working-renter base with shorter leases; 62% free/reduced lunch — lower-income household profile, screen leases tightly.
- Zoned schools: Lisa Park Elementary School (math 32% / reading 55%, grade F, #194 of 646 statewide, top 30%, 578 students, 61% FRL); Houma Junior High School (math 23% / reading 49%, grade F, #84 of 218 statewide, top 41%, 729 students, 56% FRL); Terrebonne High School (math 38% / reading 41%, grade F, #80 of 265 statewide, top 32%, 1,386 students, 49% FRL).
- Market conditions: Rents rising (+2.8%/yr); 357 active listings in the ZIP; 9 comparable units currently listed for rent nearby; rentals lingering (median 46d on market — plan ~5-8 weeks vacancy on turnover, expect pricing pressure); 100% of comp listings sitting > 30 days — soft ceiling on asking rent; solid renter incomes; 300 units permitted in Terrebonne Parish in 2024 (0 in 5+ unit buildings).
Forward outlook
- Local home prices are declining (-3.0%/yr); year-one equity from $1k of loan paydown is wiped out by about $5k of value loss. Plan a longer hold.
Negotiation context
- Only 2 days on market — expect competitive offers; lowballing is unlikely to land.
- 4 sale attempts since 6y ago with the ask held roughly flat each time — persistent listings suggest the price (not the market) is what's stuck; bring a comps-based counter.
Risks & watch-outs
- Climate carrying-cost: major flood risk; severe wind risk, 99% chance of damaging wind over 30y; extreme-heat days projected 7→22/yr by 2055 (HVAC capex compounding) — expect insurance premiums to compound above CPI over the hold.
Questions for the listing agent
- Built in 1978 — when were the roof, HVAC, electrical panel, plumbing, and water heater last replaced?
- Is there a deadline driving the sale (1031 exchange, divorce, estate, relocation)? That informs how much negotiation room exists.
- Schools are F-rated, which usually means shorter tenancies and higher turnover. Who's the typical renter profile here, and what's been the actual vacancy rate?
- Crime grade is D in this area — have there been break-ins, vandalism, or insurance claims at this property in the last 3 years? What carrier currently insures it and at what premium?
- The area grade is low — what's the realistic commute time and amenity access for the typical tenant pool here? Any planned neighborhood developments (good or bad) we should know about?
- What's the average days-on-market for RENTAL listings here right now (not sales)? A rising rental-DOM trend means longer vacancies and softer asking-rent achievability than the comps imply.
- What's the recent tenant-quality profile in this submarket — average credit score on applications, eviction rate, late-payment / NSF rate, and stable-employment percentage? A property-management company in the area should have these aggregated.
- How much new for-sale + rental construction is in the pipeline within 1–3 miles? Heavy new supply typically softens prices + rents 12–24 months out; constrained supply supports both.
Investment metrics
- 1% rule
- 0.80% ✗
- Cap rate
- 6.54%
- Cash-on-cash
- 0.89%
- DSCR
- 1.04
- GRM
- 10.4
CMA / ARV
- ARV (on-the-fly)
- $157,080
- Comps found
- 12
Show comp detail 12 sales within ~0.75 mi
| Address | Dist | Beds/Ba | Sqft | Sold | Price | $/sf | Match |
|---|---|---|---|---|---|---|---|
| 6508 Mccoy St | 0.00mi | 3/2.0 | 1,179 (-1%) | 1mo | $180,000 | $153 | 98 |
| 126 Kellie Dr | 0.18mi | 3/2.0 | 1,209 (+2%) | 4mo | $159,000 | $132 | 86 |
| 218 Ziegler Ave | 0.13mi | 3/1.5 | 1,159 (-3%) | 2mo | $137,000 | $118 | 86 |
| 203 Fairmont Dr | 0.11mi | 3/1.0 | 1,300 (+9%) | 4mo | $123,600 | $95 | 72 |
| 339 Duet St | 0.27mi | 3/1.0 | 1,150 (-3%) | 9mo | $165,000 | $143 | 70 |
| 110 Wayne Ave | 0.46mi | 3/1.5 | 1,200 (+1%) | 9mo | $150,000 | $125 | 67 |
| 130 Kellie Dr | 0.18mi | 3/1.5 | 1,352 (+14%) | 0mo | $173,400 | $128 | 67 |
| 112 Wayne Ave | 0.46mi | 3/1.0 | 1,162 (-2%) | 7mo | $155,000 | $133 | 65 |
| 314 Cavaness Dr | 0.67mi | 3/2.0 | 1,240 (+4%) | 1mo | $182,000 | $147 | 61 |
| 202 Fairmont Dr | 0.13mi | 2/1.5 (-1) | 1,367 (+15%) | 6mo | $149,900 | $110 | 57 |
| 300 Jean St | 0.19mi | 3/2.0 | 1,360 (+14%) | 12mo | $113,197 | $83 | 57 |
| 158 Wayne Ave | 0.48mi | 3/1.0 | 1,017 (-14%) | 6mo | $150,000 | $147 | 44 |
Match score weights: distance 35% · size 25% · config 20% · recency 20%. Top-matched comps best support the ARV.
Projected returns pro-forma
-3.0% appreciation · 2.82% rent growth · sell at horizon
- IRR
- -15.1%
- Equity multiple
- 0.46×
- Total profit
- $-27,104
- Equity at exit
- $26,839
- IRR
- -6.9%
- Equity multiple
- 0.57×
- Total profit
- $-21,852
- Equity at exit
- $15,563
Cash invested: $50,400 (down + closing). Projections, not guarantees.
Landlord ↔ Tenant lean methodology
- Overall (STATE)
- 90 Strongly Landlord-Friendly
- State Louisiana
- 90 Strongly Landlord-Friendly · R+12
- County
- — inherits STATE
- City
- — inherits STATE
ZIP-level market 70360
- Rents YoY
- 2.8%
- Active inventory
- 357
- Price-to-rent
- 10.4×
Monthly cashflow live
- Estimated rent
- $1,446 high interval (Pro) →
- Mortgage (P&I)
- −$944
- Tax from tax record
- −$86 /mo · $1,034/yr
- Insurance
- −$75
- HOA
- −$0
- Vacancy / Maint / Mgmt
- −$304
- Net cashflow
- $38
Break-even live
Sensitivity live
| Price | -10% $139 | -5% $88 | +0% $38 | +5% $-13 | +10% $-64 |
|---|---|---|---|---|---|
| Rent | -10% $-77 | -5% $-20 | +0% $38 | +5% $95 | +10% $152 |
| Rate | -1.0pp $128 | -0.5pp $83 | base $38 | +0.5pp $-9 | +1.0pp $-57 |
UW: 25.0% down · 7.5% · 30yr · 1.5% tax · 5.0% vac · 8.0% maint · 8.0% mgmt
Financing live
Cash to close
- Down payment
- $45,000
- Closing costs
- $5,400
- Reserves months
- —
- Total cash needed
- —
Loan-product check · same deal, 3 products live
Conventional
25% down · 7.5% · 30yr
- Down + closing
- —
- Monthly P&I
- —
- Monthly cashflow
- —
- DSCR
- —
- Eligible?
- —
Personal DTI + credit; lowest rate.
DSCR
20% down · 8.5% · 30yr
- Down + closing
- —
- Monthly P&I
- —
- Monthly cashflow
- —
- DSCR
- —
- Eligible?
- —
No personal income docs; deal must DSCR.
Hard money
10% down · 12.0% · 12mo
- Down + closing
- —
- Monthly P&I
- —
- Monthly cashflow
- —
- DSCR
- —
- Eligible?
- —
Short-term bridge; refi at stabilization.
Rent comps 9 comps
| Address | Beds | Baths | Sqft | Rent | $/sqft | DOM | Units | Dist |
|---|---|---|---|---|---|---|---|---|
| 375 Westside Blvd Houma, LA | 1.0–2.0 | 1.0 | 740 | $1,110 | $1.50 | 46d | 7 | 0.63mi |
| 400 Westside Blvd Houma, LA | 2.0–3.0 | 1.0–1.5 | 906 | $1,150 | $1.27 | 46d | 5 | 0.65mi |
| 1803 Martin Luther King Jr Blvd Houma, LA | 1.0–2.0 | 1.0–2.0 | 814 | $1,329 | $1.63 | 46d | 23 | 0.82mi |
| 100 Belmere Luxury Ct Houma, LA | 1.0–3.0 | 1.0–2.0 | 1076 | $1,645 | $1.53 | 46d | 27 | 0.95mi |
| 208 Monarch Dr Unit 103-A Houma, LA | 2.0 | 1.0 | 775 | $1,000 | $1.29 | 46d | 1 | 1.01mi |
| 108 Marcel Ln Unit B Houma, LA | 2.0 | 1.0 | 908 | $1,350 | $1.49 | 46d | 1 | 1.19mi |
| 110 Marcel Ln Unit A Houma, LA | 2.0 | 1.0 | 908 | $1,350 | $1.49 | 46d | 1 | 1.19mi |
| 100 Cameron Isles Ct Houma, LA | 1.0–3.0 | 1.0–2.0 | 1115 | $1,635 | $1.47 | 46d | 14 | 1.21mi |
| 214 Greenbriar Dr Houma, LA | 2.0 | 3.0 | 1300 | $1,475 | $1.13 | 46d | 1 | 1.49mi |
Listing history 9 events
-
2026-04-26status Pending 592-char remark
Show marketing remark (592 chars)
Well-maintained 3 bedroom, 2 bathroom home offering approximately 1,179 living square feet. Interior features an open living and kitchen area with updated cabinetry, granite countertops, and stainless appliances. Durable flooring runs throughout the main living spaces for easy maintenance. Exterior highlights include covered parking, a spacious fenced backyard, and a great setup for outdoor enjoyment with a patio/pergola area and plenty of room for gatherings or play. Conveniently located in Houma with easy access to local amenities. All measurements and zoning to be verified by buyer.
-
2026-04-26status Pending
Show marketing remark (592 chars)
Well-maintained 3 bedroom, 2 bathroom home offering approximately 1,179 living square feet. Interior features an open living and kitchen area with updated cabinetry, granite countertops, and stainless appliances. Durable flooring runs throughout the main living spaces for easy maintenance. Exterior highlights include covered parking, a spacious fenced backyard, and a great setup for outdoor enjoyment with a patio/pergola area and plenty of room for gatherings or play. Conveniently located in Houma with easy access to local amenities. All measurements and zoning to be verified by buyer.
-
2026-04-24$180,000 Active 592-char remark
Show marketing remark (592 chars)
Well-maintained 3 bedroom, 2 bathroom home offering approximately 1,179 living square feet. Interior features an open living and kitchen area with updated cabinetry, granite countertops, and stainless appliances. Durable flooring runs throughout the main living spaces for easy maintenance. Exterior highlights include covered parking, a spacious fenced backyard, and a great setup for outdoor enjoyment with a patio/pergola area and plenty of room for gatherings or play. Conveniently located in Houma with easy access to local amenities. All measurements and zoning to be verified by buyer.
-
2026-04-24$180,000 Active
Show marketing remark (592 chars)
Well-maintained 3 bedroom, 2 bathroom home offering approximately 1,179 living square feet. Interior features an open living and kitchen area with updated cabinetry, granite countertops, and stainless appliances. Durable flooring runs throughout the main living spaces for easy maintenance. Exterior highlights include covered parking, a spacious fenced backyard, and a great setup for outdoor enjoyment with a patio/pergola area and plenty of room for gatherings or play. Conveniently located in Houma with easy access to local amenities. All measurements and zoning to be verified by buyer.
-
2021-10-29soldstatus $161,900
-
2020-11-23soldstatus
-
2020-11-20$73,000
-
2020-11-20$73,000
-
1997-04-15soldstatus $59,000
ⓘ Source: listings_history table (triggers on properties + properties_extension) + one-shot
backfill from property_details.listing_events for pre-trigger history.
Tax reassessment forecast LA · Resets to sale price
- Current annual tax
- $1,034 · $86/mo
- Projected year-2 tax
- $1,034 · $86/mo
- Expected delta
- $0/yr ($0/mo · 0.0%)
ⓘ Screening estimate from a state-policy table — verify with the county assessor before closing.
Climate risk First Street
- Flood 6/10 Major FEMA zone X (unshaded) · 27% chance over 30 yrs
- Wildfire 1/10 Low
- Heat 9/10 Extreme 7 d/yr ≥107°F today · 22 d/yr by 30 yrs out
- Wind 9/10 Extreme 99% chance of damaging wind over 30 yrs
- Air quality 1/10 Low 0 unhealthy d/yr today · 0 by 30 yrs out
Nearby sold comps map
Loading sold comps map…
Walkable amenities ~0.75 mi
Loading nearby amenities…
Taxation est. · year 1
- Rental income
- $17,356
- − Mortgage interest
- −$10,083
- − Property taxes
- −$1,034
- − Insurance
- −$900
- − Repairs & maintenance
- −$1,388
- − Management
- −$1,388
- − Depreciation
- −$5,236
- Taxable loss
- −$2,674
- Est. tax savings @ 24.0%
- +$642
- After-tax cash flow
- $1,092/yr
For passive investors: Depreciation is non-cash, so a rental often shows a tax loss while cash-flowing — sheltering income. Rental losses are passive: they offset passive income freely, and up to $25,000/yr can offset ordinary (W-2) income if you actively participate and your MAGI is under $100k (phasing out to $0 by $150k); unused losses carry forward. On sale, claimed depreciation is recaptured at up to 25%, and gains may owe capital-gains tax (a 1031 exchange can defer both). Figures are a year-1 estimate at your 24.0% rate — not tax advice; consult a CPA.
Schools (NCES district)
- District
- Terrebonne Parish
- NCES district ID
- 2201740
- Math proficiency
- 32% ▼ -36.00%
- Reading proficiency
- 46% ▼ -30.00%
- Median HH income
- $47,612
- Composite
- 33.38/100
- National rank
- #5480
- State rank
- #23 of 98 in LA
Livability — Bayou Cane
- Score
- 65/100
- State rank
- #140
- US rank
- #12522
Category grades
Schools grade is shown separately in the Schools card above.
Census & demographics
- Census place
- Bayou Cane, LA
- County
- Terrebonne Parish · 57,290 people
- Metro
- Houma-Thibodaux, LA
- Population (ZIP)
- 28,574
- Household income
- $84,890
- Rent vs Own
- Severe rent burden
- 811.0
Population outlook (Terrebonne County) Hauer SSP2
- Today (2025)
- 118,724 people
- By 2030
- 120,321 · +1.3%
- By 2040
- 121,894 · +2.7%
- By 2050
- 121,119 · +2.0%
- By 2075
- 117,270 · -1.2%
- By 2100
- 107,544 · -9.4%
Race, ethnicity, and origin ACS 2023
- Neighborhood character
- Predominantly White (70%)
- Race & ethnicity
- White 70% Black 18% Two or more races 6% Hispanic / Latino 6% Native American 3% Asian 2%
- Hispanic origin (detail)
- Mexican 2%
- Common ancestry
- Lithuanian 24% Armenian 1%
- Foreign-born
- 3% · Canada
- Languages at home
- 93% English-only · Spanish 3% French/Haitian/Cajun 2% Other Indo-European 1%
Political lean MEDSL · Terrebonne
- 2024 margin
- Solid R (+51.8) · D 23.5% · R 75.3% · Other 1.2%
- 2008→2024 swing
- -11.0pp toward R · 2008: -40.9pp · 2024: -51.8pp
- All cycles
- 2024: R+51.8 2020: R+50.0 2016: R+48.4 2012: R+41.2 2008: R+40.9
Not yet ingested
- Civics
- —
Market trends
- HPI YoY
- ▼ -149.43%
- Current HPI
- 138.5984
- Rent YoY
- ▲ 2.82%
- Metro
- Houma-Thibodaux, LA
- State GDP YoY
- ▲ 3.29%
- F500 in state
- 10
Industry mix (Fortune 500 HQ in LA)
| Industry | F500 HQs | Revenue |
|---|---|---|
| Telecommunications | 2 | $23B |
|
||
| Utilities | 1 | $12B |
|
||
| Wholesale / Distribution | 1 | $5B |
|
||
| Advertising | 1 | $2B |
|
||
Price history
+205.1% since first listed9 events — show timeline
- 2026-04-26 Pending — AcadianaMLS
- 2026-04-26 Pending — GBRMLS
- 2026-04-24 Listed $180,000 GBRMLS
- 2026-04-24 Listed $180,000 AcadianaMLS
- 2021-10-29 Sold (Public Records) $161,900 Public Records
- 2020-11-23 Sold (MLS) — GBRMLS
- 2020-11-20 Listed $73,000 GBRMLS
- 2020-11-20 Listed $73,000 AcadianaMLS
- 1997-04-15 Sold (Public Records) $59,000 Public Records
Property tax history
+27.6%/yrLatest (2025): $1,034 · -1.7% YoY. Source: county tax records.
Cash-flow waterfall
monthlySold comps — $/sqft
last 12 mo · ≤1 miLoading sold comps…