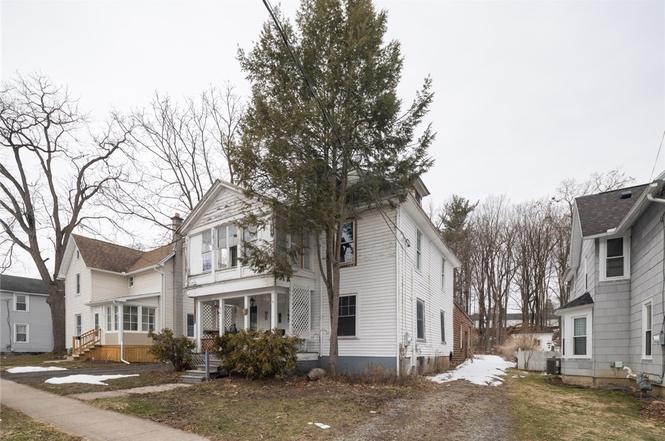
61 Water St · Perry, NY
Flood risk 1/10 · Minimal
- FEMA flood zone
- X
- Chance of flooding over 30 yrs
- 0.0%
- Est. flood insurance / yr
- $473 – $860
Fire risk 1/10 · Minimal
- Est. fire insurance / yr
- $691 – $1,283
Heat risk 2/10 · Minimal
- Hot days now (above 93°F)
- 7 days/yr
- Hot days in 30 yrs
- 16 days/yr
Wind risk 1/10 · Minimal
- Chance of severe wind over 30 yrs
- —
Air-quality risk 1/10 · Minimal
- Unhealthy air days now
- 0 days/yr
- Unhealthy air days in 30 yrs
- 0 days/yr
Risk factors via First Street. Map © Google.
Why this score? — see what drove the B grade
The composite is a weighted blend of 9 inputs, each scored 0–100. Each bar is that input's sub-score; the figure is the points it added to the 100-point composite (weight × sub-score).
- Cash flow +30.0/30.0
- 1% rule +10.0/10.0
- DSCR +10.0/10.0
- ARV discount +7.5/15.0
- Schools +4.9/10.0
- Livability +3.6/5.0
- Rent growth +2.5/5.0
- Condition / age +2.5/5.0
- Appreciation +0.0/10.0
$75,000
🖨 Deal sheet 📄 Offer letter ✓ Due diligence
Listing remarks
Attention investors, renovators, and savvy buyers seeking exceptional value in Wyoming County, New York — 61 Water Street in the Village of Perry presents a rare opportunity to transform a character-rich, circa-1890 four-bedroom, three-full-bath home into your dream property at an unbeatable price point. This fixer-upper is loaded with good bones and standout features, including original hardwood floors throughout 1st floor, custom cherry kitchen cabinets, multiple private balconies perfect for enjoying the fresh Western New York air, & a massive workshop area ideal for hobbyists, craftsmen, contractors, or anyone craving serious storage and flex space. The home sits on a 0.19-ac
Key facts
- 0.19-acre lot
- 8,400 sq ft lot
- Built 1890
Tags
Neighborhood map
What this means for you Summary
Snapshot
- This is a 4-bed/1.0-bath single-family listed at $75k.
Deal economics
- At list price, monthly cash flow is $416 ($5k/yr) — positive.
- The deal already cash-flows at list — no discount required.
- Meets the 1% rule at list price ($1k rent vs $75k).
- Recommended offer: $70k (6.0% below list) — sets the bar for market timing.
- Cap rate 13.0% vs local median 4.2% in Perry — top-decile yield for the area; either an underpriced asset or a hidden risk that comps aren't pricing in. Stress-test before assuming the spread holds.
Location & tenants
- Location reads 72/100 on livability (#348 in NY) — a middle-class / working-renter tenant base. Strengths: cost of living A+, housing A+, health & safety A; Watch: employment D+, amenities F, commute F.
- Perry Central School District (rural): math 53% / reading 63% proficiency, ranked #272 of 590 in NY (top 46%) — acceptable for families but not a draw, mixed tenant base, ~2y average lease.
- Market conditions: 23 active listings in the ZIP; 83 units permitted in Wyoming County in 2024 (0 in 5+ unit buildings).
Forward outlook
- Local home prices are declining (-3.0%/yr); year-one equity from $519 of loan paydown is wiped out by about $2k of value loss. Plan a longer hold.
- Wyoming County population projected at -16% by 2050 — secular population decline; favor cash flow + early exit over multi-decade hold.
- At projected returns (-3.0% appreciation + 3.0% rent growth), your $21k cash investment doubles in ~6 years — after that, you're playing with house money.
Negotiation context
- It's been on market 63 days — a 6% lower offer ($70k) is reasonable based on typical stale-listing flexibility.
- Current owner paid $18k; list at $75k implies a 317% gain — meaningful room to come down on a strong offer.
Risks & watch-outs
- Watch-outs: property tax is 4.3% of price; built in 1890 — expect roof / HVAC / electrical / plumbing capex.
Questions for the listing agent
- It's been on market 63 days. Have you received any prior offers? Is the seller open to a 6% concession, seller financing, or rate buy-down credit?
- Built in 1890 — when were the roof, HVAC, electrical panel, plumbing, and water heater last replaced?
- Property tax is high relative to price — has the assessment been appealed recently, and will the sale trigger a re-assessment?
- Why hasn't it sold? Are there any deal-killer items the seller is aware of (foundation, flood, title, zoning, code violations)?
- Is there a deadline driving the sale (1031 exchange, divorce, estate, relocation)? That informs how much negotiation room exists.
- What's the average days-on-market for RENTAL listings here right now (not sales)? A rising rental-DOM trend means longer vacancies and softer asking-rent achievability than the comps imply.
- What's the recent tenant-quality profile in this submarket — average credit score on applications, eviction rate, late-payment / NSF rate, and stable-employment percentage? A property-management company in the area should have these aggregated.
- How much new for-sale + rental construction is in the pipeline within 1–3 miles? Heavy new supply typically softens prices + rents 12–24 months out; constrained supply supports both.
Investment metrics
- 1% rule
- 1.87% ✓
- Cap rate
- 12.95%
- Cash-on-cash
- 23.78%
- DSCR
- 2.06
- GRM
- 4.5
CMA / ARV
- ARV (on-the-fly)
- $187,200
- Comps found
- 12
Show comp detail 12 sales within ~0.75 mi
| Address | Dist | Beds/Ba | Sqft | Sold | Price | $/sf | Match |
|---|---|---|---|---|---|---|---|
| 26 Olin Ave | 0.32mi | 4/2.0 | 1,772 (-2%) | 1mo | $205,000 | $116 | 77 |
| 30 Elm St | 0.09mi | 3/1.5 (-1) | 1,653 (-8%) | 1mo | $92,000 | $56 | 74 |
| 12 Clark St | 0.20mi | 4/2.0 | 1,718 (-5%) | 10mo | $224,930 | $131 | 71 |
| 18 Water St | 0.13mi | 4/1.5 | 1,968 (+9%) | 9mo | $144,750 | $74 | 69 |
| 22 Genesee St | 0.28mi | 3/1.0 (-1) | 1,697 (-6%) | 7mo | $45,000 | $27 | 67 |
| 8 Main Ter | 0.05mi | 3/1.0 (-1) | 1,560 (-13%) | 10mo | $75,000 | $48 | 62 |
| 21 Benedict St | 0.22mi | 3/2.0 (-1) | 1,595 (-11%) | 5mo | $195,000 | $122 | 58 |
| 34 Dolbeer St | 0.42mi | 4/1.5 | 1,582 (-12%) | 4mo | $205,000 | $130 | 55 |
| 51 Saint Helena St | 0.55mi | 4/1.5 | 1,634 (-9%) | 4mo | $169,900 | $104 | 54 |
| 17 Tuna St | 0.62mi | 3/1.5 (-1) | 1,657 (-8%) | 9mo | $30,400 | $18 | 43 |
| 80 Saint Helena St | 0.66mi | 3/2.0 (-1) | 1,947 (+8%) | 15mo | $210,000 | $108 | 34 |
| 118 South Main St | 0.63mi | 4/1.5 | 1,540 (-14%) | 14mo | $160,000 | $104 | 32 |
Match score weights: distance 35% · size 25% · config 20% · recency 20%. Top-matched comps best support the ARV.
Projected returns pro-forma
-3.0% appreciation · 3.0% rent growth · sell at horizon
- IRR
- 17.1%
- Equity multiple
- 1.69×
- Total profit
- $14,483
- Equity at exit
- $11,183
- IRR
- 25.7%
- Equity multiple
- 3.25×
- Total profit
- $47,263
- Equity at exit
- $6,485
Cash invested: $21,000 (down + closing). Projections, not guarantees.
Landlord ↔ Tenant lean methodology
- Overall (STATE)
- 15 Strongly Tenant-Friendly
- State New York
- 15 Strongly Tenant-Friendly · D+10
- County
- — inherits STATE
- City
- — inherits STATE
ZIP-level market 14530
- Home prices YoY
- -4.0%
- Active inventory
- 23
- Price-to-rent
- 4.5×
Monthly cashflow live
- Estimated rent
- $1,401 medium interval (Pro) →
- Mortgage (P&I)
- −$393
- Tax from tax record
- −$266 /mo · $3,197/yr
- Insurance
- −$31
- HOA
- −$0
- Vacancy / Maint / Mgmt
- −$294
- Net cashflow
- $416
Break-even live
UW: 25.0% down · 7.5% · 30yr · 1.5% tax · 5.0% vac · 8.0% maint · 8.0% mgmt
Financing live
Cash to close
- Down payment
- $18,750
- Closing costs
- $2,250
- Reserves months
- —
- Total cash needed
- —
Loan-product check · same deal, 3 products live
Conventional
25% down · 7.5% · 30yr
- Down + closing
- —
- Monthly P&I
- —
- Monthly cashflow
- —
- DSCR
- —
- Eligible?
- —
Personal DTI + credit; lowest rate.
DSCR
20% down · 8.5% · 30yr
- Down + closing
- —
- Monthly P&I
- —
- Monthly cashflow
- —
- DSCR
- —
- Eligible?
- —
No personal income docs; deal must DSCR.
Hard money
10% down · 12.0% · 12mo
- Down + closing
- —
- Monthly P&I
- —
- Monthly cashflow
- —
- DSCR
- —
- Eligible?
- —
Short-term bridge; refi at stabilization.
Listing history 5 events
-
2026-05-07status Pending
-
2026-04-27historical Active Under Contract
-
2026-04-21price $75,000
-
2026-03-05$85,000 Active
-
1995-02-28soldstatus $18,000
ⓘ Source: listings_history table (triggers on properties + properties_extension) + one-shot
backfill from property_details.listing_events for pre-trigger history.
Tax reassessment forecast NY · Partial reset (capped growth)
- Current annual tax
- $3,197 · $266/mo
- Projected year-2 tax
- $3,197 · $266/mo
- Expected delta
- $0/yr ($0/mo · 0.0%)
ⓘ Screening estimate from a state-policy table — verify with the county assessor before closing.
Climate risk First Street
- Flood 1/10 Low FEMA zone X · 0% chance over 30 yrs
- Wildfire 1/10 Low
- Heat 2/10 Low 7 d/yr ≥93°F today · 16 d/yr by 30 yrs out
- Wind 1/10 Low
- Air quality 1/10 Low 0 unhealthy d/yr today · 0 by 30 yrs out
Nearby sold comps map
Loading sold comps map…
Walkable amenities ~0.75 mi
Loading nearby amenities…
Taxation est. · year 1
- Rental income
- $16,818
- − Mortgage interest
- −$4,201
- − Property taxes
- −$3,197
- − Insurance
- −$375
- − Repairs & maintenance
- −$1,345
- − Management
- −$1,345
- − Depreciation
- −$2,182
- Taxable income
- $4,172
- Est. tax owed @ 24.0%
- −$1,001
- After-tax cash flow
- $3,993/yr
For passive investors: Depreciation is non-cash, so a rental often shows a tax loss while cash-flowing — sheltering income. Rental losses are passive: they offset passive income freely, and up to $25,000/yr can offset ordinary (W-2) income if you actively participate and your MAGI is under $100k (phasing out to $0 by $150k); unused losses carry forward. On sale, claimed depreciation is recaptured at up to 25%, and gains may owe capital-gains tax (a 1031 exchange can defer both). Figures are a year-1 estimate at your 24.0% rate — not tax advice; consult a CPA.
Schools (NCES district)
- District
- Perry Central School District
- NCES district ID
- 3622770
- Math proficiency
- 53% ▼ -7.00%
- Reading proficiency
- 63% ▲ 12.00%
- Median HH income
- $48,386
- Composite
- 49.23/100
- National rank
- #2036
- State rank
- #272 of 590 in NY
Livability — Perry
- Score
- 72/100
- State rank
- #348
- US rank
- #5898
Category grades
Schools grade is shown separately in the Schools card above.
Census & demographics
- Census place
- Perry, NY
- Population (ZIP)
- 6,396
Population outlook (Wyoming County) Hauer SSP2
- Today (2025)
- 38,976 people
- By 2030
- 37,826 · -3.0%
- By 2040
- 35,585 · -8.7%
- By 2050
- 32,841 · -15.7%
- By 2075
- 25,920 · -33.5%
- By 2100
- 19,082 · -51.0%
Race, ethnicity, and origin ACS 2023
- Neighborhood character
- Predominantly White (84%)
- Race & ethnicity
- White 84% Hispanic / Latino 8% Black 5% Two or more races 3%
- Hispanic origin (detail)
- Mexican 5% Puerto Rican 2%
- Common ancestry
- Romanian 3% Danish 3% Slovak 2%
- Foreign-born
- 4% · Canada
- Languages at home
- 96% English-only · Spanish 3% German/W. Germanic 1%
Political lean MEDSL · Wyoming
- 2024 margin
- Solid R (+48.2) · D 25.9% · R 74.1%
- 2008→2024 swing
- -22.1pp toward R · 2008: -26.1pp · 2024: -48.2pp
- All cycles
- 2024: R+48.2 2020: R+45.5 2016: R+51.0 2012: R+29.6 2008: R+26.1
Not yet ingested
- Civics
- —
Market trends
- HPI YoY
- ▼ -10.45%
- Current HPI
- 250.8251
- Rent YoY
- —
- Metro
- —
- State GDP YoY
- ▲ 2.60%
- F500 in state
- 92
Industry mix (Fortune 500 HQ in NY)
| Industry | F500 HQs | Revenue |
|---|---|---|
| Financial Services | 10 | $950B |
|
||
| Consumer Goods | 9 | $162B |
|
||
| Insurance | 4 | $225B |
|
||
| Telecommunications | 2 | $144B |
|
||
| Pharmaceuticals | 2 | $112B |
|
||
| Media / Entertainment | 2 | $69B |
|
||
Price history
+316.7% since first listed5 events — show timeline
- 2026-05-07 Pending — UNYREIS
- 2026-04-27 Contingent — UNYREIS
- 2026-04-21 Price Changed $75,000 UNYREIS
- 2026-03-05 Listed $85,000 UNYREIS
- 1995-02-28 Sold (Public Records) $18,000 Public Records
Property tax history
+6.8%/yrLatest (2025): $3,197 · +2.5% YoY. Source: county tax records.
Cash-flow waterfall
monthlySold comps — $/sqft
last 12 mo · ≤1 miLoading sold comps…