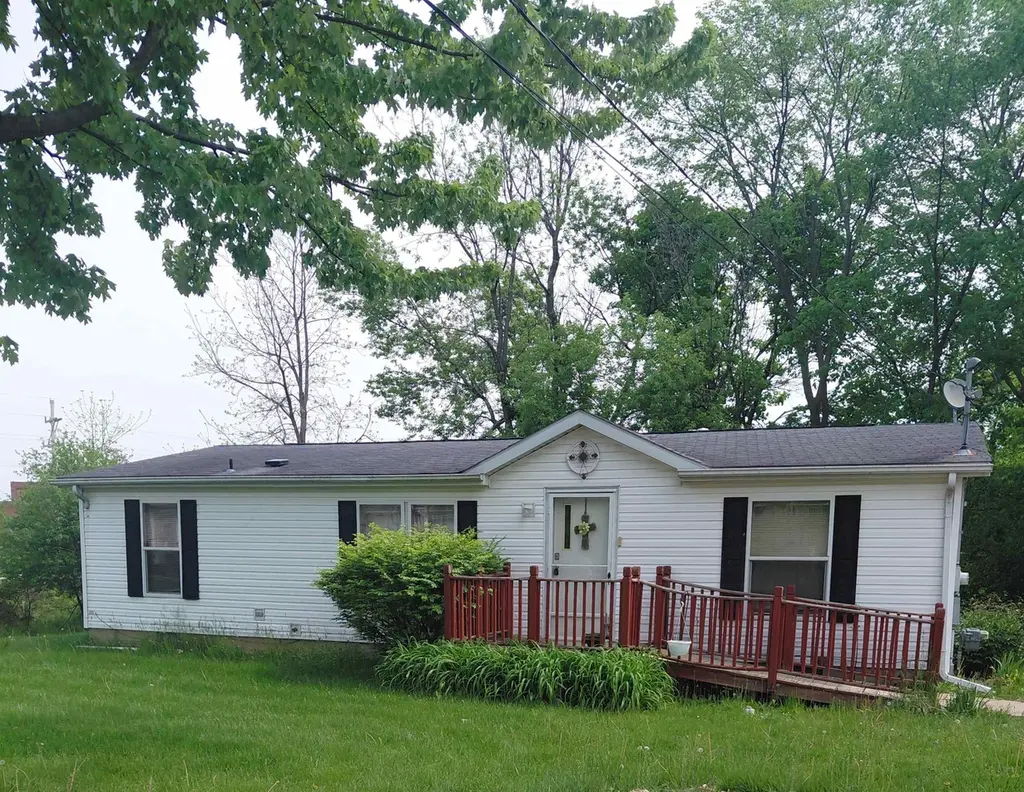
332 N Brooks St · Owosso, MI
Flood risk 1/10 · Minimal
- FEMA flood zone
- X (unshaded)
- Chance of flooding over 30 yrs
- 0.0%
- Est. flood insurance / yr
- $473 – $860
Fire risk 1/10 · Minimal
- Est. fire insurance / yr
- $784 – $1,456
Heat risk 3/10 · Minor
- Hot days now (above 97°F)
- 7 days/yr
- Hot days in 30 yrs
- 15 days/yr
Wind risk 2/10 · Minimal
- Chance of severe wind over 30 yrs
- —
Air-quality risk 2/10 · Minimal
- Unhealthy air days now
- 1 days/yr
- Unhealthy air days in 30 yrs
- 2 days/yr
Risk factors via First Street. Map © Google.
Why this score? — see what drove the C+ grade
The composite is a weighted blend of 9 inputs, each scored 0–100. Each bar is that input's sub-score; the figure is the points it added to the 100-point composite (weight × sub-score).
- Cash flow +23.6/30.0
- ARV discount +15.0/15.0
- DSCR +7.6/10.0
- 1% rule +5.5/10.0
- Livability +3.8/5.0
- Rent growth +2.5/5.0
- Condition / age +2.5/5.0
- Schools +2.3/10.0
- Appreciation +0.0/10.0
$95,000
🖨 Deal sheet 📄 Offer letter ✓ Due diligence
Listing remarks MLS
Bring your design ideas to this classic, one level ranch home nestled on a . 22 acre lot. Featuring a highly functional floor plan with three comfortable bedrooms and two full baths, this property is the perfect canvas for your personal touch. Located on dead end of a dead-end street. Brand new sewer lines, also a new water heater. All appliances stay with home, including a deep freezer for extra food storage! Move right in with zero extra expenses. Schedule your tour today! BATVI
Key facts
- New water heater
- Dead end street
- All appliances stay
Tags
Property features AI
Finance
- HOA & community: Homeowners association present
Exterior
- Parking: Detached 1-car garage
- Utilities: Public water; Public sewer
- Home design: Single-family residence; One level
- Construction: Vinyl siding
- Exterior features: Lot approximately 0.23 acres; Lot dimensions about 157 x 62
Interior
- Bathrooms: 2 full bathrooms
- Heating & cooling: Forced air heating (natural gas); No central cooling
- Interior features: Crawl space basement; Total of 3 rooms
Neighborhood map
What this means for you Summary
Snapshot
- This is a 3-bed/2.0-bath single-family listed at $95k.
Deal economics
- At list price, monthly cash flow is $178 ($2k/yr) — positive.
- The deal already cash-flows at list — no discount required.
- Meets the 1% rule at list price ($1k rent vs $95k).
- Cap rate 8.5% vs local median 4.2% in Owosso — top-decile yield for the area; either an underpriced asset or a hidden risk that comps aren't pricing in. Stress-test before assuming the spread holds.
Location & tenants
- Location reads 76/100 on livability (#147 in MI, #3,704 nationally) — a middle-class / working-renter tenant base. Strengths: cost of living A+, housing A+, health & safety A+; Watch: schools D+, crime D-, commute F.
- Owosso Public Schools (town): math 21% / reading 33% proficiency, ranked #401 of 540 in MI (top 74%) — low school quality limits family demand, transient renter base, plan for 1-2y turnover.
- Market conditions: 162 active listings in the ZIP; 1 comparable units currently listed for rent nearby; 74 units permitted in Shiawassee County in 2024 (0 in 5+ unit buildings).
Forward outlook
- Local home prices are declining (-3.0%/yr); year-one equity from $657 of loan paydown is wiped out by about $3k of value loss. Plan a longer hold.
- Shiawassee County population projected at -25% by 2050 — secular population decline; favor cash flow + early exit over multi-decade hold.
Negotiation context
- Only 7 days on market — expect competitive offers; lowballing is unlikely to land.
- 4 sale attempts since 20y ago with the ask held roughly flat each time — persistent listings suggest the price (not the market) is what's stuck; bring a comps-based counter.
Questions for the listing agent
- Is there a deadline driving the sale (1031 exchange, divorce, estate, relocation)? That informs how much negotiation room exists.
- Schools are D-rated, which usually means shorter tenancies and higher turnover. Who's the typical renter profile here, and what's been the actual vacancy rate?
- Crime grade is D in this area — have there been break-ins, vandalism, or insurance claims at this property in the last 3 years? What carrier currently insures it and at what premium?
- What's the average days-on-market for RENTAL listings here right now (not sales)? A rising rental-DOM trend means longer vacancies and softer asking-rent achievability than the comps imply.
- What's the recent tenant-quality profile in this submarket — average credit score on applications, eviction rate, late-payment / NSF rate, and stable-employment percentage? A property-management company in the area should have these aggregated.
- How much new for-sale + rental construction is in the pipeline within 1–3 miles? Heavy new supply typically softens prices + rents 12–24 months out; constrained supply supports both.
Investment metrics
- 1% rule
- 1.05% ✓
- Cap rate
- 8.54%
- Cash-on-cash
- 8.04%
- DSCR
- 1.36
- GRM
- 7.9
CMA / ARV
- ARV (on-the-fly)
- $140,184
- Comps found
- 12
Show comp detail 12 sales within ~0.75 mi
| Address | Dist | Beds/Ba | Sqft | Sold | Price | $/sf | Match |
|---|---|---|---|---|---|---|---|
| 1507 Lynn St | 0.35mi | 4/2.0 (+1) | 1,210 (+2%) | 1mo | $55,000 | $45 | 75 |
| 1432 Young St | 0.26mi | 3/1.0 | 1,129 (-5%) | 2mo | $165,000 | $146 | 74 |
| 323 S Chipman St | 0.49mi | 3/1.0 | 1,170 (-2%) | 1mo | $130,000 | $111 | 70 |
| 526 S Chipman St | 0.60mi | 3/1.0 | 1,184 (-0%) | 1mo | $200,000 | $169 | 66 |
| 302 Lafayette Blvd | 0.13mi | 3/1.0 | 1,020 (-14%) | 0mo | $119,900 | $118 | 66 |
| 1330 W King St | 0.40mi | 3/1.5 | 1,274 (+7%) | 4mo | $148,000 | $116 | 64 |
| 1339 Olmstead St | 0.46mi | 3/2.0 | 1,084 (-9%) | 2mo | $189,000 | $174 | 63 |
| 1428 Lynn St | 0.32mi | 3/1.0 | 1,060 (-11%) | 2mo | $185,000 | $175 | 62 |
| 1568 Kenneth St | 0.72mi | 3/2.0 | 1,160 (-2%) | 1mo | $170,000 | $147 | 61 |
| 1603 Lynn St | 0.35mi | 3/1.0 | 1,300 (+9%) | 5mo | $47,000 | $36 | 60 |
| 911 Beehler St | 0.47mi | 3/1.0 | 1,100 (-7%) | 6mo | $35,000 | $32 | 56 |
| 1114 Beehler St | 0.33mi | 3/1.0 | 1,018 (-14%) | 7mo | $120,000 | $118 | 51 |
Match score weights: distance 35% · size 25% · config 20% · recency 20%. Top-matched comps best support the ARV.
Projected returns pro-forma
-3.0% appreciation · 3.0% rent growth · sell at horizon
- IRR
- -4.1%
- Equity multiple
- 0.85×
- Total profit
- $-4,052
- Equity at exit
- $14,165
- IRR
- 5.6%
- Equity multiple
- 1.42×
- Total profit
- $11,042
- Equity at exit
- $8,214
Cash invested: $26,600 (down + closing). Projections, not guarantees.
Landlord ↔ Tenant lean methodology
- Overall (STATE)
- 62 Landlord-Friendly
- State Michigan
- 62 Landlord-Friendly · EVEN
- County
- — inherits STATE
- City
- — inherits STATE
ZIP-level market 48867
- Active inventory
- 162
- Price-to-rent
- 7.9×
Monthly cashflow live
- Estimated rent
- $1,000 medium interval (Pro) →
- Mortgage (P&I)
- −$498
- Tax from tax record
- −$74 /mo · $887/yr
- Insurance
- −$40
- HOA
- −$0
- Vacancy / Maint / Mgmt
- −$210
- Net cashflow
- $178
Break-even live
UW: 25.0% down · 7.5% · 30yr · 1.5% tax · 5.0% vac · 8.0% maint · 8.0% mgmt
Financing live
Cash to close
- Down payment
- $23,750
- Closing costs
- $2,850
- Reserves months
- —
- Total cash needed
- —
Loan-product check · same deal, 3 products live
Conventional
25% down · 7.5% · 30yr
- Down + closing
- —
- Monthly P&I
- —
- Monthly cashflow
- —
- DSCR
- —
- Eligible?
- —
Personal DTI + credit; lowest rate.
DSCR
20% down · 8.5% · 30yr
- Down + closing
- —
- Monthly P&I
- —
- Monthly cashflow
- —
- DSCR
- —
- Eligible?
- —
No personal income docs; deal must DSCR.
Hard money
10% down · 12.0% · 12mo
- Down + closing
- —
- Monthly P&I
- —
- Monthly cashflow
- —
- DSCR
- —
- Eligible?
- —
Short-term bridge; refi at stabilization.
Rent comps 1 comps
| Address | Beds | Baths | Sqft | Rent | $/sqft | DOM | Units | Dist |
|---|---|---|---|---|---|---|---|---|
| 1800 Candlewick Dr Owosso, MI | 3.0 | 2.0 | 1056 | $1,000 | $0.95 | 13d | 1 | 1.44mi |
Listing history 6 events
-
2026-05-19$95,000 Active 485-char remark
Show marketing remark (485 chars)
Bring your design ideas to this classic, one level ranch home nestled on a . 22 acre lot. Featuring a highly functional floor plan with three comfortable bedrooms and two full baths, this property is the perfect canvas for your personal touch. Located on dead end of a dead-end street. Brand new sewer lines, also a new water heater. All appliances stay with home, including a deep freezer for extra food storage! Move right in with zero extra expenses. Schedule your tour today! BATVI
-
2026-05-19$95,000 Active
Show marketing remark (485 chars)
Bring your design ideas to this classic, one level ranch home nestled on a . 22 acre lot. Featuring a highly functional floor plan with three comfortable bedrooms and two full baths, this property is the perfect canvas for your personal touch. Located on dead end of a dead-end street. Brand new sewer lines, also a new water heater. All appliances stay with home, including a deep freezer for extra food storage! Move right in with zero extra expenses. Schedule your tour today! BATVI
-
2007-02-13historical
-
2006-12-18$84,900
-
2006-12-15historical
-
2006-03-28$84,900
ⓘ Source: listings_history table (triggers on properties + properties_extension) + one-shot
backfill from property_details.listing_events for pre-trigger history.
Tax reassessment forecast MI · Partial reset (capped growth)
- Current annual tax
- $887 · $74/mo
- Projected year-2 tax
- $1,175 · $98/mo
- Expected delta
- +$288/yr (+$24/mo · 32.4%)
ⓘ Screening estimate from a state-policy table — verify with the county assessor before closing.
Climate risk First Street
- Flood 1/10 Low FEMA zone X (unshaded) · 0% chance over 30 yrs
- Wildfire 1/10 Low
- Heat 3/10 Moderate 7 d/yr ≥97°F today · 15 d/yr by 30 yrs out
- Wind 2/10 Low
- Air quality 2/10 Low 1 unhealthy d/yr today · 2 by 30 yrs out
Nearby sold comps map
Loading sold comps map…
Walkable amenities ~0.75 mi
Loading nearby amenities…
Taxation est. · year 1
- Rental income
- $12,000
- − Mortgage interest
- −$5,321
- − Property taxes
- −$887
- − Insurance
- −$475
- − Repairs & maintenance
- −$960
- − Management
- −$960
- − Depreciation
- −$2,764
- Taxable income
- $633
- Est. tax owed @ 24.0%
- −$152
- After-tax cash flow
- $1,988/yr
For passive investors: Depreciation is non-cash, so a rental often shows a tax loss while cash-flowing — sheltering income. Rental losses are passive: they offset passive income freely, and up to $25,000/yr can offset ordinary (W-2) income if you actively participate and your MAGI is under $100k (phasing out to $0 by $150k); unused losses carry forward. On sale, claimed depreciation is recaptured at up to 25%, and gains may owe capital-gains tax (a 1031 exchange can defer both). Figures are a year-1 estimate at your 24.0% rate — not tax advice; consult a CPA.
Schools (NCES district)
- District
- Owosso Public Schools
- NCES district ID
- 2627210
- Math proficiency
- 21% ▼ -6.00%
- Reading proficiency
- 33% ▲ 1.00%
- Median HH income
- $40,656
- Composite
- 22.78/100
- National rank
- #8025
- State rank
- #401 of 540 in MI
Livability — Owosso
- Score
- 76/100
- State rank
- #147
- US rank
- #3704
Category grades
Schools grade is shown separately in the Schools card above.
Census & demographics
- Census place
- Owosso, MI
- City population
- 27,399
- Population (ZIP)
- 27,399
Population outlook (Shiawassee County) Hauer SSP2
- Today (2025)
- 64,238 people
- By 2030
- 61,434 · -4.4%
- By 2040
- 55,054 · -14.3%
- By 2050
- 48,426 · -24.6%
- By 2075
- 35,995 · -44.0%
- By 2100
- 26,678 · -58.5%
Race, ethnicity, and origin ACS 2023
- Neighborhood character
- Predominantly White (92%)
- Race & ethnicity
- White 92% Hispanic / Latino 4% Two or more races 3%
- Common ancestry
- Romanian 6% Lithuanian 3% Iranian 3%
- Foreign-born
- 1%
- Languages at home
- 98% English-only · Spanish 1% Arabic 1%
Political lean MEDSL · Shiawassee
- 2024 margin
- Strong R (+23.1) · D 37.7% · R 60.8% · Other 1.6%
- 2008→2024 swing
- -31.7pp toward R · 2008: 8.6pp · 2024: -23.1pp
- All cycles
- 2024: R+23.1 2020: R+19.9 2016: R+19.6 2012: D+3.7 2008: D+8.6
Not yet ingested
- Civics
- —
Market trends
- HPI YoY
- ▼ -234.79%
- Current HPI
- 190.5775
- Rent YoY
- —
- Metro
- —
- State GDP YoY
- ▲ 1.37%
- F500 in state
- 28
Industry mix (Fortune 500 HQ in MI)
| Industry | F500 HQs | Revenue |
|---|---|---|
| Automotive Parts | 3 | $48B |
|
||
| Automotive | 2 | $372B |
|
||
| Chemicals | 1 | $45B |
|
||
| Automotive Retail | 1 | $29B |
|
||
| Healthcare / Medical Devices | 1 | $23B |
|
||
| Automotive Technology | 1 | $20B |
|
||
Price history
+11.9% since first listed6 events — show timeline
- 2026-05-19 Listed $95,000 REALCOMP
- 2026-05-19 Listed $95,000 MiRealSource-MiMLS
- 2007-02-13 Listing Removed — REALCOMP
- 2006-12-18 Listed $84,900 REALCOMP
- 2006-12-15 Listing Removed — REALCOMP
- 2006-03-28 Listed $84,900 REALCOMP
Property tax history
-4.8%/yrLatest (2025): $887 · -30.8% YoY. Source: county tax records.
Cash-flow waterfall
monthlySold comps — $/sqft
last 12 mo · ≤1 miLoading sold comps…