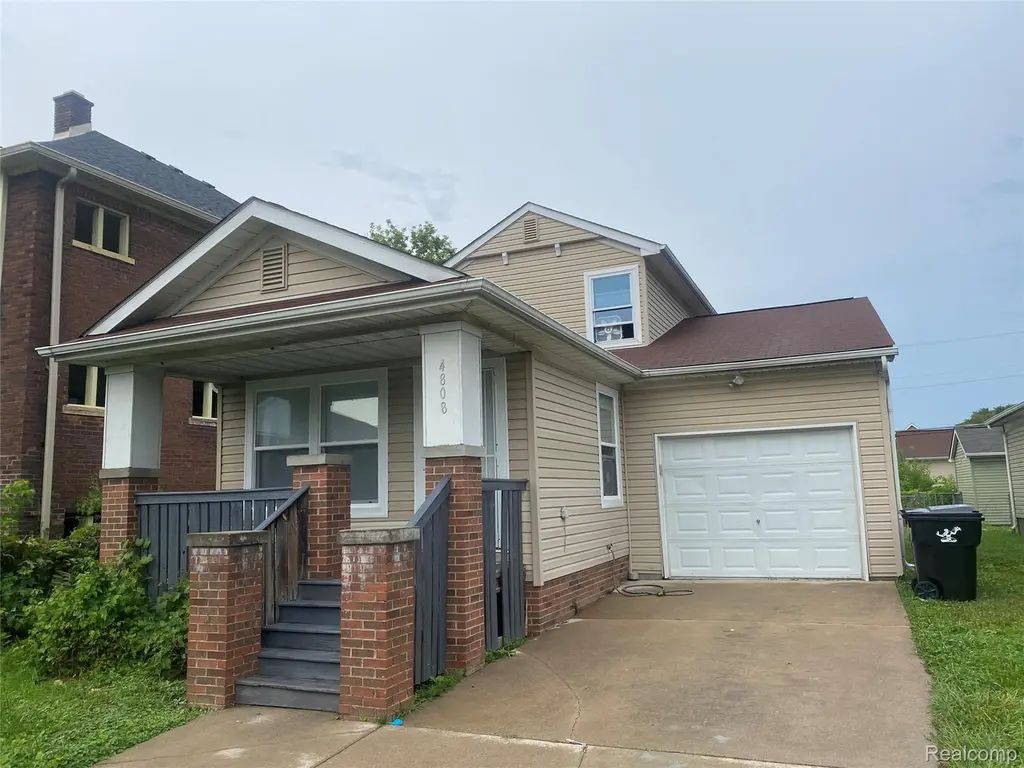
4808 Dickerson St · Detroit, MI
Flood risk 1/10 · Minimal
- FEMA flood zone
- X (unshaded)
- Chance of flooding over 30 yrs
- 0.0%
- Est. flood insurance / yr
- $473 – $860
Fire risk 1/10 · Minimal
- Est. fire insurance / yr
- $784 – $1,456
Heat risk 3/10 · Minor
- Hot days now (above 96°F)
- 7 days/yr
- Hot days in 30 yrs
- 15 days/yr
Wind risk 2/10 · Minimal
- Chance of severe wind over 30 yrs
- —
Air-quality risk 3/10 · Minor
- Unhealthy air days now
- 2 days/yr
- Unhealthy air days in 30 yrs
- 5 days/yr
Risk factors via First Street. Map © Google.
Why this score? — see what drove the C+ grade
The composite is a weighted blend of 9 inputs, each scored 0–100. Each bar is that input's sub-score; the figure is the points it added to the 100-point composite (weight × sub-score).
- Cash flow +28.1/30.0
- DSCR +10.0/10.0
- 1% rule +7.9/10.0
- ARV discount +7.5/15.0
- Livability +3.7/5.0
- Rent growth +2.5/5.0
- Condition / age +2.5/5.0
- Schools +1.3/10.0
- Appreciation +0.0/10.0
$110,000
🖨 Deal sheet 📄 Offer letter ✓ Due diligence
Listing remarks MLS
Motivated Seller. Value-add opportunity with strong rental history. This property previously generated an average of $1,600 per month in rental income for the last four year. The property will require repairs and updates following the most recent tenant's move-out, offering a great opportunity for a buyer to renovate and restore rental potential. Seller is open to a smooth and timely transaction; and happy to accept whatever the bank is willing to accept. Contact us for more details. (all pictures are from pervious years)
Key facts
- 4,792 sq ft lot
- Garage
- Built 2022
Neighborhood map
What this means for you Summary
Snapshot
- This is a 4-bed/1.0-bath single-family listed at $110k.
Deal economics
- At list price, monthly cash flow is $344 ($4k/yr) — positive.
- The deal already cash-flows at list — no discount required.
- Meets the 1% rule at list price ($1k rent vs $110k).
- Recommended offer: $97k (12.0% below list) — sets the bar for market timing.
Location & tenants
- Location reads 73/100 on livability (#218 in MI) — a middle-class / working-renter tenant base. Strengths: amenities A+, commute A+, cost of living A+; Watch: schools F, crime F, employment F.
- Detroit Public Schools Community District (urban): math 10% / reading 24% proficiency, ranked #499 of 540 in MI (top 92%) — low school quality limits family demand, transient renter base, plan for 1-2y turnover; 90% free/reduced lunch — lower-income household profile, screen leases tightly.
- Market conditions: 137 active listings in the ZIP; 19 comparable units currently listed for rent nearby; rentals at typical pace (median 24d on market — plan ~3-4 weeks tenant-placement turnaround); 2,639 units permitted in Wayne County in 2024 (1,216 in 5+ unit buildings).
Forward outlook
- Local home prices are declining (-3.0%/yr); year-one equity from $761 of loan paydown is wiped out by about $3k of value loss. Plan a longer hold.
- Wayne County population projected at -17% by 2050 — secular population decline; favor cash flow + early exit over multi-decade hold.
- At projected returns (-3.0% appreciation + 3.0% rent growth), your $31k cash investment doubles in ~9 years — after that, you're playing with house money.
Negotiation context
- It's been on market 145 days — a 12% lower offer ($97k) is reasonable based on typical stale-listing flexibility.
- 4 sale attempts since 6y ago with the ask held roughly flat each time — persistent listings suggest the price (not the market) is what's stuck; bring a comps-based counter.
- Current owner paid $5k; list at $110k implies a 2100% gain — meaningful room to come down on a strong offer.
Questions for the listing agent
- It's been on market 145 days. Have you received any prior offers? Is the seller open to a 12% concession, seller financing, or rate buy-down credit?
- Why hasn't it sold? Are there any deal-killer items the seller is aware of (foundation, flood, title, zoning, code violations)?
- Is there a deadline driving the sale (1031 exchange, divorce, estate, relocation)? That informs how much negotiation room exists.
- Schools are F-rated, which usually means shorter tenancies and higher turnover. Who's the typical renter profile here, and what's been the actual vacancy rate?
- Crime grade is F in this area — have there been break-ins, vandalism, or insurance claims at this property in the last 3 years? What carrier currently insures it and at what premium?
- What's the average days-on-market for RENTAL listings here right now (not sales)? A rising rental-DOM trend means longer vacancies and softer asking-rent achievability than the comps imply.
- What's the recent tenant-quality profile in this submarket — average credit score on applications, eviction rate, late-payment / NSF rate, and stable-employment percentage? A property-management company in the area should have these aggregated.
- How much new for-sale + rental construction is in the pipeline within 1–3 miles? Heavy new supply typically softens prices + rents 12–24 months out; constrained supply supports both.
Investment metrics
- 1% rule
- 1.29% ✓
- Cap rate
- 10.05%
- Cash-on-cash
- 13.42%
- DSCR
- 1.60
- GRM
- 6.4
CMA / ARV
- ARV (median comp)
- $62,718
- List price
- $110,000
- Delta
- 75.39%
- Verdict
- OVERPRICED
- Comps
- 20 within 1.0 mi
Show comp detail 12 sales within ~0.75 mi
| Address | Dist | Beds/Ba | Sqft | Sold | Price | $/sf | Match |
|---|---|---|---|---|---|---|---|
| 4830 Dickerson St | 0.02mi | 3/1.5 (-1) | 1,542 (0%) | 2mo | $60,099 | $39 | 91 |
| 4707 Lenox St | 0.05mi | 3/1.0 (-1) | 1,442 (-6%) | 14mo | $17,000 | $12 | 70 |
| 5550 Lenox St | 0.42mi | 4/3.0 | 1,508 (-2%) | 11mo | $179,900 | $119 | 60 |
| 5517 Drexel St | 0.39mi | 5/2.0 (+1) | 1,425 (-8%) | 3mo | $65,000 | $46 | 58 |
| 5059 Lakeview St | 0.26mi | 4/1.5 | 1,688 (+10%) | 16mo | $75,000 | $44 | 57 |
| 5794 Dickerson St | 0.59mi | 3/1.0 (-1) | 1,467 (-5%) | 4mo | $118,000 | $80 | 56 |
| 5262 Dickerson St | 0.29mi | 4/2.0 | 1,610 (+4%) | 23mo | $52,000 | $32 | 56 |
| 5581 Drexel St | 0.45mi | 3/2.0 (-1) | 1,474 (-4%) | 21mo | $118,000 | $80 | 45 |
| 5764 Lenox St | 0.56mi | 4/1.0 | 1,401 (-9%) | 18mo | $85,000 | $61 | 43 |
| 5567 Newport St | 0.53mi | 3/1.5 (-1) | 1,468 (-5%) | 21mo | $45,000 | $31 | 43 |
| 4312 Gray St | 0.28mi | 3/1.5 (-1) | 1,336 (-13%) | 24mo | $57,000 | $43 | 38 |
| 14524 Chandler Park Dr | 0.72mi | 5/2.0 (+1) | 1,634 (+6%) | 23mo | $179,900 | $110 | 28 |
Match score weights: distance 35% · size 25% · config 20% · recency 20%. Top-matched comps best support the ARV.
Projected returns pro-forma
-3.0% appreciation · 3.0% rent growth · sell at horizon
- IRR
- 3.5%
- Equity multiple
- 1.13×
- Total profit
- $4,145
- Equity at exit
- $16,401
- IRR
- 13.0%
- Equity multiple
- 2.04×
- Total profit
- $31,991
- Equity at exit
- $9,511
Cash invested: $30,800 (down + closing). Projections, not guarantees.
Landlord ↔ Tenant lean methodology
- Overall (STATE)
- 62 Landlord-Friendly
- State Michigan
- 62 Landlord-Friendly · EVEN
- County
- — inherits STATE
- City
- — inherits STATE
ZIP-level market 48215
- Home prices YoY
- -24.1%
- Active inventory
- 137
- Price-to-rent
- 6.4×
Monthly cashflow live
- Estimated rent
- $1,422 high interval (Pro) →
- Mortgage (P&I)
- −$577
- Tax from tax record
- −$157 /mo · $1,879/yr
- Insurance
- −$46
- HOA
- −$0
- Vacancy / Maint / Mgmt
- −$299
- Net cashflow
- $344
Break-even live
UW: 25.0% down · 7.5% · 30yr · 1.5% tax · 5.0% vac · 8.0% maint · 8.0% mgmt
Financing live
Cash to close
- Down payment
- $27,500
- Closing costs
- $3,300
- Reserves months
- —
- Total cash needed
- —
Loan-product check · same deal, 3 products live
Conventional
25% down · 7.5% · 30yr
- Down + closing
- —
- Monthly P&I
- —
- Monthly cashflow
- —
- DSCR
- —
- Eligible?
- —
Personal DTI + credit; lowest rate.
DSCR
20% down · 8.5% · 30yr
- Down + closing
- —
- Monthly P&I
- —
- Monthly cashflow
- —
- DSCR
- —
- Eligible?
- —
No personal income docs; deal must DSCR.
Hard money
10% down · 12.0% · 12mo
- Down + closing
- —
- Monthly P&I
- —
- Monthly cashflow
- —
- DSCR
- —
- Eligible?
- —
Short-term bridge; refi at stabilization.
Rent comps 19 comps
| Address | Beds | Baths | Sqft | Rent | $/sqft | DOM | Units | Dist |
|---|---|---|---|---|---|---|---|---|
| 5966 Eastlawn St Unit NA Detroit, MI | 3.0 | 1.5 | 1366 | $1,500 | $1.10 | 24d | 1 | 0.75mi |
| 4251 Wayburn St Detroit, MI | 3.0 | 1.5 | 1326 | $1,650 | $1.24 | 43d | 1 | 0.82mi |
| 4667 Beniteau St Detroit, MI | 5.0 | 2.0 | 1396 | $1,700 | $1.22 | 43d | 1 | 1.03mi |
| 5747 Lakepointe St Detroit, MI | 3.0 | 1.5 | 1316 | $1,473 | $1.12 | 43d | 1 | 1.04mi |
| 5751 Nottingham Rd Unit 5/21/26 Detroit, MI | 3.0 | 1.0 | 1100 | $1,250 | $1.14 | 15d | 1 | 1.16mi |
| 5045 Fairview St Detroit, MI | 3.0 | 1.0 | 1303 | $1,200 | $0.92 | 43d | 1 | 1.16mi |
| 13395 Maiden St Detroit, MI | 5.0 | 2.0 | 1750 | $1,600 | $0.91 | 24d | 1 | 1.17mi |
| 9168 Wayburn St Detroit, MI | 3.0 | 1.0 | 1274 | $1,300 | $1.02 | 20d | 1 | 1.23mi |
| 5791 Somerset Ave Detroit, MI | 3.0 | 2.0 | 1660 | $1,400 | $0.84 | 17d | 1 | 1.23mi |
| 13137 Elmdale St Detroit, MI | 3.0 | 1.0 | 1115 | $1,400 | $1.26 | 24d | 1 | 1.27mi |
| 9400 Lakepointe St Detroit, MI | 3.0 | 1.0 | 1300 | $1,150 | $0.88 | 5d | 1 | 1.30mi |
| 4487 French Rd Detroit, MI | 4.0 | 2.0 | 1280 | $1,800 | $1.41 | 43d | 1 | 1.33mi |
| 3625 Chatsworth St Detroit, MI | 3.0 | 1.5 | 1182 | $1,295 | $1.10 | 24d | 1 | 1.34mi |
| 5267 Haverhill St Detroit, MI | 3.0 | 1.5 | 1458 | $1,300 | $0.89 | 16d | 1 | 1.40mi |
| 5267 Haverhill St Detroit, MI | 3.0 | 1.5 | 1458 | $1,300 | $0.89 | 17d | 1 | 1.40mi |
| 5574 Buckingham Ave Detroit, MI | 3.0 | 1.0 | 1430 | $1,450 | $1.01 | 4d | 1 | 1.41mi |
| 9409 Balfour Rd Detroit, MI | 3.0 | 1.0 | 1195 | $1,200 | $1.00 | 43d | 1 | 1.42mi |
| 3651 Buckingham Ave Detroit, MI | 3.0 | 1.0 | 1320 | $1,300 | $0.98 | 17d | 1 | 1.43mi |
| 9755 Wayburn St Detroit, MI | 3.0 | 2.0 | 1498 | $1,400 | $0.93 | 3d | 1 | 1.44mi |
Listing history 10 events
-
2026-05-14status Pending 527-char remark
Show marketing remark (533 chars)
Motivated Seller. Value-add opportunity with strong rental history. This property previously generated an average of $1,600 per month in rental income for the last four year. The property will require repairs and updates following the most recent tenant’s move-out, offering a great opportunity for a buyer to renovate and restore rental potential. Seller is open to a smooth and timely transaction; and happy to accept whatever the bank is willing to accept. Contact us for more details. (all pictures are from pervious years)
-
2026-05-14status Pending 533-char remark
Show marketing remark (533 chars)
Motivated Seller. Value-add opportunity with strong rental history. This property previously generated an average of $1,600 per month in rental income for the last four year. The property will require repairs and updates following the most recent tenant’s move-out, offering a great opportunity for a buyer to renovate and restore rental potential. Seller is open to a smooth and timely transaction; and happy to accept whatever the bank is willing to accept. Contact us for more details. (all pictures are from pervious years)
-
2025-12-19$110,000 Active 527-char remark
Show marketing remark (533 chars)
Motivated Seller. Value-add opportunity with strong rental history. This property previously generated an average of $1,600 per month in rental income for the last four year. The property will require repairs and updates following the most recent tenant’s move-out, offering a great opportunity for a buyer to renovate and restore rental potential. Seller is open to a smooth and timely transaction; and happy to accept whatever the bank is willing to accept. Contact us for more details. (all pictures are from pervious years)
-
2025-12-19$110,000 Active 533-char remark
Show marketing remark (533 chars)
Motivated Seller. Value-add opportunity with strong rental history. This property previously generated an average of $1,600 per month in rental income for the last four year. The property will require repairs and updates following the most recent tenant’s move-out, offering a great opportunity for a buyer to renovate and restore rental potential. Seller is open to a smooth and timely transaction; and happy to accept whatever the bank is willing to accept. Contact us for more details. (all pictures are from pervious years)
-
2020-11-20soldstatus $5,001 Sold
-
2020-11-20soldstatus $5,001 Closed
-
2020-06-10status Pending
-
2020-06-10status Pending
-
2020-03-05$4,500 Active
-
2020-03-05$4,500 Active
ⓘ Source: listings_history table (triggers on properties + properties_extension) + one-shot
backfill from property_details.listing_events for pre-trigger history.
Tax reassessment forecast MI · Partial reset (capped growth)
- Current annual tax
- $1,879 · $157/mo
- Projected year-2 tax
- $1,879 · $157/mo
- Expected delta
- $0/yr ($0/mo · 0.0%)
ⓘ Screening estimate from a state-policy table — verify with the county assessor before closing.
Climate risk First Street
- Flood 1/10 Low FEMA zone X (unshaded) · 0% chance over 30 yrs
- Wildfire 1/10 Low
- Heat 3/10 Moderate 7 d/yr ≥96°F today · 15 d/yr by 30 yrs out
- Wind 2/10 Low
- Air quality 3/10 Moderate 2 unhealthy d/yr today · 5 by 30 yrs out
Nearby sold comps map
Loading sold comps map…
Walkable amenities ~0.75 mi
Loading nearby amenities…
Taxation est. · year 1
- Rental income
- $17,069
- − Mortgage interest
- −$6,162
- − Property taxes
- −$1,879
- − Insurance
- −$550
- − Repairs & maintenance
- −$1,365
- − Management
- −$1,365
- − Depreciation
- −$3,200
- Taxable income
- $2,547
- Est. tax owed @ 24.0%
- −$611
- After-tax cash flow
- $3,522/yr
For passive investors: Depreciation is non-cash, so a rental often shows a tax loss while cash-flowing — sheltering income. Rental losses are passive: they offset passive income freely, and up to $25,000/yr can offset ordinary (W-2) income if you actively participate and your MAGI is under $100k (phasing out to $0 by $150k); unused losses carry forward. On sale, claimed depreciation is recaptured at up to 25%, and gains may owe capital-gains tax (a 1031 exchange can defer both). Figures are a year-1 estimate at your 24.0% rate — not tax advice; consult a CPA.
Schools (NCES district)
- District
- Detroit Public Schools Community District
- NCES district ID
- 2601103
- Math proficiency
- 10% ▼ -2.00%
- Reading proficiency
- 24% ▲ 6.00%
- Median HH income
- $25,815
- Composite
- 13.06/100
- National rank
- #9564
- State rank
- #499 of 540 in MI
Livability — Detroit
- Score
- 73/100
- State rank
- #218
- US rank
- #5427
Category grades
Schools grade is shown separately in the Schools card above.
Census & demographics
- Census place
- Detroit, MI
- City population
- 572,865
- Population (ZIP)
- 10,238
Population outlook (Wayne County) Hauer SSP2
- Today (2025)
- 1,675,273 people
- By 2030
- 1,620,300 · -3.3%
- By 2040
- 1,502,341 · -10.3%
- By 2050
- 1,384,039 · -17.4%
- By 2075
- 1,124,592 · -32.9%
- By 2100
- 881,193 · -47.4%
Race, ethnicity, and origin ACS 2023
- Neighborhood character
- Predominantly Black (87%)
- Race & ethnicity
- Black 87% White 9% Two or more races 2% Hispanic / Latino 2%
- Common ancestry
- Romanian 1% Slovak 1% Lithuanian 1%
- Foreign-born
- 1% · Canada
- Languages at home
- 99% English-only · Spanish 1%
Political lean MEDSL · Wayne
- 2024 margin
- Strong D (+29.0) · D 62.7% · R 33.7% · Other 3.6%
- 2008→2024 swing
- -20.5pp toward R · 2008: 49.5pp · 2024: 29.0pp
- All cycles
- 2024: D+29.0 2020: D+38.1 2016: D+37.3 2012: D+46.9 2008: D+49.5
Not yet ingested
- Civics
- —
Market trends
- HPI YoY
- ▼ -60.84%
- Current HPI
- 191.0405
- Rent YoY
- —
- Metro
- —
- State GDP YoY
- ▲ 1.37%
- F500 in state
- 28
Industry mix (Fortune 500 HQ in MI)
| Industry | F500 HQs | Revenue |
|---|---|---|
| Automotive Parts | 3 | $48B |
|
||
| Automotive | 2 | $372B |
|
||
| Chemicals | 1 | $45B |
|
||
| Automotive Retail | 1 | $29B |
|
||
| Healthcare / Medical Devices | 1 | $23B |
|
||
| Automotive Technology | 1 | $20B |
|
||
Price history
+2344.4% since first listed10 events — show timeline
- 2026-05-14 Pending — MiRealSource-MiMLS
- 2026-05-14 Pending — REALCOMP
- 2025-12-19 Listed $110,000 REALCOMP
- 2025-12-19 Listed $110,000 MiRealSource-MiMLS
- 2020-11-20 Sold (MLS) $5,001 MiRealSource-MiMLS
- 2020-11-20 Sold (MLS) $5,001 REALCOMP
- 2020-06-10 Pending — MiRealSource-MiMLS
- 2020-06-10 Pending — REALCOMP
- 2020-03-05 Listed $4,500 MiRealSource-MiMLS
- 2020-03-05 Listed $4,500 REALCOMP
Property tax history
+40.9%/yrLatest (2025): $1,879 · -37.6% YoY. Source: county tax records.
Cash-flow waterfall
monthlySold comps — $/sqft
last 12 mo · ≤1 miLoading sold comps…