203106 E Bowles Rd · Finley, WA
Flood risk 6/10 · Moderate
- FEMA flood zone
- X
- Chance of flooding over 30 yrs
- 0.27%
- Est. flood insurance / yr
- $507 – $1,088
Fire risk 5/10 · Moderate
- Est. fire insurance / yr
- $604 – $1,122
Heat risk 5/10 · Moderate
- Hot days now (above 99°F)
- 7 days/yr
- Hot days in 30 yrs
- 15 days/yr
Wind risk 1/10 · Minimal
- Chance of severe wind over 30 yrs
- —
Air-quality risk 8/10 · Major
- Unhealthy air days now
- 15 days/yr
- Unhealthy air days in 30 yrs
- 16 days/yr
Risk factors via First Street. Map © Google.
Why this score? — see what drove the B grade
The composite is a weighted blend of 9 inputs, each scored 0–100. Each bar is that input's sub-score; the figure is the points it added to the 100-point composite (weight × sub-score).
- Cash flow +30.0/30.0
- ARV discount +13.5/15.0
- 1% rule +10.0/10.0
- DSCR +10.0/10.0
- Schools +2.9/10.0
- Livability +2.9/5.0
- Rent growth +2.5/5.0
- Condition / age +1.0/5.0
- Appreciation +0.0/10.0
$80,000
🖨 Deal sheet 📄 Offer letter ✓ Due diligence
Listing remarks MLS
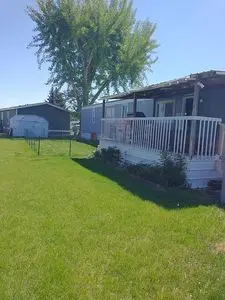
MLS# 270731 Located at Homestead Mobile Home Park in Kennewick! This home features 3 Bed, 2 Baths, open living space with laminate floor throughout. The kitchen has granite counter tops, stainless steel appliances and all bedrooms have spacious closets. Contact your favorite Realtor today to schedule an appointment.
Key facts
- Spacious yard
- Boiler replaced
- New appliances
Tags
Neighborhood map
What this means for you Summary
Snapshot
- This is a 3-bed/1.0-bath manufactured listed at $80k. Condition is rated poor.
Deal economics
- At list price, monthly cash flow is $975 ($12k/yr) — positive.
- The deal already cash-flows at list — no discount required.
- Meets the 1% rule at list price ($2k rent vs $80k).
- Recommended offer: $78k (3.0% below list) — sets the bar for market timing.
- Cap rate 20.9% vs local median 2.8% in Finley — top-decile yield for the area; either an underpriced asset or a hidden risk that comps aren't pricing in. Stress-test before assuming the spread holds.
Location & tenants
- Location reads 58/100 on livability (#502 in WA) — a working-class tenant base; expect higher turnover. Strengths: housing A+, employment B, cost of living B; Watch: crime D+, schools F, amenities F.
- Finley School District (suburban): math 19% / reading 39% proficiency, ranked #265 of 291 in WA (top 91%) — low school quality limits family demand, transient renter base, plan for 1-2y turnover.
- Market conditions: 246 active listings in the ZIP; solid renter incomes; 1,532 units permitted in Benton County in 2024 (389 in 5+ unit buildings).
Forward outlook
- Local home prices are declining (-3.0%/yr); year-one equity from $553 of loan paydown is wiped out by about $2k of value loss. Plan a longer hold.
- Benton County population projected at +32% by 2050 — long-run rental-demand tailwind backs the buy-and-hold thesis.
- At projected returns (-3.0% appreciation + 3.0% rent growth), your $22k cash investment doubles in ~3 years — after that, you're playing with house money.
Negotiation context
- It's been on market 37 days — a 3% lower offer ($78k) is reasonable based on typical stale-listing flexibility.
- 4 sale attempts since 23y ago; this cycle's ask has dropped $6k (7%) from the opening price — seller is motivated, your offer sets the floor, not the list.
Risks & watch-outs
- Climate carrying-cost: major flood risk; moderate wildfire risk; extreme-heat days projected 7→15/yr by 2055 (HVAC capex compounding) — expect insurance premiums to compound above CPI over the hold.
Questions for the listing agent
- It's been on market 37 days. Have you received any prior offers? Is the seller open to a 3% concession, seller financing, or rate buy-down credit?
- Have any recent inspections been done? Can we get a copy of the seller's disclosures and any deferred-maintenance estimates?
- Is there a deadline driving the sale (1031 exchange, divorce, estate, relocation)? That informs how much negotiation room exists.
- Schools are F-rated, which usually means shorter tenancies and higher turnover. Who's the typical renter profile here, and what's been the actual vacancy rate?
- Crime grade is D in this area — have there been break-ins, vandalism, or insurance claims at this property in the last 3 years? What carrier currently insures it and at what premium?
- What's the average days-on-market for RENTAL listings here right now (not sales)? A rising rental-DOM trend means longer vacancies and softer asking-rent achievability than the comps imply.
- What's the recent tenant-quality profile in this submarket — average credit score on applications, eviction rate, late-payment / NSF rate, and stable-employment percentage? A property-management company in the area should have these aggregated.
- How much new for-sale + rental construction is in the pipeline within 1–3 miles? Heavy new supply typically softens prices + rents 12–24 months out; constrained supply supports both.
Investment metrics
- 1% rule
- 2.42% ✓
- Cap rate
- 20.91%
- Cash-on-cash
- 52.21%
- DSCR
- 3.32
- GRM
- 3.4
CMA / ARV
- ARV (on-the-fly)
- $92,400
- Comps found
- 3
Show comp detail 3 sales within ~0.75 mi
| Address | Dist | Beds/Ba | Sqft | Sold | Price | $/sf | Match |
|---|---|---|---|---|---|---|---|
| 203106 E Bowles Rd #86 | 0.10mi | 3/2.0 | 924 (0%) | 1mo | $92,000 | $100 | 91 |
| 202105 E Bowles Rd | 0.13mi | 3/2.0 | 911 (-1%) | 9mo | $205,000 | $225 | 80 |
| 203106 E Bowles Rd #83 | 0.08mi | 3/2.0 | 990 (+7%) | 4mo | $77,000 | $78 | 77 |
Match score weights: distance 35% · size 25% · config 20% · recency 20%. Top-matched comps best support the ARV.
Projected returns pro-forma
-3.0% appreciation · 3.0% rent growth · sell at horizon
- IRR
- 50.2%
- Equity multiple
- 3.19×
- Total profit
- $49,138
- Equity at exit
- $11,928
- IRR
- 55.6%
- Equity multiple
- 6.48×
- Total profit
- $122,835
- Equity at exit
- $6,917
Cash invested: $22,400 (down + closing). Projections, not guarantees.
Landlord ↔ Tenant lean methodology
- Overall (STATE)
- 28 Tenant-Leaning
- State Washington
- 28 Tenant-Leaning · D+8
- County
- — inherits STATE
- City
- — inherits STATE
ZIP-level market 99337
- Active inventory
- 246
- Price-to-rent
- 3.4×
Monthly cashflow live
- Estimated rent
- $1,933 medium interval (Pro) →
- Mortgage (P&I)
- −$420
- Tax est. 1.5%
- −$100 /mo · $1,200/yr
- Insurance
- −$33
- HOA
- −$0
- Vacancy / Maint / Mgmt
- −$406
- Net cashflow
- $975
Break-even live
UW: 25.0% down · 7.5% · 30yr · 1.5% tax · 5.0% vac · 8.0% maint · 8.0% mgmt
Financing live
Cash to close
- Down payment
- $20,000
- Closing costs
- $2,400
- Reserves months
- —
- Total cash needed
- —
Loan-product check · same deal, 3 products live
Conventional
25% down · 7.5% · 30yr
- Down + closing
- —
- Monthly P&I
- —
- Monthly cashflow
- —
- DSCR
- —
- Eligible?
- —
Personal DTI + credit; lowest rate.
DSCR
20% down · 8.5% · 30yr
- Down + closing
- —
- Monthly P&I
- —
- Monthly cashflow
- —
- DSCR
- —
- Eligible?
- —
No personal income docs; deal must DSCR.
Hard money
10% down · 12.0% · 12mo
- Down + closing
- —
- Monthly P&I
- —
- Monthly cashflow
- —
- DSCR
- —
- Eligible?
- —
Short-term bridge; refi at stabilization.
Listing history 22 events
-
2026-06-18days on market $80,000 Active 37 DOM
-
2026-06-17days on market $80,000 Active 36 DOM
-
2026-06-16pricedays on market $80,000 Active 35 DOM
-
2026-06-15days on market $86,000 Active 34 DOM
-
2026-06-14days on market $86,000 Active 32 DOM
-
2026-06-13days on market $86,000 Active 31 DOM
-
2026-06-10days on market $86,000 Active 29 DOM
-
2026-06-09days on market $86,000 Active 28 DOM
-
2026-06-08days on market $86,000 Active 27 DOM
-
2026-06-07days on market $86,000 Active 26 DOM
-
2026-06-02days on market $86,000 Active 21 DOM
-
2026-06-01days on market $86,000 Active 20 DOM
-
2026-05-31days on market $86,000 Active 19 DOM
-
2026-05-30days on market $86,000 Active 18 DOM
-
2026-05-12$86,000 Active 1180-char remark
-
2023-10-05soldstatus $120,000 Closed 317-char remark
Show marketing remark (317 chars)
MLS# 270731 Located at Homestead Mobile Home Park in Kennewick! This home features 3 Bed, 2 Baths, open living space with laminate floor throughout. The kitchen has granite counter tops, stainless steel appliances and all bedrooms have spacious closets. Contact your favorite Realtor today to schedule an appointment.
-
2023-09-06historical Active Under Contract 317-char remark
Show marketing remark (317 chars)
MLS# 270731 Located at Homestead Mobile Home Park in Kennewick! This home features 3 Bed, 2 Baths, open living space with laminate floor throughout. The kitchen has granite counter tops, stainless steel appliances and all bedrooms have spacious closets. Contact your favorite Realtor today to schedule an appointment.
-
2023-08-22$130,000 Active 317-char remark
Show marketing remark (317 chars)
MLS# 270731 Located at Homestead Mobile Home Park in Kennewick! This home features 3 Bed, 2 Baths, open living space with laminate floor throughout. The kitchen has granite counter tops, stainless steel appliances and all bedrooms have spacious closets. Contact your favorite Realtor today to schedule an appointment.
-
2010-02-26soldstatus $19,000
Show marketing remark (144 chars)
Best buy on the market for age & size. Refer is negotiable depending on price. Auxillary stove-oil heater was a gift and goes with Seller.
-
2010-01-04$19,950
Show marketing remark (144 chars)
Best buy on the market for age & size. Refer is negotiable depending on price. Auxillary stove-oil heater was a gift and goes with Seller.
-
2003-06-10soldstatus $9,600
-
2003-02-18$9,299
ⓘ Source: listings_history table (triggers on properties + properties_extension) + one-shot
backfill from property_details.listing_events for pre-trigger history.
Climate risk First Street
- Flood 6/10 Major FEMA zone X · 27% chance over 30 yrs
- Wildfire 5/10 Major
- Heat 5/10 Major 7 d/yr ≥99°F today · 15 d/yr by 30 yrs out
- Wind 1/10 Low
- Air quality 8/10 Severe 15 unhealthy d/yr today · 16 by 30 yrs out
Nearby sold comps map
Loading sold comps map…
Walkable amenities ~0.75 mi
Loading nearby amenities…
Taxation est. · year 1
- Rental income
- $23,202
- − Mortgage interest
- −$4,481
- − Property taxes
- −$1,200
- − Insurance
- −$400
- − Repairs & maintenance
- −$1,856
- − Management
- −$1,856
- − Depreciation
- −$2,327
- Taxable income
- $11,081
- Est. tax owed @ 24.0%
- −$2,659
- After-tax cash flow
- $9,036/yr
For passive investors: Depreciation is non-cash, so a rental often shows a tax loss while cash-flowing — sheltering income. Rental losses are passive: they offset passive income freely, and up to $25,000/yr can offset ordinary (W-2) income if you actively participate and your MAGI is under $100k (phasing out to $0 by $150k); unused losses carry forward. On sale, claimed depreciation is recaptured at up to 25%, and gains may owe capital-gains tax (a 1031 exchange can defer both). Figures are a year-1 estimate at your 24.0% rate — not tax advice; consult a CPA.
Condition & rehab AI · 1 photo
This mobile home requires extensive repairs and updates across all systems and areas, significantly impacting its current condition and value. Significant investment is needed to bring it up to a livable standard.
Repairs flagged
- Major kitchen appliances — No photos of kitchen
- Major bathroom fixtures — No photos of bathroom
- Major roof — No photos of roof
- Major exterior siding — No photos of exterior
- Major flooring — No photos of flooring
- Major interior walls/paint — No photos of interior walls/paint
- Major windows — No photos of windows
- Major HVAC/mechanicals — No photos of HVAC/mechanicals
- Major landscaping — No photos of landscaping/curb appeal
Value-add opportunities
- Resale New kitchen appliances — Modern appliances can significantly enhance the home's appeal to potential buyers.
- Resale New bathroom fixtures — Upgraded bathrooms are a major selling point for potential buyers.
- Resale New roof — A new roof can add significant value and reduce future maintenance costs.
- Resale New exterior siding — Fresh siding can improve the home's curb appeal and increase its resale value.
- Resale New flooring — Modern flooring can make the home more attractive to potential buyers.
- Resale New interior walls/paint — Fresh paint and updated interior can make the home more appealing and increase its resale value.
- Resale New windows — New windows can improve energy efficiency and increase the home's curb appeal.
- Resale New HVAC system — A new HVAC system can improve comfort and energy efficiency, enhancing the home's appeal.
- Resale Landscaping and curb appeal — A well-maintained yard and curb appeal can significantly increase the home's resale value.
- Rental Landscaping and curb appeal — A well-maintained yard and curb appeal can attract tenants and increase rental income.
- Both Landscaping and curb appeal — A well-maintained yard and curb appeal can attract both buyers and tenants, increasing the home's value for both purposes.
Renovation cost estimate screening
| Repair item | Severity | Est. cost |
|---|---|---|
| kitchen appliances · No photos of kitchen | Major | $15,000–50,000 |
| bathroom fixtures · No photos of bathroom | Major | $15,000–50,000 |
| roof · No photos of roof | Major | $15,000–50,000 |
| exterior siding · No photos of exterior | Major | $15,000–50,000 |
| flooring · No photos of flooring | Major | $15,000–50,000 |
| interior walls/paint · No photos of interior walls/paint | Major | $15,000–50,000 |
| windows · No photos of windows | Major | $15,000–50,000 |
| HVAC/mechanicals · No photos of HVAC/mechanicals | Major | $15,000–50,000 |
| landscaping · No photos of landscaping/curb appeal | Major | $15,000–50,000 |
| Total estimated repair cost · 9 items | $135,000–450,000 |
Value-add ROI direction
- Resale New kitchen appliances — Modern appliances can significantly enhance the home's appeal to potential buyers. ↑
- Resale New bathroom fixtures — Upgraded bathrooms are a major selling point for potential buyers. ↑
- Resale New roof — A new roof can add significant value and reduce future maintenance costs. ↑
- Resale New exterior siding — Fresh siding can improve the home's curb appeal and increase its resale value. ↑
- Resale New flooring — Modern flooring can make the home more attractive to potential buyers. ↑
- Resale New interior walls/paint — Fresh paint and updated interior can make the home more appealing and increase its resale value. ↑
- Resale New windows — New windows can improve energy efficiency and increase the home's curb appeal. ↑
- Resale New HVAC system — A new HVAC system can improve comfort and energy efficiency, enhancing the home's appeal. ↑
- Resale Landscaping and curb appeal — A well-maintained yard and curb appeal can significantly increase the home's resale value. ↑
- Rental Landscaping and curb appeal — A well-maintained yard and curb appeal can attract tenants and increase rental income. ↑
- Both Landscaping and curb appeal — A well-maintained yard and curb appeal can attract both buyers and tenants, increasing the home's value for both purposes. ↑
ⓘ Cost ranges are severity-bucket heuristics (US national rule-of-thumb). Get contractor quotes + a written scope before underwriting a rehab budget.
Schools (NCES district)
- District
- Finley School District
- NCES district ID
- 5302910
- Math proficiency
- 19% ▲ 1.00%
- Reading proficiency
- 39% ▲ 4.00%
- Median HH income
- $61,141
- Composite
- 29.28/100
- National rank
- #11846
- State rank
- #265 of 291 in WA
Livability — Finley
- Score
- 58/100
- State rank
- #502
- US rank
- #20775
Category grades
Schools grade is shown separately in the Schools card above.
Census & demographics
- Census place
- Finley, WA
- County
- Benton County · 186,895 people
- Metro
- Kennewick-Richland, WA
- Population (ZIP)
- 33,287
- Household income
- $98,848
- Rent vs Own
- Severe rent burden
- 430.0
Population outlook (Benton County) Hauer SSP2
- Today (2025)
- 219,421 people
- By 2030
- 233,813 · +6.6%
- By 2040
- 262,134 · +19.5%
- By 2050
- 290,100 · +32.2%
- By 2075
- 363,525 · +65.7%
- By 2100
- 418,667 · +90.8%
Race, ethnicity, and origin ACS 2023
- Neighborhood character
- Predominantly White (67%)
- Race & ethnicity
- White 67% Hispanic / Latino 26% Two or more races 13% Asian 1% Black 1%
- Hispanic origin (detail)
- Mexican 24%
- Common ancestry
- Lithuanian 4% Portuguese 3% Iranian 2%
- Foreign-born
- 12% · Canada, Vietnam
- Languages at home
- 76% English-only · Spanish 20% Russian/Polish/Slavic 2%
Political lean MEDSL · Benton
- 2024 margin
- Strong R (+21.9) · D 37.7% · R 59.6% · Other 2.7%
- 2008→2024 swing
- +4.2pp toward D · 2008: -26.1pp · 2024: -21.9pp
- All cycles
- 2024: R+21.9 2020: R+21.0 2016: R+26.6 2012: R+27.0 2008: R+26.1
Not yet ingested
- Civics
- —
Market trends
- HPI YoY
- ▼ -260.38%
- Current HPI
- 245.5375
- Rent YoY
- —
- Metro
- Kennewick-Richland, WA
- State GDP YoY
- ▲ 4.65%
- F500 in state
- 22
Industry mix (Fortune 500 HQ in WA)
| Industry | F500 HQs | Revenue |
|---|---|---|
| Retail | 2 | $269B |
|
||
| Technology / Retail | 1 | $638B |
|
||
| Technology | 1 | $245B |
|
||
| Telecommunications | 1 | $38B |
|
||
| Food / Beverage | 1 | $36B |
|
||
| Automotive / Trucks | 1 | $34B |
|
||
Price history
+760.3% since first listed9 events — show timeline
- 2026-06-16 Price Changed $80,000 FSBO.com
- 2026-05-12 Listed $86,000 FSBO.com
- 2023-10-05 Sold (MLS) $120,000 PACMLS
- 2023-09-06 Contingent — PACMLS
- 2023-08-22 Listed $130,000 PACMLS
- 2010-02-26 Sold (MLS) $19,000 PACMLS
- 2010-01-04 Listed $19,950 PACMLS
- 2003-06-10 Sold (MLS) $9,600 PACMLS
- 2003-02-18 Listed $9,299 PACMLS
Cash-flow waterfall
monthlySold comps — $/sqft
last 12 mo · ≤1 miLoading sold comps…