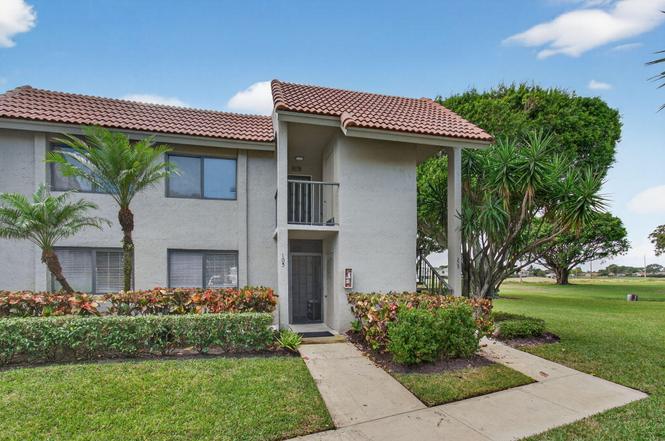
5771 Fairway Park Ct #205 · Golf, FL
Flood risk 1/10 · Minimal
- FEMA flood zone
- X (unshaded)
- Chance of flooding over 30 yrs
- 0.0%
- Est. flood insurance / yr
- $507 – $1,088
Fire risk 1/10 · Minimal
- Est. fire insurance / yr
- $947 – $1,759
Heat risk 9/10 · Severe
- Hot days now (above 106°F)
- 7 days/yr
- Hot days in 30 yrs
- 26 days/yr
Wind risk 10/10 · Severe
- Chance of severe wind over 30 yrs
- 99.0%
Air-quality risk 2/10 · Minimal
- Unhealthy air days now
- 1 days/yr
- Unhealthy air days in 30 yrs
- 2 days/yr
Risk factors via First Street. Map © Google.
Why this score? — see what drove the B grade
The composite is a weighted blend of 9 inputs, each scored 0–100. Each bar is that input's sub-score; the figure is the points it added to the 100-point composite (weight × sub-score).
- Cash flow +26.3/30.0
- 1% rule +10.0/10.0
- DSCR +8.9/10.0
- ARV discount +7.5/15.0
- Appreciation +4.9/10.0
- Schools +4.3/10.0
- Livability +3.2/5.0
- Rent growth +2.8/5.0
- Condition / age +2.5/5.0
$179,000
🖨 Deal sheet 📄 Offer letter ✓ Due diligence
Listing remarks
This is truly a fantastic opportunity for you to reimagine this three bedroom condo with an amazing golf course and water view. .. You watch hours of HGTV and said you could do it better yourself. .. Here is your chance. This is a spacious second floor corner condo. Light and bright with panoramic water views. Walk to the community pool. Indian Spring is a 55 plus adult community with 24/7 guard gated security. Lush tropical landscaping. Cable, building insurance, pool, lawn care, security are all included in the condo fee.
Key facts
- Guard gated security
- Golf course view
- Community pool
Tags
Property features AI
Finance
- Other: Senior community; Pets not allowed
- Financial info: Monthly HOA fee: $754
- HOA & community: Community pool; HOA with monthly fee
Exterior
- Utilities: Three-phase electric service; Public sewer; Cable available; Water available
- Home design: Condominium; 2-story building; Faces north
- Construction: Concrete/CBS construction
- Exterior features: Waterfront property
Interior
- Bedrooms: 3 bedrooms on the main level
- Flooring: Ceramic tile
- Bathrooms: 2 full bathrooms
- Heating & cooling: Central electric heating; Central electric cooling (air conditioning)
- Interior features: Entrance foyer; Walk-in closets; Split bedroom layout; Upstairs living area; Unfurnished
- Laundry & utility: Laundry closet inside the unit
Neighborhood map
What this means for you Summary
Snapshot
- This is a 3-bed/2.0-bath condo listed at $179k.
Deal economics
- At list price, monthly cash flow is $462 ($6k/yr) — positive.
- The deal already cash-flows at list — no discount required.
- Meets the 1% rule at list price ($3k rent vs $179k).
- Recommended offer: $158k (12.0% below list) — sets the bar for market timing.
Location & tenants
- Location reads 63/100 on livability (#703 in FL) — a middle-class / working-renter tenant base. Strengths: crime A+, employment A+, housing A+; Watch: amenities F, commute F, cost of living F.
- Palm Beach (suburban): math 46% / reading 53% proficiency, ranked #34 of 73 in FL (top 47%) — families likely to look elsewhere, expect single-tenant / working-renter base with shorter leases.
- Market conditions: Rents rising (+1.3%/yr); 479 active listings in the ZIP; 40 comparable units currently listed for rent nearby; rentals at typical pace (median 24d on market — plan ~3-4 weeks tenant-placement turnaround); solid renter incomes; 3,974 units permitted in Palm Beach County in 2024 (1,012 in 5+ unit buildings).
- This rent runs 44% of the median local income ($81k/yr) — at the standard rent-burdened threshold; future hikes will face affordability resistance.
Forward outlook
- In year one you build about $805 of equity ($1k loan paydown + $-433 appreciation (-0.2% local appreciation)).
- Palm Beach County population projected at +30% by 2050 — long-run rental-demand tailwind backs the buy-and-hold thesis.
- At projected returns (-0.2% appreciation + 1.3% rent growth), your $50k cash investment doubles in ~8 years — after that, you're playing with house money.
Negotiation context
- It's been on market 205 days — a 12% lower offer ($158k) is reasonable based on typical stale-listing flexibility.
- Current owner paid $74k; list at $179k implies a 142% gain — meaningful room to come down on a strong offer.
Risks & watch-outs
- Watch-outs: HOA is 26% of rent.
- Climate carrying-cost: severe wind risk, 99% chance of damaging wind over 30y; extreme-heat days projected 7→26/yr by 2055 (HVAC capex compounding) — expect insurance premiums to compound above CPI over the hold.
Questions for the listing agent
- It's been on market 205 days. Have you received any prior offers? Is the seller open to a 12% concession, seller financing, or rate buy-down credit?
- What does the HOA fee cover, when was the last increase, and are there any pending special assessments or reserve-fund shortfalls?
- Any open or pending special assessments — roof, HVAC, plumbing, elevator, façade? What's the per-unit balance and payoff schedule, and is the seller paying it off at close or rolling it to the buyer?
- Why hasn't it sold? Are there any deal-killer items the seller is aware of (foundation, flood, title, zoning, code violations)?
- Is there a deadline driving the sale (1031 exchange, divorce, estate, relocation)? That informs how much negotiation room exists.
- What's the average days-on-market for RENTAL listings here right now (not sales)? A rising rental-DOM trend means longer vacancies and softer asking-rent achievability than the comps imply.
- What's the recent tenant-quality profile in this submarket — average credit score on applications, eviction rate, late-payment / NSF rate, and stable-employment percentage? A property-management company in the area should have these aggregated.
- How much new apartment / multifamily construction is in the pipeline within 1–3 miles? Heavy new supply (>2% of stock underway) typically softens rents 12–24 months out; light construction supports rent growth.
Investment metrics
- 1% rule
- 1.64% ✓
- Cap rate
- 9.39%
- Cash-on-cash
- 11.07%
- DSCR
- 1.49
- GRM
- 5.1
CMA / ARV
No comps found within radius.
Projected returns pro-forma
-0.24% appreciation · 1.28% rent growth · sell at horizon
- IRR
- 7.6%
- Equity multiple
- 1.35×
- Total profit
- $17,609
- Equity at exit
- $49,823
- IRR
- 11.3%
- Equity multiple
- 2.12×
- Total profit
- $56,375
- Equity at exit
- $58,198
Cash invested: $50,120 (down + closing). Projections, not guarantees.
Landlord ↔ Tenant lean methodology
- Overall (STATE)
- 87 Strongly Landlord-Friendly
- State Florida
- 87 Strongly Landlord-Friendly · R+3
- County
- — inherits STATE
- City
- — inherits STATE
ZIP-level market 33437
- Home prices YoY
- -0.1%
- Rents YoY
- 1.3%
- Active inventory
- 479
- Price-to-rent
- 5.1×
Monthly cashflow live
- Estimated rent
- $2,940 high interval (Pro) →
- Mortgage (P&I)
- −$939
- Tax from tax record
- −$93 /mo · $1,118/yr
- Insurance
- −$75
- HOA
- −$754
- Vacancy / Maint / Mgmt
- −$617
- Net cashflow
- $462
Break-even live
UW: 25.0% down · 7.5% · 30yr · 1.5% tax · 5.0% vac · 8.0% maint · 8.0% mgmt
Financing live
Cash to close
- Down payment
- $44,750
- Closing costs
- $5,370
- Reserves months
- —
- Total cash needed
- —
Loan-product check · same deal, 3 products live
Conventional
25% down · 7.5% · 30yr
- Down + closing
- —
- Monthly P&I
- —
- Monthly cashflow
- —
- DSCR
- —
- Eligible?
- —
Personal DTI + credit; lowest rate.
DSCR
20% down · 8.5% · 30yr
- Down + closing
- —
- Monthly P&I
- —
- Monthly cashflow
- —
- DSCR
- —
- Eligible?
- —
No personal income docs; deal must DSCR.
Hard money
10% down · 12.0% · 12mo
- Down + closing
- —
- Monthly P&I
- —
- Monthly cashflow
- —
- DSCR
- —
- Eligible?
- —
Short-term bridge; refi at stabilization.
Rent comps 40 comps
| Address | Beds | Baths | Sqft | Rent | $/sqft | DOM | Units | Dist |
|---|---|---|---|---|---|---|---|---|
| 5750 Fairway Park Ct #101 Boynton Beach, FL | 3.0 | 2.0 | 1426 | $1,850 | $1.30 | 24d | 1 | 0.09mi |
| 5675 Northpointe Ln Boynton Beach, FL | 2.0 | 2.5 | 1163 | $2,950 | $2.54 | 24d | 1 | 0.13mi |
| 5675 Northpointe Ln Boynton Beach, FL | 2.0 | 2.0 | 1163 | $3,000 | $2.58 | 3d | 1 | 0.13mi |
| 5734 Northpointe Ln Boynton Beach, FL | 2.0 | 2.0 | 1125 | $2,600 | $2.31 | 3d | 1 | 0.13mi |
| 5734 Northpointe Ln Boynton Beach, FL | 2.0 | 2.0 | 1125 | $2,750 | $2.44 | 15d | 1 | 0.13mi |
| 5694 Northpointe Ln Boynton Beach, FL | 2.0 | 2.0 | 1125 | $2,825 | $2.51 | 7d | 1 | 0.14mi |
| 12118 Country Greens Blvd Boynton Beach, FL | 3.0 | 2.0 | 1566 | $3,000 | $1.92 | 11d | 1 | 0.20mi |
| 12299 Forest Greens Dr Boynton Beach, FL | 2.0 | 2.0 | 1310 | $2,450 | $1.87 | 17d | 1 | 0.33mi |
| 12390 Summer Springs Dr Boynton Beach, FL | 3.0 | 2.0 | 1861 | $3,300 | $1.77 | 24d | 1 | 0.43mi |
| 5570 Piping Rock Dr Boynton Beach, FL | 2.0 | 2.0 | 1478 | $2,850 | $1.93 | 24d | 1 | 0.53mi |
| 5335 Vernio Ln Boynton Beach, FL | 3.0 | 2.0 | 1798 | $3,700 | $2.06 | 24d | 1 | 0.60mi |
| 12547 Imperial Isle Dr Boynton Beach, FL | 2.0–3.0 | 2.0 | 1500 | $4,500 | $3.00 | 24d | 2 | 0.63mi |
| 11282 Green Lake Dr #204 Boynton Beach, FL | 2.0 | 2.0 | 1196 | $3,750 | $3.14 | 24d | 1 | 0.75mi |
| 11234 Green Lake Dr #102 Boynton Beach, FL | 2.0 | 2.0 | 1196 | $2,200 | $1.84 | 24d | 1 | 0.80mi |
| 11230 Green Lake Dr #204 Boynton Beach, FL | 3.0 | 2.0 | 1549 | $3,000 | $1.94 | 12d | 1 | 0.81mi |
| 12654 Via Ravenna Boynton Beach, FL | 3.0 | 2.0 | 1729 | $3,500 | $2.02 | 24d | 1 | 0.85mi |
| 11211 S Military Trl Boynton Beach, FL | 1.0–3.0 | 1.0–2.0 | 1033 | $2,688 | $2.60 | 1d | 31 | 0.88mi |
| 11115 Oakdale Rd Boynton Beach, FL | 3.0 | 2.0 | 1713 | $4,200 | $2.45 | 24d | 1 | 0.92mi |
| 5574 Royal Lake Cir Boynton Beach, FL | 3.0 | 2.0 | 1658 | $5,000 | $3.02 | 15d | 1 | 0.94mi |
| 5952 Regal Glen Dr #103 Boynton Beach, FL | 3.0 | 2.0 | 1813 | $2,550 | $1.41 | 24d | 1 | 1.02mi |
| 6446 Aspen Glen Cir Unit 6446 Boynton Beach, FL | 3.0 | 2.0 | 1800 | $4,000 | $2.22 | 24d | 1 | 1.03mi |
| 6446 Aspen Glen Cir Boynton Beach, FL | 3.0 | 2.0 | 1800 | $3,800 | $2.11 | 20d | 1 | 1.03mi |
| 6599 Old Farm Trl #6599 Boynton Beach, FL | 3.0 | 2.5 | 1441 | $3,000 | $2.08 | 24d | 1 | 1.05mi |
| 10921 Royal Caribbean Cir Boynton Beach, FL | 3.0 | 2.0 | 1782 | $3,800 | $2.13 | 24d | 1 | 1.11mi |
| 10921 Royal Caribbean Cir Boynton Beach, FL | 3.0 | 2.0 | 1762 | $3,800 | $2.16 | 4d | 1 | 1.11mi |
| 6633 Old Farm Trl Boynton Beach, FL | 3.0 | 2.5 | 1441 | $3,500 | $2.43 | 24d | 1 | 1.12mi |
| 5850 Sugar Palm Ct Delray Beach, FL | 2.0 | 2.0 | 1198 | $3,300 | $2.75 | 24d | 1 | 1.12mi |
| 13921 Royal Palm Ct Unit D Delray Beach, FL | 2.0 | 2.0 | 1205 | $4,000 | $3.32 | 7d | 1 | 1.14mi |
| 6760 Heritage Grande #6304 Boynton Beach, FL | 2.0 | 2.0 | 880 | $2,000 | $2.27 | 22d | 1 | 1.14mi |
| 6768 Heritage Grande Boynton Beach, FL | 2.0 | 2.0 | 1200 | $1,800 | $1.50 | 24d | 1 | 1.14mi |
| 6768 Heritage Grande Boynton Beach, FL | 2.0 | 2.0 | 1200 | $1,800 | $1.50 | 18d | 1 | 1.14mi |
| 6769 Heritage Grande #2103 Boynton Beach, FL | 2.0 | 2.0 | 880 | $2,000 | $2.27 | 18d | 1 | 1.14mi |
| 13817 Royal Palm Ct Unit B Delray Beach, FL | 2.0 | 2.0 | 1205 | $3,200 | $2.66 | 24d | 1 | 1.23mi |
| 6685 Old Farm Trl Boynton Beach, FL | 3.0 | 2.0 | 1361 | $2,995 | $2.20 | 24d | 1 | 1.24mi |
| 6725 Old Farm Trl Boynton Beach, FL | 3.0 | 2.5 | 1441 | $3,000 | $2.08 | 20d | 1 | 1.32mi |
| 13283 Pineapple Palm Ct Unit F Delray Beach, FL | 2.0 | 2.0 | 1198 | $2,100 | $1.75 | 24d | 1 | 1.33mi |
| 13283 Pineapple Palm Ct Unit F Delray Beach, FL | 2.0 | 2.0 | 1198 | $2,100 | $1.75 | 7d | 1 | 1.33mi |
| 10596 Sunset Isles Ct Boynton Beach, FL | 3.0 | 2.0 | 1769 | $4,500 | $2.54 | 24d | 1 | 1.34mi |
| 10624 Tropic Palm Ave #202 Boynton Beach, FL | 3.0 | 2.0 | 1385 | $2,550 | $1.84 | 24d | 1 | 1.38mi |
| 13297 Via Vulcanus Unit B Delray Beach, FL | 2.0 | 2.0 | 1527 | $3,000 | $1.96 | 7d | 1 | 1.39mi |
HOA detail condo
- Monthly dues
- $754 · $9,048/yr
- Likely covers
- watercablelandscapinginsurancepoolsecurity
- Assessments
- None detected in remarks — confirm with the listing agent.
Listing history 15 events
-
2026-06-18days on market $179,000 Active 205 DOM
-
2026-06-17days on market $179,000 Active 204 DOM
-
2026-06-16days on market $179,000 Active 203 DOM
-
2026-06-15days on market $179,000 Active 202 DOM
-
2026-06-13days on market $179,000 Active 200 DOM
-
2026-06-09days on market $179,000 Active 196 DOM
-
2026-06-07days on market $179,000 Active 194 DOM
-
2026-06-04days on market $179,000 Active 191 DOM
-
2026-06-03days on market $179,000 Active 190 DOM
-
2026-06-01days on market $179,000 Active 188 DOM
-
2026-05-31days on market $179,000 Active 187 DOM
-
2026-04-16price $179,000
-
2025-11-24$219,000 Active
-
1996-06-05soldstatus $74,000
-
1980-08-01soldstatus $79,900
ⓘ Source: listings_history table (triggers on properties + properties_extension) + one-shot
backfill from property_details.listing_events for pre-trigger history.
Tax reassessment forecast FL · Resets to sale price
- Current annual tax
- $1,118 · $93/mo
- Projected year-2 tax
- $1,486 · $124/mo
- Expected delta
- +$368/yr (+$31/mo · 32.9%)
ⓘ Screening estimate from a state-policy table — verify with the county assessor before closing.
Climate risk First Street
- Flood 1/10 Low FEMA zone X (unshaded) · 0% chance over 30 yrs
- Wildfire 1/10 Low
- Heat 9/10 Extreme 7 d/yr ≥106°F today · 26 d/yr by 30 yrs out
- Wind 10/10 Extreme 99% chance of damaging wind over 30 yrs
- Air quality 2/10 Low 1 unhealthy d/yr today · 2 by 30 yrs out
Nearby sold comps map
Loading sold comps map…
Walkable amenities ~0.75 mi
Loading nearby amenities…
Taxation est. · year 1
- Rental income
- $35,282
- − Mortgage interest
- −$10,027
- − Property taxes
- −$1,118
- − Insurance
- −$895
- − Repairs & maintenance
- −$2,823
- − Management
- −$2,823
- − HOA
- −$9,048
- − Depreciation
- −$5,207
- Taxable income
- $3,342
- Est. tax owed @ 24.0%
- −$802
- After-tax cash flow
- $4,746/yr
For passive investors: Depreciation is non-cash, so a rental often shows a tax loss while cash-flowing — sheltering income. Rental losses are passive: they offset passive income freely, and up to $25,000/yr can offset ordinary (W-2) income if you actively participate and your MAGI is under $100k (phasing out to $0 by $150k); unused losses carry forward. On sale, claimed depreciation is recaptured at up to 25%, and gains may owe capital-gains tax (a 1031 exchange can defer both). Figures are a year-1 estimate at your 24.0% rate — not tax advice; consult a CPA.
Schools (NCES district)
- District
- Palm Beach
- NCES district ID
- 1201500
- Math proficiency
- 46% ▼ -16.00%
- Reading proficiency
- 53% ▼ -4.00%
- Median HH income
- $53,943
- Composite
- 42.72/100
- National rank
- #3160
- State rank
- #34 of 73 in FL
Livability — Golf
- Score
- 63/100
- State rank
- #703
- US rank
- #14941
Category grades
Schools grade is shown separately in the Schools card above.
Census & demographics
- County
- Palm Beach County · 1,438,312 people
- Metro
- Miami-Fort Lauderdale-Pompano Beach, FL
- Population (ZIP)
- 37,229
- Household income
- $80,710
- Rent vs Own
- Severe rent burden
- 902.0
Population outlook (Palm Beach County) Hauer SSP2
- Today (2025)
- 1,637,487 people
- By 2030
- 1,743,255 · +6.5%
- By 2040
- 1,948,712 · +19.0%
- By 2050
- 2,132,979 · +30.3%
- By 2075
- 2,530,027 · +54.5%
- By 2100
- 2,706,979 · +65.3%
Race, ethnicity, and origin ACS 2023
- Neighborhood character
- Predominantly White (68%)
- Race & ethnicity
- White 68% Two or more races 13% Hispanic / Latino 12% Black 10% Asian 3%
- Hispanic origin (detail)
- Mexican 1% Puerto Rican 2% Cuban 1% Dominican 1%
- Common ancestry
- Scotch-Irish 8% Romanian 8% Hispanic 6%
- Foreign-born
- 18% · Canada, Jamaica, Vietnam
- Languages at home
- 78% English-only · Spanish 10% French/Haitian/Cajun 6% Other Indo-European 2%
Political lean MEDSL · Palm Beach
- 2024 margin
- Toss-up / Even · D 50.0% · R 49.2%
- 2008→2024 swing
- -22.1pp toward R · 2008: 22.9pp · 2024: 0.8pp
- All cycles
- 2024: D+0.8 2020: D+12.8 2016: D+15.3 2012: D+17.0 2008: D+22.9
Not yet ingested
- Civics
- —
Market trends
- HPI YoY
- ▼ -0.24%
- Current HPI
- 257.5891
- Rent YoY
- ▲ 1.28%
- Metro
- Miami-Fort Lauderdale-Pompano Beach, FL
- State GDP YoY
- ▲ 3.28%
- F500 in state
- 36
Industry mix (Fortune 500 HQ in FL)
| Industry | F500 HQs | Revenue |
|---|---|---|
| Industrial Technology | 2 | $29B |
|
||
| Insurance | 2 | $17B |
|
||
| Retail | 1 | $60B |
|
||
| Technology Distribution | 1 | $58B |
|
||
| Homebuilding | 1 | $35B |
|
||
| Technology Manufacturing | 1 | $35B |
|
||
Price history
+124.0% since first listed4 events — show timeline
- 2026-04-16 Price Changed $179,000 Beaches MLS
- 2025-11-24 Listed $219,000 Beaches MLS
- 1996-06-05 Sold (Public Records) $74,000 Public Records
- 1980-08-01 Sold (Public Records) $79,900 Public Records
Property tax history
+1.8%/yrLatest (2025): $1,118 · +4.1% YoY. Source: county tax records.
Cash-flow waterfall
monthlySold comps — $/sqft
last 12 mo · ≤1 miLoading sold comps…