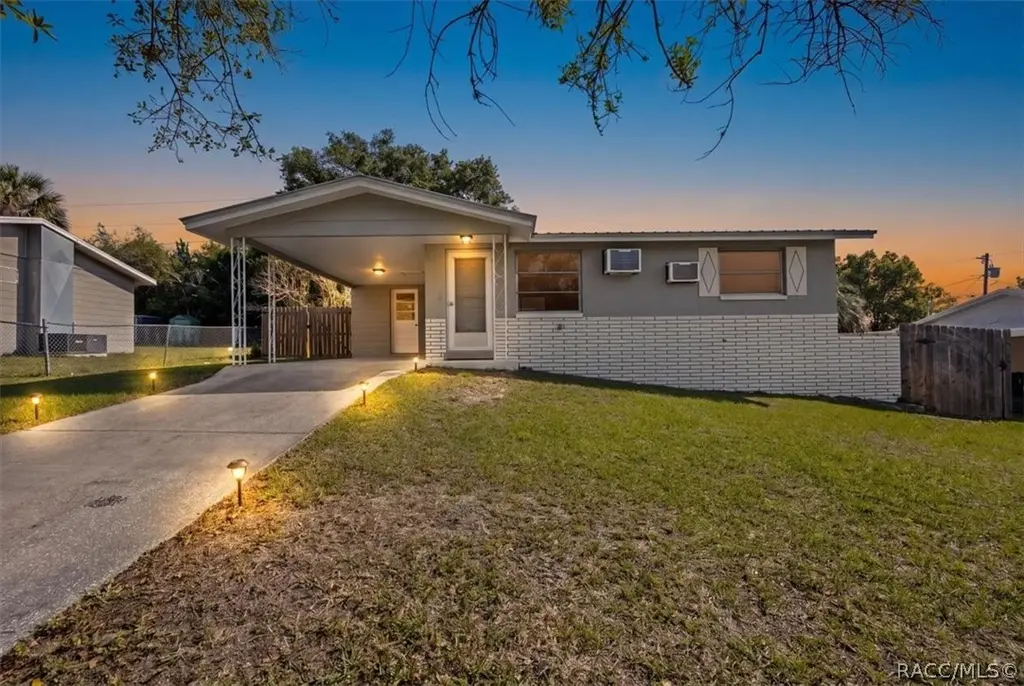
11 Polk St · Beverly Hills, FL
Flood risk 1/10 · Minimal
- FEMA flood zone
- X (unshaded)
- Chance of flooding over 30 yrs
- 0.0%
- Est. flood insurance / yr
- $507 – $1,088
Fire risk 3/10 · Minor
- Est. fire insurance / yr
- $947 – $1,759
Heat risk 10/10 · Severe
- Hot days now (above 108°F)
- 7 days/yr
- Hot days in 30 yrs
- 25 days/yr
Wind risk 9/10 · Severe
- Chance of severe wind over 30 yrs
- 99.0%
Air-quality risk 1/10 · Minimal
- Unhealthy air days now
- 0 days/yr
- Unhealthy air days in 30 yrs
- 0 days/yr
Risk factors via First Street. Map © Google.
Why this score? — see what drove the D grade
The composite is a weighted blend of 9 inputs, each scored 0–100. Each bar is that input's sub-score; the figure is the points it added to the 100-point composite (weight × sub-score).
- Cash flow +14.5/30.0
- ARV discount +5.7/15.0
- DSCR +4.4/10.0
- Schools +4.1/10.0
- 1% rule +3.2/10.0
- Livability +3.2/5.0
- Rent growth +2.5/5.0
- Condition / age +2.5/5.0
- Appreciation +0.0/10.0
$154,900
🖨 Deal sheet 📄 Offer letter ✓ Due diligence
Listing remarks MLS
Cute Bank Owbed Beverly Hills cutie for ONLY $26,600!!! Attached carport, Florida room, terrazo floors. .. Just can't beat the price!!!
Key facts
- Covered carport
- 6,600 sq ft lot
- Parking
Tags
Property features AI
Exterior
- Parking: Attached carport; Driveway; Concrete parking surfaces; Total of 1 parking space
- Utilities: Public water; Public sewer
- Home design: Single-family residence; One story; Stucco construction; Block and slab foundation
- Construction: Stucco exterior; Metal roof; Block and slab foundation; Built as a one-story single-family home
- Exterior features: Privacy wood fencing; Paved road access; Cleared lot; Outdoor pool
Interior
- Kitchen: Electric cooktop, electric oven, microwave
- Flooring: Terrazzo
- Bathrooms: 1 full bathroom
- Heating & cooling: Wall furnace heating; Wall/window cooling units
- Interior features: Electric cooktop, electric oven, and microwave; Terrazzo flooring
Neighborhood map
What this means for you Summary
Snapshot
- This is a 1-bed/1.0-bath single-family listed at $155k.
Deal economics
- At list price, monthly cash flow is $33 ($395/yr) — positive.
- The deal already cash-flows at list — no discount required.
- To meet the 1% rule (rent ≥ 1% of price), the offer needs to be $127k (18.1% below list).
- Recommended offer: $127k (18.1% below list) — sets the bar for 1% rule.
Location & tenants
- Location reads 64/100 on livability (#666 in FL) — a middle-class / working-renter tenant base. Strengths: cost of living A+, housing A+, health & safety A+; Watch: amenities F, commute F, employment F.
- Citrus (rural): math 49% / reading 50% proficiency, ranked #44 of 73 in FL (top 60%) — families likely to look elsewhere, expect single-tenant / working-renter base with shorter leases.
- Zoned schools: Central Ridge Elementary School (math 41% / reading 44%, grade F, #1,383 of 2,144 statewide, top 65%, 723 students, 64% FRL); Citrus Springs Middle School (math 55% / reading 54%, grade B-, #183 of 571 statewide, top 34%, 821 students, 59% FRL); Lecanto High School (math 46% / reading 53%, grade D, #179 of 667 statewide, top 29%, 1,630 students, 46% FRL) — zoned schools at 56% FRL track the district average.
- Market conditions: 396 active listings in the ZIP; 9 comparable units currently listed for rent nearby; rentals at typical pace (median 21d on market — plan ~3-4 weeks tenant-placement turnaround); 2,443 units permitted in Citrus County in 2024 (0 in 5+ unit buildings).
Forward outlook
- Local home prices are declining (-3.0%/yr); year-one equity from $1k of loan paydown is wiped out by about $5k of value loss. Plan a longer hold.
- Citrus County population projected to shrink 10% by 2050 — rents likely to lag national; underwrite the cash flow, not the appreciation.
Negotiation context
- It's been on market 20 days — a 2% lower offer ($153k) is reasonable based on typical stale-listing flexibility.
- 4 sale attempts since 21y ago with the ask held roughly flat each time — persistent listings suggest the price (not the market) is what's stuck; bring a comps-based counter.
Risks & watch-outs
- Climate carrying-cost: severe wind risk, 99% chance of damaging wind over 30y; extreme-heat days projected 7→25/yr by 2055 (HVAC capex compounding) — expect insurance premiums to compound above CPI over the hold.
Questions for the listing agent
- Built in 1971 — when were the roof, HVAC, electrical panel, plumbing, and water heater last replaced?
- Is there a deadline driving the sale (1031 exchange, divorce, estate, relocation)? That informs how much negotiation room exists.
- Schools are F-rated, which usually means shorter tenancies and higher turnover. Who's the typical renter profile here, and what's been the actual vacancy rate?
- The area grade is low — what's the realistic commute time and amenity access for the typical tenant pool here? Any planned neighborhood developments (good or bad) we should know about?
- What's the average days-on-market for RENTAL listings here right now (not sales)? A rising rental-DOM trend means longer vacancies and softer asking-rent achievability than the comps imply.
- What's the recent tenant-quality profile in this submarket — average credit score on applications, eviction rate, late-payment / NSF rate, and stable-employment percentage? A property-management company in the area should have these aggregated.
- How much new for-sale + rental construction is in the pipeline within 1–3 miles? Heavy new supply typically softens prices + rents 12–24 months out; constrained supply supports both.
Investment metrics
- 1% rule
- 0.82% ✗
- Cap rate
- 6.55%
- Cash-on-cash
- 0.91%
- DSCR
- 1.04
- GRM
- 10.2
CMA / ARV
- ARV (on-the-fly)
- $148,953
- Comps found
- 12
Show comp detail 12 sales within ~0.75 mi
| Address | Dist | Beds/Ba | Sqft | Sold | Price | $/sf | Match |
|---|---|---|---|---|---|---|---|
| 4 New North Ct | 0.06mi | 2/1.0 (+1) | 840 (-2%) | 1mo | $145,000 | $173 | 87 |
| 53 S Jefferson St | 0.17mi | 2/1.0 (+1) | 936 (+9%) | 3mo | $152,000 | $162 | 70 |
| 22 Roosevelt Blvd | 0.21mi | 2/1.0 (+1) | 936 (+9%) | 4mo | $166,900 | $178 | 68 |
| 58 S Jackson St | 0.25mi | 2/1.0 (+1) | 932 (+8%) | 5mo | $147,000 | $158 | 65 |
| 18 S Harrison St | 0.45mi | 2/1.0 (+1) | 900 (+4%) | 2mo | $120,000 | $133 | 65 |
| 49 S Lee St | 0.56mi | 2/1.0 (+1) | 840 (-2%) | 1mo | $172,000 | $205 | 64 |
| 230 S Jackson St | 0.64mi | 2/1.0 (+1) | 908 (+6%) | 2mo | $160,000 | $176 | 54 |
| 16 N Jackson St | 0.63mi | 2/1.0 (+1) | 912 (+6%) | 3mo | $84,000 | $92 | 53 |
| 29 N Wadsworth Ave | 0.68mi | 2/1.5 (+1) | 832 (-3%) | 6mo | $160,000 | $192 | 51 |
| 232 S Fillmore St | 0.73mi | 2/1.0 (+1) | 816 (-5%) | 5mo | $152,000 | $186 | 48 |
| 5 N Lincoln Ave | 0.71mi | 2/1.0 (+1) | 936 (+9%) | 4mo | $160,000 | $171 | 44 |
| 27 E Lemon St | 0.73mi | 2/1.0 (+1) | 950 (+10%) | 1mo | $94,000 | $99 | 43 |
Match score weights: distance 35% · size 25% · config 20% · recency 20%. Top-matched comps best support the ARV.
Projected returns pro-forma
-3.0% appreciation · 3.0% rent growth · sell at horizon
- IRR
- -14.9%
- Equity multiple
- 0.47×
- Total profit
- $-23,049
- Equity at exit
- $23,096
- IRR
- -6.3%
- Equity multiple
- 0.60×
- Total profit
- $-17,548
- Equity at exit
- $13,393
Cash invested: $43,372 (down + closing). Projections, not guarantees.
Landlord ↔ Tenant lean methodology
- Overall (STATE)
- 87 Strongly Landlord-Friendly
- State Florida
- 87 Strongly Landlord-Friendly · R+3
- County
- — inherits STATE
- City
- — inherits STATE
ZIP-level market 34465
- Home prices YoY
- -33.1%
- Active inventory
- 396
- Price-to-rent
- 10.2×
Monthly cashflow live
- Estimated rent
- $1,268 high interval (Pro) →
- Mortgage (P&I)
- −$812
- Tax from tax record
- −$92 /mo · $1,107/yr
- Insurance
- −$65
- HOA
- −$0
- Vacancy / Maint / Mgmt
- −$266
- Net cashflow
- $33
Break-even live
UW: 25.0% down · 7.5% · 30yr · 1.5% tax · 5.0% vac · 8.0% maint · 8.0% mgmt
Financing live
Cash to close
- Down payment
- $38,725
- Closing costs
- $4,647
- Reserves months
- —
- Total cash needed
- —
Loan-product check · same deal, 3 products live
Conventional
25% down · 7.5% · 30yr
- Down + closing
- —
- Monthly P&I
- —
- Monthly cashflow
- —
- DSCR
- —
- Eligible?
- —
Personal DTI + credit; lowest rate.
DSCR
20% down · 8.5% · 30yr
- Down + closing
- —
- Monthly P&I
- —
- Monthly cashflow
- —
- DSCR
- —
- Eligible?
- —
No personal income docs; deal must DSCR.
Hard money
10% down · 12.0% · 12mo
- Down + closing
- —
- Monthly P&I
- —
- Monthly cashflow
- —
- DSCR
- —
- Eligible?
- —
Short-term bridge; refi at stabilization.
Rent comps 9 comps
| Address | Beds | Baths | Sqft | Rent | $/sqft | DOM | Units | Dist |
|---|---|---|---|---|---|---|---|---|
| 5 New North Ct Beverly Hills, FL | 1.0 | 1.0 | 864 | $1,100 | $1.27 | 21d | 1 | 0.09mi |
| 31 S Barbour St Beverly Hills, FL | 2.0 | 1.0 | 1027 | $1,525 | $1.48 | 21d | 1 | 0.25mi |
| 7 Donna Ct Beverly Hills, FL | 1.0 | 1.0 | 675 | $1,225 | $1.81 | 21d | 1 | 0.26mi |
| 41 S Monroe St Beverly Hills, FL | 2.0 | 1.0 | 932 | $1,300 | $1.39 | 21d | 1 | 0.28mi |
| 45 S Jackson St Beverly Hills, FL | 2.0 | 1.0 | 1108 | $1,275 | $1.15 | 21d | 1 | 0.31mi |
| 11 S Barbour St Beverly Hills, FL | 2.0 | 1.0 | 808 | $1,349 | $1.67 | 21d | 1 | 0.39mi |
| 95 S Fillmore St Beverly Hills, FL | 2.0 | 1.0 | 1056 | $1,300 | $1.23 | 21d | 1 | 0.51mi |
| 17 N Davis St Beverly Hills, FL | 2.0 | 1.0 | 1108 | $1,000 | $0.90 | 21d | 1 | 0.86mi |
| 12 Montana St Beverly Hills, FL | 2.0 | 1.0 | 1088 | $1,700 | $1.56 | 21d | 1 | 1.20mi |
Listing history 12 events
-
2026-05-13status Pending
-
2026-04-22$154,900 Active
-
2023-07-11soldstatus $150,000
-
2021-09-10soldstatus $75,000
-
2009-06-18soldstatus $26,600 135-char remark
Show marketing remark (135 chars)
Cute Bank Owbed Beverly Hills cutie for ONLY $26,600!!! Attached carport, Florida room, terrazo floors. .. Just can't beat the price!!!
-
2009-04-01$26,600 135-char remark
Show marketing remark (135 chars)
Cute Bank Owbed Beverly Hills cutie for ONLY $26,600!!! Attached carport, Florida room, terrazo floors. .. Just can't beat the price!!!
-
2006-05-02soldstatus $82,500
-
2006-04-25soldstatus $82,250 285-char remark
Show marketing remark (285 chars)
Neat as a pin, clean as a whistle is what best describes this 1 possible 2 bedroom home located in desirable area of Beverly Hills, close to Church and shopping. Sellers will pay up to $5,000.00 towards closing costs at closing. Agent owned. Home is sold as is with right to inspect.
-
2005-11-01$85,900 285-char remark
Show marketing remark (285 chars)
Neat as a pin, clean as a whistle is what best describes this 1 possible 2 bedroom home located in desirable area of Beverly Hills, close to Church and shopping. Sellers will pay up to $5,000.00 towards closing costs at closing. Agent owned. Home is sold as is with right to inspect.
-
2005-07-07soldstatus $62,000
-
2005-06-29soldstatus $62,000
-
2005-05-21$59,900
ⓘ Source: listings_history table (triggers on properties + properties_extension) + one-shot
backfill from property_details.listing_events for pre-trigger history.
Tax reassessment forecast FL · Resets to sale price
- Current annual tax
- $1,107 · $92/mo
- Projected year-2 tax
- $1,286 · $107/mo
- Expected delta
- +$179/yr (+$15/mo · 16.1%)
ⓘ Screening estimate from a state-policy table — verify with the county assessor before closing.
Climate risk First Street
- Flood 1/10 Low FEMA zone X (unshaded) · 0% chance over 30 yrs
- Wildfire 3/10 Moderate
- Heat 10/10 Extreme 7 d/yr ≥108°F today · 25 d/yr by 30 yrs out
- Wind 9/10 Extreme 99% chance of damaging wind over 30 yrs
- Air quality 1/10 Low 0 unhealthy d/yr today · 0 by 30 yrs out
Nearby sold comps map
Loading sold comps map…
Walkable amenities ~0.75 mi
Loading nearby amenities…
Taxation est. · year 1
- Rental income
- $15,220
- − Mortgage interest
- −$8,677
- − Property taxes
- −$1,107
- − Insurance
- −$774
- − Repairs & maintenance
- −$1,218
- − Management
- −$1,218
- − Depreciation
- −$4,506
- Taxable loss
- −$2,280
- Est. tax savings @ 24.0%
- +$547
- After-tax cash flow
- $942/yr
For passive investors: Depreciation is non-cash, so a rental often shows a tax loss while cash-flowing — sheltering income. Rental losses are passive: they offset passive income freely, and up to $25,000/yr can offset ordinary (W-2) income if you actively participate and your MAGI is under $100k (phasing out to $0 by $150k); unused losses carry forward. On sale, claimed depreciation is recaptured at up to 25%, and gains may owe capital-gains tax (a 1031 exchange can defer both). Figures are a year-1 estimate at your 24.0% rate — not tax advice; consult a CPA.
Schools (NCES district)
- District
- Citrus
- NCES district ID
- 1200270
- Math proficiency
- 49% ▼ -10.00%
- Reading proficiency
- 50% ▼ -6.00%
- Median HH income
- $38,618
- Composite
- 41.28/100
- National rank
- #3519
- State rank
- #44 of 73 in FL
Livability — Beverly Hills
- Score
- 64/100
- State rank
- #666
- US rank
- #13671
Category grades
Schools grade is shown separately in the Schools card above.
Census & demographics
- Census place
- Beverly Hills, FL
- County
- Citrus County · 111,314 people
- City population
- 18,879
- Metro
- Homosassa Springs, FL
- Population (ZIP)
- 18,879
- Household income
- $54,869
- Rent vs Own
- Severe rent burden
- 334.0
Population outlook (Citrus County) Hauer SSP2
- Today (2025)
- 138,622 people
- By 2030
- 136,886 · -1.3%
- By 2040
- 132,009 · -4.8%
- By 2050
- 125,196 · -9.7%
- By 2075
- 108,570 · -21.7%
- By 2100
- 84,454 · -39.1%
Race, ethnicity, and origin ACS 2023
- Neighborhood character
- Predominantly White (82%)
- Race & ethnicity
- White 82% Hispanic / Latino 8% Black 4% Two or more races 3% Asian 2%
- Hispanic origin (detail)
- Mexican 1% Puerto Rican 3%
- Common ancestry
- Romanian 4% Lithuanian 3% Slovak 2%
- Foreign-born
- 8% · Canada, Vietnam, Dominican Republic
- Languages at home
- 93% English-only · Spanish 4% French/Haitian/Cajun 1% Other Asian/Pacific 1%
Political lean MEDSL · Citrus
- 2024 margin
- Solid R (+45.9) · D 26.8% · R 72.6%
- 2008→2024 swing
- -29.8pp toward R · 2008: -16.1pp · 2024: -45.9pp
- All cycles
- 2024: R+45.9 2020: R+41.0 2016: R+39.7 2012: R+21.9 2008: R+16.1
Not yet ingested
- Civics
- —
Market trends
- HPI YoY
- ▼ -138.62%
- Current HPI
- 279.7183
- Rent YoY
- —
- Metro
- Homosassa Springs, FL
- State GDP YoY
- ▲ 3.28%
- F500 in state
- 36
Industry mix (Fortune 500 HQ in FL)
| Industry | F500 HQs | Revenue |
|---|---|---|
| Industrial Technology | 2 | $29B |
|
||
| Insurance | 2 | $17B |
|
||
| Retail | 1 | $60B |
|
||
| Technology Distribution | 1 | $58B |
|
||
| Homebuilding | 1 | $35B |
|
||
| Technology Manufacturing | 1 | $35B |
|
||
Price history
+158.6% since first listed12 events — show timeline
- 2026-05-13 Pending — RACC
- 2026-04-22 Listed $154,900 RACC
- 2023-07-11 Sold (Public Records) $150,000 Public Records
- 2021-09-10 Sold (Public Records) $75,000 Public Records
- 2009-06-18 Sold (MLS) $26,600 RACC
- 2009-04-01 Listed $26,600 RACC
- 2006-05-02 Sold (Public Records) $82,500 Public Records
- 2006-04-25 Sold (MLS) $82,250 RACC
- 2005-11-01 Listed $85,900 RACC
- 2005-07-07 Sold (Public Records) $62,000 Public Records
- 2005-06-29 Sold (MLS) $62,000 RACC
- 2005-05-21 Listed $59,900 RACC
Property tax history
+8.8%/yrLatest (2025): $1,107 · +3.9% YoY. Source: county tax records.
Cash-flow waterfall
monthlySold comps — $/sqft
last 12 mo · ≤1 miLoading sold comps…