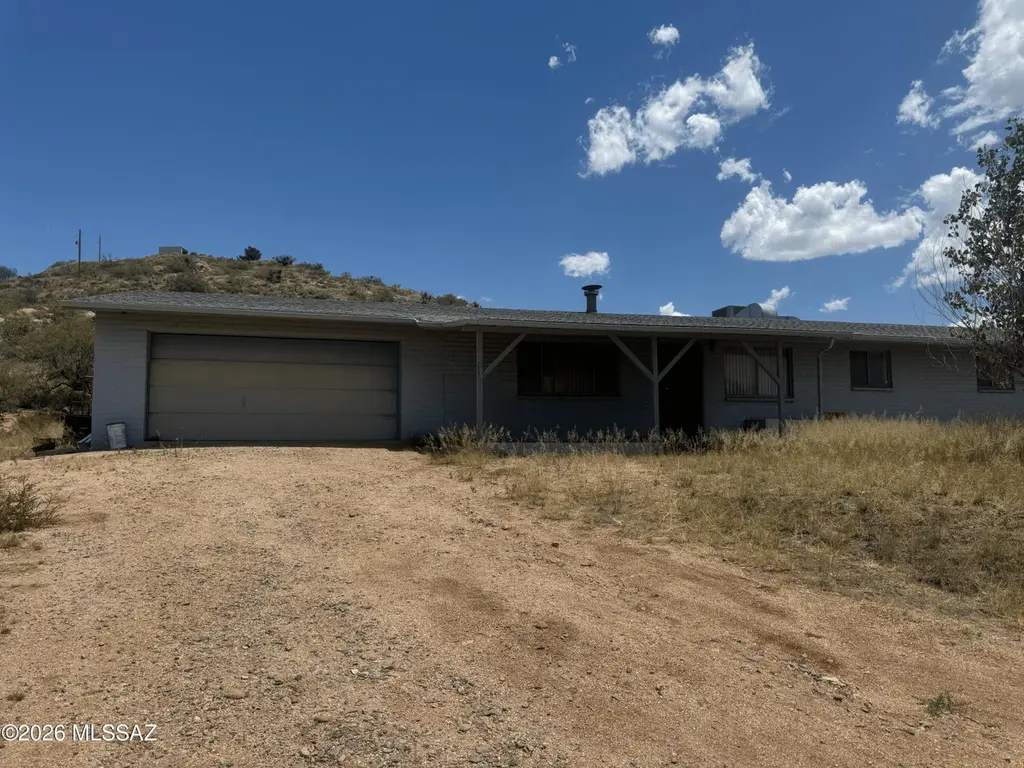
955 N New Moon Dr · Oracle, AZ
Flood risk 1/10 · Minimal
- FEMA flood zone
- X (unshaded)
- Chance of flooding over 30 yrs
- 0.0%
- Est. flood insurance / yr
- $507 – $1,088
Fire risk 7/10 · Major
- Est. fire insurance / yr
- $610 – $1,132
Heat risk 5/10 · Moderate
- Hot days now (above 97°F)
- 7 days/yr
- Hot days in 30 yrs
- 20 days/yr
Wind risk 1/10 · Minimal
- Chance of severe wind over 30 yrs
- —
Air-quality risk 2/10 · Minimal
- Unhealthy air days now
- 1 days/yr
- Unhealthy air days in 30 yrs
- 1 days/yr
Risk factors via First Street. Map © Google.
Why this score? — see what drove the C- grade
The composite is a weighted blend of 9 inputs, each scored 0–100. Each bar is that input's sub-score; the figure is the points it added to the 100-point composite (weight × sub-score).
- Cash flow +21.8/30.0
- ARV discount +7.5/15.0
- DSCR +7.0/10.0
- 1% rule +5.1/10.0
- Livability +3.1/5.0
- Rent growth +2.5/5.0
- Condition / age +2.5/5.0
- Schools +2.1/10.0
- Appreciation +0.0/10.0
$187,650
🖨 Deal sheet 📄 Offer letter ✓ Due diligence
Listing remarks
Welcome to the 3 bedroom 2 bathroom home on 1.25 acres in quiet Oracle.
Key facts
- 1.25 acre lot
- Built 1982
Neighborhood map
What this means for you Summary
Snapshot
- This is a 3-bed/2.0-bath single-family listed at $188k.
Deal economics
- At list price, monthly cash flow is $292 ($4k/yr) — positive.
- The deal already cash-flows at list — no discount required.
- Meets the 1% rule at list price ($2k rent vs $188k).
- Cap rate 8.2% vs local median 4.2% in Oracle — top-decile yield for the area; either an underpriced asset or a hidden risk that comps aren't pricing in. Stress-test before assuming the spread holds.
Location & tenants
- Location reads 61/100 on livability (#152 in AZ) — a middle-class / working-renter tenant base. Strengths: cost of living A+, crime A, housing B; Watch: health & safety C-, amenities F, commute F.
- Oracle Elementary District (4444) (rural): math 15% / reading 30% proficiency, ranked #159 of 249 in AZ (top 64%) — low school quality limits family demand, transient renter base, plan for 1-2y turnover.
- Zoned schools: Mountain Vista School (math 15% / reading 30%, grade F, #679 of 1,109 statewide, top 62%, 399 students, 55% FRL) — zoned schools average 55% FRL vs 37% district-wide (18 pts higher); higher-poverty schools than district average — tighter screening recommended.
- Market conditions: 108 active listings in the ZIP; 1 comparable units currently listed for rent nearby; 9,504 units permitted in Pinal County in 2024 (776 in 5+ unit buildings).
Forward outlook
- Local home prices are declining (-3.0%/yr); year-one equity from $1k of loan paydown is wiped out by about $6k of value loss. Plan a longer hold.
Negotiation context
- Only 0 days on market — expect competitive offers; lowballing is unlikely to land.
- Current owner paid $82k; list at $188k implies a 129% gain — meaningful room to come down on a strong offer.
Risks & watch-outs
- Climate carrying-cost: major wildfire risk; extreme-heat days projected 7→20/yr by 2055 (HVAC capex compounding) — expect insurance premiums to compound above CPI over the hold.
Questions for the listing agent
- Is there a deadline driving the sale (1031 exchange, divorce, estate, relocation)? That informs how much negotiation room exists.
- Schools are F-rated, which usually means shorter tenancies and higher turnover. Who's the typical renter profile here, and what's been the actual vacancy rate?
- What's the average days-on-market for RENTAL listings here right now (not sales)? A rising rental-DOM trend means longer vacancies and softer asking-rent achievability than the comps imply.
- What's the recent tenant-quality profile in this submarket — average credit score on applications, eviction rate, late-payment / NSF rate, and stable-employment percentage? A property-management company in the area should have these aggregated.
- How much new for-sale + rental construction is in the pipeline within 1–3 miles? Heavy new supply typically softens prices + rents 12–24 months out; constrained supply supports both.
Investment metrics
- 1% rule
- 1.01% ✓
- Cap rate
- 8.16%
- Cash-on-cash
- 6.68%
- DSCR
- 1.30
- GRM
- 8.3
CMA / ARV
- ARV (on-the-fly)
- $431,640
- Comps found
- 7
Show comp detail 7 sales within ~0.75 mi
| Address | Dist | Beds/Ba | Sqft | Sold | Price | $/sf | Match |
|---|---|---|---|---|---|---|---|
| 955 N New Moon Dr | 0.00mi | 3/2.0 | 1,980 (0%) | 0mo | $187,650 | $95 | 100 |
| 1480 N Calle Zamora -- | 0.33mi | 3/2.0 | 1,965 (-1%) | 15mo | $329,000 | $167 | 71 |
| 1450 W Linda Vista Rd | 0.50mi | 2/2.0 (-1) | 1,856 (-6%) | 2mo | $405,000 | $218 | 60 |
| 913 N Two O'clock Hill Rd | 0.41mi | 3/3.0 | 2,070 (+4%) | 16mo | $508,000 | $245 | 56 |
| 1250 N Caminito | 0.59mi | 3/2.0 | 1,867 (-6%) | 15mo | $395,000 | $212 | 51 |
| 1276 N Javelina St | 0.48mi | 2/2.0 (-1) | 2,144 (+8%) | 12mo | $480,000 | $224 | 48 |
| 200 N Holiday Dr | 0.69mi | 3/3.0 | 1,726 (-13%) | 3mo | $425,000 | $246 | 40 |
Match score weights: distance 35% · size 25% · config 20% · recency 20%. Top-matched comps best support the ARV.
Projected returns pro-forma
-3.0% appreciation · 3.0% rent growth · sell at horizon
- IRR
- -6.1%
- Equity multiple
- 0.78×
- Total profit
- $-11,806
- Equity at exit
- $27,979
- IRR
- 3.6%
- Equity multiple
- 1.26×
- Total profit
- $13,594
- Equity at exit
- $16,225
Cash invested: $52,542 (down + closing). Projections, not guarantees.
Landlord ↔ Tenant lean methodology
- Overall (STATE)
- 87 Strongly Landlord-Friendly
- State Arizona
- 87 Strongly Landlord-Friendly · R+3
- County
- — inherits STATE
- City
- — inherits STATE
ZIP-level market 85623
- Home prices YoY
- -22.3%
- Active inventory
- 108
- Price-to-rent
- 8.3×
Monthly cashflow live
- Estimated rent
- $1,895 medium interval (Pro) →
- Mortgage (P&I)
- −$984
- Tax from tax record
- −$142 /mo · $1,708/yr
- Insurance
- −$78
- HOA
- −$0
- Vacancy / Maint / Mgmt
- −$398
- Net cashflow
- $292
Break-even live
UW: 25.0% down · 7.5% · 30yr · 1.5% tax · 5.0% vac · 8.0% maint · 8.0% mgmt
Financing live
Cash to close
- Down payment
- $46,912
- Closing costs
- $5,630
- Reserves months
- —
- Total cash needed
- —
Loan-product check · same deal, 3 products live
Conventional
25% down · 7.5% · 30yr
- Down + closing
- —
- Monthly P&I
- —
- Monthly cashflow
- —
- DSCR
- —
- Eligible?
- —
Personal DTI + credit; lowest rate.
DSCR
20% down · 8.5% · 30yr
- Down + closing
- —
- Monthly P&I
- —
- Monthly cashflow
- —
- DSCR
- —
- Eligible?
- —
No personal income docs; deal must DSCR.
Hard money
10% down · 12.0% · 12mo
- Down + closing
- —
- Monthly P&I
- —
- Monthly cashflow
- —
- DSCR
- —
- Eligible?
- —
Short-term bridge; refi at stabilization.
Rent comps 1 comps
| Address | Beds | Baths | Sqft | Rent | $/sqft | DOM | Units | Dist |
|---|---|---|---|---|---|---|---|---|
| 2320 W Calle Grato Oracle, AZ | 3.0 | 2.0 | 1916 | $1,895 | $0.99 | 43d | 1 | 0.33mi |
Listing history 2 events
-
2026-06-07remarks 71-char remark
-
2026-06-07$187,650 Pending
ⓘ Source: listings_history table (triggers on properties + properties_extension) + one-shot
backfill from property_details.listing_events for pre-trigger history.
Tax reassessment forecast AZ · Resets to sale price
- Current annual tax
- $1,708 · $142/mo
- Projected year-2 tax
- $1,708 · $142/mo
- Expected delta
- $0/yr ($0/mo · 0.0%)
ⓘ Screening estimate from a state-policy table — verify with the county assessor before closing.
Climate risk First Street
- Flood 1/10 Low FEMA zone X (unshaded) · 0% chance over 30 yrs
- Wildfire 7/10 Severe
- Heat 5/10 Major 7 d/yr ≥97°F today · 20 d/yr by 30 yrs out
- Wind 1/10 Low
- Air quality 2/10 Low 1 unhealthy d/yr today · 1 by 30 yrs out
Nearby sold comps map
Loading sold comps map…
Walkable amenities ~0.75 mi
Loading nearby amenities…
Taxation est. · year 1
- Rental income
- $22,740
- − Mortgage interest
- −$10,511
- − Property taxes
- −$1,708
- − Insurance
- −$938
- − Repairs & maintenance
- −$1,819
- − Management
- −$1,819
- − Depreciation
- −$5,459
- Taxable income
- $485
- Est. tax owed @ 24.0%
- −$117
- After-tax cash flow
- $3,393/yr
For passive investors: Depreciation is non-cash, so a rental often shows a tax loss while cash-flowing — sheltering income. Rental losses are passive: they offset passive income freely, and up to $25,000/yr can offset ordinary (W-2) income if you actively participate and your MAGI is under $100k (phasing out to $0 by $150k); unused losses carry forward. On sale, claimed depreciation is recaptured at up to 25%, and gains may owe capital-gains tax (a 1031 exchange can defer both). Figures are a year-1 estimate at your 24.0% rate — not tax advice; consult a CPA.
Schools (NCES district)
- District
- Oracle Elementary District (4444)
- NCES district ID
- 0405640
- Math proficiency
- 15% ▼ -9.00%
- Reading proficiency
- 30% ▲ 3.00%
- Median HH income
- $60,899
- Composite
- 20.97/100
- National rank
- #8469
- State rank
- #159 of 249 in AZ
Livability — Oracle
- Score
- 61/100
- State rank
- #152
- US rank
- #17707
Category grades
Schools grade is shown separately in the Schools card above.
Census & demographics
- Census place
- Oracle, AZ
- Population (ZIP)
- 5,235
Population outlook (Pinal County) Hauer SSP2
- Today (2025)
- 437,574 people
- By 2030
- 446,903 · +2.1%
- By 2040
- 452,589 · +3.4%
- By 2050
- 444,126 · +1.5%
- By 2075
- 430,300 · -1.7%
- By 2100
- 393,536 · -10.1%
Race, ethnicity, and origin ACS 2023
- Neighborhood character
- Predominantly White (77%)
- Race & ethnicity
- White 77% Hispanic / Latino 21% Two or more races 18%
- Hispanic origin (detail)
- Mexican 18%
- Common ancestry
- Romanian 6% Lithuanian 3% Italian 2%
- Foreign-born
- 6% · Canada
- Languages at home
- 90% English-only · Spanish 7% German/W. Germanic 2%
Political lean MEDSL · Pinal
- 2024 margin
- Strong R (+22.1) · D 38.5% · R 60.6%
- 2008→2024 swing
- -7.6pp toward R · 2008: -14.5pp · 2024: -22.1pp
- All cycles
- 2024: R+22.1 2020: R+17.3 2016: R+19.3 2012: R+17.1 2008: R+14.5
Not yet ingested
- Civics
- —
Market trends
- HPI YoY
- ▼ -68.00%
- Current HPI
- 237.4886
- Rent YoY
- —
- Metro
- —
- State GDP YoY
- ▲ 4.54%
- F500 in state
- 20
Industry mix (Fortune 500 HQ in AZ)
| Industry | F500 HQs | Revenue |
|---|---|---|
| Technology | 2 | $13B |
|
||
| Mining / Metals | 1 | $23B |
|
||
| Environmental Services | 1 | $16B |
|
||
| Metals / Steel | 1 | $14B |
|
||
| Technology Distribution | 1 | $9B |
|
||
| Homebuilding | 1 | $8B |
|
||
Price history
+128.8% since first listed3 events — show timeline
- 2026-06-04 Listing Removed — MLSSAZ
- 2026-06-04 Listed $187,650 MLSSAZ
- 1987-04-28 Sold (Public Records) $82,000 Public Records
Property tax history
+2.4%/yrLatest (2025): $1,708 · +5.1% YoY. Source: county tax records.
Cash-flow waterfall
monthlySold comps — $/sqft
last 12 mo · ≤1 miLoading sold comps…