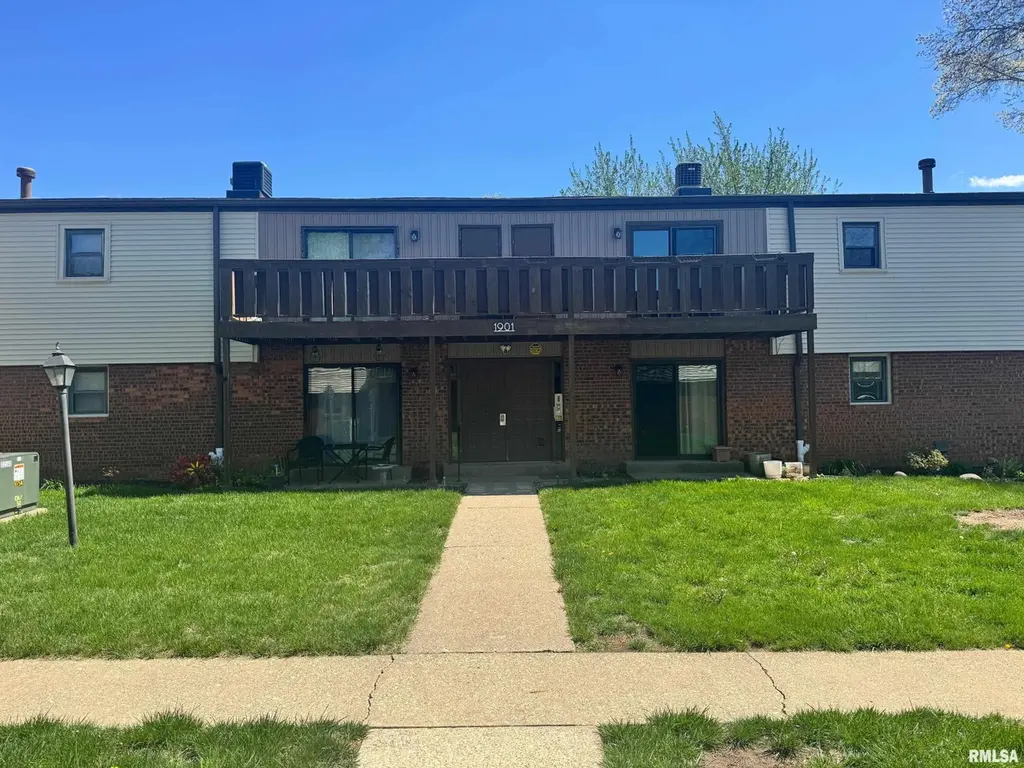
1901 Jeanette Ln #6 · Springfield, IL
Flood risk 1/10 · Minimal
- FEMA flood zone
- X (unshaded)
- Chance of flooding over 30 yrs
- 0.0%
- Est. flood insurance / yr
- $507 – $1,088
Fire risk 1/10 · Minimal
- Est. fire insurance / yr
- $804 – $1,492
Heat risk 4/10 · Minor
- Hot days now (above 105°F)
- 7 days/yr
- Hot days in 30 yrs
- 20 days/yr
Wind risk 2/10 · Minimal
- Chance of severe wind over 30 yrs
- 2.0%
Air-quality risk 2/10 · Minimal
- Unhealthy air days now
- 1 days/yr
- Unhealthy air days in 30 yrs
- 2 days/yr
Risk factors via First Street. Map © Google.
Why this score? — see what drove the C+ grade
The composite is a weighted blend of 9 inputs, each scored 0–100. Each bar is that input's sub-score; the figure is the points it added to the 100-point composite (weight × sub-score).
- Cash flow +24.9/30.0
- 1% rule +10.0/10.0
- DSCR +8.1/10.0
- ARV discount +7.5/15.0
- Livability +4.0/5.0
- Rent growth +3.7/5.0
- Condition / age +2.5/5.0
- Schools +1.7/10.0
- Appreciation +0.0/10.0
$76,900
🖨 Deal sheet 📄 Offer letter ✓ Due diligence
Listing remarks MLS
Unit #6 is a well maintained 2 bed, 2 bath unit on 2nd floor. Updated kitchen in 2015, appliances stay, cabinets with lazy Susan's, new countertop, and new bamboo flooring! Master suite has own full bath with lots of storage space. Stackable washer and dryer addition possible. Additional storage 8x10 storage in basement with #6 parking space. Small pets are allowed. HOA fees include lawn care, water, sewer, and garbage. Enjoy maintenance free quiet, living conveniently located on west side of Springfield in a safe neighborhood! $1,000 carpet allowance at closing.
Key facts
- Sliding glass doors
- Freshly painted
- Garage
Tags
Property features AI
Finance
- HOA & community: HOA covers grounds maintenance, assigned storage, trash, and utilities
Exterior
- Parking: Underground parking garage; 1-car garage
- Utilities: Public water; Public sewer
- Home design: Single family residence; 1 entry level; 1 story (listed as 2 stories total elsewhere)
- Construction: Shingle roof; Built in 1972
- Exterior features: Irregular lot shape; Other lot features
Interior
- Kitchen: Dishwasher; Microwave; Refrigerator
- Bedrooms: 2 bedrooms (main level)
- Flooring: Laminate flooring (bedrooms, living areas); Other flooring in kitchen
- Bathrooms: 2 full bathrooms
- Heating & cooling: Forced air heating; Central air conditioning
- Interior features: Ceiling fan(s)
Neighborhood map
What this means for you Summary
Snapshot
- This is a 2-bed/2.0-bath condo listed at $77k.
Deal economics
- At list price, monthly cash flow is $166 ($2k/yr) — positive.
- The deal already cash-flows at list — no discount required.
- Meets the 1% rule at list price ($1k rent vs $77k).
- Recommended offer: $75k (3.0% below list) — sets the bar for market timing.
- Cap rate 8.9% vs local median 4.9% in Springfield — top-decile yield for the area; either an underpriced asset or a hidden risk that comps aren't pricing in. Stress-test before assuming the spread holds.
Location & tenants
- Location reads 79/100 on livability (#122 in IL, #2,138 nationally) — a middle-class / working-renter tenant base. Strengths: amenities A+, commute A+, cost of living A+; Watch: schools D+, crime F.
- Springfield SD 186 (urban): math 17% / reading 22% proficiency, ranked #438 of 620 in IL (top 71%) — low school quality limits family demand, transient renter base, plan for 1-2y turnover; 64% free/reduced lunch — lower-income household profile, screen leases tightly.
- Market conditions: Rents rising fast (+5.0%/yr); 131 active listings in the ZIP; 10 comparable units currently listed for rent nearby; rentals lingering (median 44d on market — plan ~5-8 weeks vacancy on turnover, expect pricing pressure); 50% of comp listings sitting > 30 days — soft ceiling on asking rent; 225 units permitted in Sangamon County in 2024 (48 in 5+ unit buildings).
Forward outlook
- Local home prices are declining (-3.0%/yr); year-one equity from $532 of loan paydown is wiped out by about $2k of value loss. Plan a longer hold.
- Sangamon County population projected to shrink 9% by 2050 — rents likely to lag national; underwrite the cash flow, not the appreciation.
- At projected returns (-3.0% appreciation + 5.0% rent growth), your $22k cash investment doubles in ~9 years — after that, you're playing with house money.
Negotiation context
- It's been on market 41 days — a 3% lower offer ($75k) is reasonable based on typical stale-listing flexibility.
- 2 sale attempts since 5y ago with the ask held roughly flat each time — persistent listings suggest the price (not the market) is what's stuck; bring a comps-based counter.
- Current owner paid $48k; list at $77k implies a 60% gain — meaningful room to come down on a strong offer.
Questions for the listing agent
- It's been on market 41 days. Have you received any prior offers? Is the seller open to a 3% concession, seller financing, or rate buy-down credit?
- Built in 1972 — when were the roof, HVAC, electrical panel, plumbing, and water heater last replaced?
- What does the HOA fee cover, when was the last increase, and are there any pending special assessments or reserve-fund shortfalls?
- Any open or pending special assessments — roof, HVAC, plumbing, elevator, façade? What's the per-unit balance and payoff schedule, and is the seller paying it off at close or rolling it to the buyer?
- Is there a deadline driving the sale (1031 exchange, divorce, estate, relocation)? That informs how much negotiation room exists.
- Schools are D-rated, which usually means shorter tenancies and higher turnover. Who's the typical renter profile here, and what's been the actual vacancy rate?
- Crime grade is F in this area — have there been break-ins, vandalism, or insurance claims at this property in the last 3 years? What carrier currently insures it and at what premium?
- What's the average days-on-market for RENTAL listings here right now (not sales)? A rising rental-DOM trend means longer vacancies and softer asking-rent achievability than the comps imply.
- What's the recent tenant-quality profile in this submarket — average credit score on applications, eviction rate, late-payment / NSF rate, and stable-employment percentage? A property-management company in the area should have these aggregated.
- How much new apartment / multifamily construction is in the pipeline within 1–3 miles? Heavy new supply (>2% of stock underway) typically softens rents 12–24 months out; light construction supports rent growth.
Investment metrics
- 1% rule
- 1.55% ✓
- Cap rate
- 8.88%
- Cash-on-cash
- 9.25%
- DSCR
- 1.41
- GRM
- 5.4
CMA / ARV
No comps found within radius.
Projected returns pro-forma
-3.0% appreciation · 4.95% rent growth · sell at horizon
- IRR
- 0.8%
- Equity multiple
- 1.03×
- Total profit
- $650
- Equity at exit
- $11,466
- IRR
- 13.0%
- Equity multiple
- 2.16×
- Total profit
- $25,004
- Equity at exit
- $6,649
Cash invested: $21,532 (down + closing). Projections, not guarantees.
Landlord ↔ Tenant lean methodology
- Overall (STATE)
- 43 Moderately Tenant-Leaning
- State Illinois
- 43 Moderately Tenant-Leaning · D+7
- County
- — inherits STATE
- City
- — inherits STATE
ZIP-level market 62702
- Home prices YoY
- -34.9%
- Rents YoY
- 5.0%
- Active inventory
- 131
- Price-to-rent
- 5.4×
Monthly cashflow live
- Estimated rent
- $1,189 high interval (Pro) →
- Mortgage (P&I)
- −$403
- Tax from tax record
- −$134 /mo · $1,608/yr
- Insurance
- −$32
- HOA est. from 2 same-building comps
- −$204
- Vacancy / Maint / Mgmt
- −$250
- Net cashflow
- $166
Break-even live
UW: 25.0% down · 7.5% · 30yr · 1.5% tax · 5.0% vac · 8.0% maint · 8.0% mgmt
Financing live
Cash to close
- Down payment
- $19,225
- Closing costs
- $2,307
- Reserves months
- —
- Total cash needed
- —
Loan-product check · same deal, 3 products live
Conventional
25% down · 7.5% · 30yr
- Down + closing
- —
- Monthly P&I
- —
- Monthly cashflow
- —
- DSCR
- —
- Eligible?
- —
Personal DTI + credit; lowest rate.
DSCR
20% down · 8.5% · 30yr
- Down + closing
- —
- Monthly P&I
- —
- Monthly cashflow
- —
- DSCR
- —
- Eligible?
- —
No personal income docs; deal must DSCR.
Hard money
10% down · 12.0% · 12mo
- Down + closing
- —
- Monthly P&I
- —
- Monthly cashflow
- —
- DSCR
- —
- Eligible?
- —
Short-term bridge; refi at stabilization.
Rent comps 10 comps
| Address | Beds | Baths | Sqft | Rent | $/sqft | DOM | Units | Dist |
|---|---|---|---|---|---|---|---|---|
| 1644 W Adams St Unit 1 Springfield, IL | 2.0 | 1.0 | 950 | $1,200 | $1.26 | 43d | 1 | 0.37mi |
| 1539 W Monroe St Springfield, IL | 2.0 | 1.0 | 820 | $2,000 | $2.44 | 21d | 1 | 0.49mi |
| 300 N Park Ave Springfield, IL | 1.0–2.0 | 1.0 | 694 | $1,035 | $1.49 | 21d | 1 | 0.64mi |
| 216 N Lincoln Ave Springfield, IL | 2.0 | 1.0 | 800 | $1,200 | $1.50 | 43d | 1 | 0.76mi |
| 424 S Durkin Dr Springfield, IL | 2.0 | 1.0 | 885 | $925 | $1.05 | 21d | 1 | 1.03mi |
| 203 N Glenwood Ave Springfield, IL | 2.0 | 1.0 | 850 | $1,000 | $1.18 | 21d | 1 | 1.15mi |
| 924 Clocktower Dr Unit 4 Springfield, IL | 1.0 | 1.0 | 1000 | $800 | $0.80 | 43d | 1 | 1.26mi |
| 629 W Washington St Unit 4 Springfield, IL | 2.0 | 1.0 | 700 | $800 | $1.14 | 43d | 1 | 1.31mi |
| 550 W Miller St Springfield, IL | 1.0 | 1.0 | 590 | $995 | $1.69 | 21d | 1 | 1.32mi |
| 616 New St Springfield, IL | 1.0 | 1.0 | 550 | $850 | $1.55 | 43d | 1 | 1.48mi |
HOA detail condo
- Monthly dues
- $0 · $0/yr
- Likely covers
- watersewertrashlandscaping
- Assessments
- None detected in remarks — confirm with the listing agent.
Listing history 5 events
-
2026-04-21historical Under Contract
-
2026-04-16$76,900 Active
-
2021-12-23soldstatus $48,000
-
2021-12-21soldstatus $48,000 569-char remark
Show marketing remark (569 chars)
Unit #6 is a well maintained 2 bed, 2 bath unit on 2nd floor. Updated kitchen in 2015, appliances stay, cabinets with lazy Susan's, new countertop, and new bamboo flooring! Master suite has own full bath with lots of storage space. Stackable washer and dryer addition possible. Additional storage 8x10 storage in basement with #6 parking space. Small pets are allowed. HOA fees include lawn care, water, sewer, and garbage. Enjoy maintenance free quiet, living conveniently located on west side of Springfield in a safe neighborhood! $1,000 carpet allowance at closing.
-
2021-04-30$48,600 569-char remark
Show marketing remark (569 chars)
Unit #6 is a well maintained 2 bed, 2 bath unit on 2nd floor. Updated kitchen in 2015, appliances stay, cabinets with lazy Susan's, new countertop, and new bamboo flooring! Master suite has own full bath with lots of storage space. Stackable washer and dryer addition possible. Additional storage 8x10 storage in basement with #6 parking space. Small pets are allowed. HOA fees include lawn care, water, sewer, and garbage. Enjoy maintenance free quiet, living conveniently located on west side of Springfield in a safe neighborhood! $1,000 carpet allowance at closing.
ⓘ Source: listings_history table (triggers on properties + properties_extension) + one-shot
backfill from property_details.listing_events for pre-trigger history.
Tax reassessment forecast IL · Partial reset (capped growth)
- Current annual tax
- $1,608 · $134/mo
- Projected year-2 tax
- $1,677 · $140/mo
- Expected delta
- +$69/yr (+$6/mo · 4.3%)
ⓘ Screening estimate from a state-policy table — verify with the county assessor before closing.
Climate risk First Street
- Flood 1/10 Low FEMA zone X (unshaded) · 0% chance over 30 yrs
- Wildfire 1/10 Low
- Heat 4/10 Moderate 7 d/yr ≥105°F today · 20 d/yr by 30 yrs out
- Wind 2/10 Low 2% chance of damaging wind over 30 yrs
- Air quality 2/10 Low 1 unhealthy d/yr today · 2 by 30 yrs out
Nearby sold comps map
Loading sold comps map…
Walkable amenities ~0.75 mi
Loading nearby amenities…
Taxation est. · year 1
- Rental income
- $14,266
- − Mortgage interest
- −$4,308
- − Property taxes
- −$1,608
- − Insurance
- −$384
- − Repairs & maintenance
- −$1,141
- − Management
- −$1,141
- − HOA
- −$2,448
- − Depreciation
- −$2,237
- Taxable income
- $999
- Est. tax owed @ 24.0%
- −$240
- After-tax cash flow
- $1,751/yr
For passive investors: Depreciation is non-cash, so a rental often shows a tax loss while cash-flowing — sheltering income. Rental losses are passive: they offset passive income freely, and up to $25,000/yr can offset ordinary (W-2) income if you actively participate and your MAGI is under $100k (phasing out to $0 by $150k); unused losses carry forward. On sale, claimed depreciation is recaptured at up to 25%, and gains may owe capital-gains tax (a 1031 exchange can defer both). Figures are a year-1 estimate at your 24.0% rate — not tax advice; consult a CPA.
Schools (NCES district)
- District
- Springfield SD 186
- NCES district ID
- 1737080
- Math proficiency
- 17% ▼ -7.00%
- Reading proficiency
- 22% ▼ -5.00%
- Median HH income
- $43,744
- Composite
- 16.89/100
- National rank
- #9142
- State rank
- #438 of 620 in IL
Livability — Springfield
- Score
- 79/100
- State rank
- #122
- US rank
- #2138
Category grades
Schools grade is shown separately in the Schools card above.
Census & demographics
- Census place
- Springfield, IL
- County
- Sangamon County · 115,414 people
- City population
- 59,955
- Metro
- Springfield, IL
- Population (ZIP)
- 31,033
- Household income
- $51,136
- Rent vs Own
- Severe rent burden
- 1230.0
Population outlook (Sangamon County) Hauer SSP2
- Today (2025)
- 198,317 people
- By 2030
- 196,127 · -1.1%
- By 2040
- 188,664 · -4.9%
- By 2050
- 179,624 · -9.4%
- By 2075
- 155,027 · -21.8%
- By 2100
- 122,588 · -38.2%
Race, ethnicity, and origin ACS 2023
- Neighborhood character
- Predominantly White (72%)
- Race & ethnicity
- White 72% Black 17% Two or more races 8% Hispanic / Latino 3%
- Common ancestry
- Romanian 2% Slovak 2% Serbian 1%
- Foreign-born
- 2% · Canada
- Languages at home
- 96% English-only · Spanish 1% French/Haitian/Cajun 1% Other Indo-European 1%
Political lean MEDSL · Sangamon
- 2024 margin
- Toss-up / Even · D 46.6% · R 51.6% · Other 1.8%
- 2008→2024 swing
- -9.3pp toward R · 2008: 4.4pp · 2024: -5.0pp
- All cycles
- 2024: R+5.0 2020: R+4.4 2016: R+9.4 2012: R+8.7 2008: D+4.4
Not yet ingested
- Civics
- —
Market trends
- HPI YoY
- ▼ -79.98%
- Current HPI
- 149.1926
- Rent YoY
- ▲ 4.95%
- Metro
- Springfield, IL
- State GDP YoY
- ▲ 1.59%
- F500 in state
- 60
Industry mix (Fortune 500 HQ in IL)
| Industry | F500 HQs | Revenue |
|---|---|---|
| Insurance | 4 | $201B |
|
||
| Consumer Goods | 4 | $87B |
|
||
| Industrial Machinery | 3 | $64B |
|
||
| Healthcare | 2 | $55B |
|
||
| Retail / Pharmacy | 1 | $148B |
|
||
| Agriculture / Food | 1 | $86B |
|
||
Price history
+58.2% since first listed5 events — show timeline
- 2026-04-21 Contingent — RMLSA as Distributed by MLS Grid
- 2026-04-16 Listed $76,900 RMLSA as Distributed by MLS Grid
- 2021-12-23 Sold (Public Records) $48,000 Public Records
- 2021-12-21 Sold (MLS) $48,000 RMLSA as Distributed by MLS Grid
- 2021-04-30 Listed $48,600 RMLSA as Distributed by MLS Grid
Property tax history
+11.4%/yrLatest (2024): $1,608 · +4.0% YoY. Source: county tax records.
Cash-flow waterfall
monthlySold comps — $/sqft
last 12 mo · ≤1 miLoading sold comps…