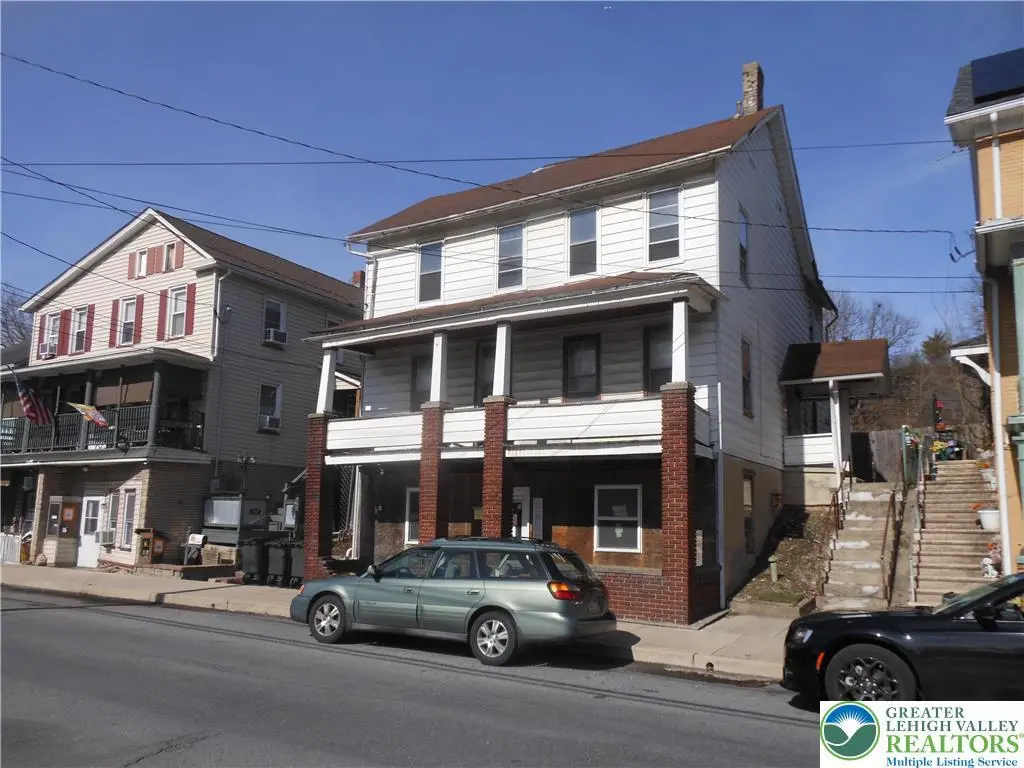
111 N Main St · Bangor, PA
Flood risk 7/10 · Major
- FEMA flood zone
- X (unshaded)
- Chance of flooding over 30 yrs
- 0.97%
- Est. flood insurance / yr
- $473 – $860
Fire risk 1/10 · Minimal
- Est. fire insurance / yr
- $511 – $949
Heat risk 4/10 · Minor
- Hot days now (above 96°F)
- 7 days/yr
- Hot days in 30 yrs
- 15 days/yr
Wind risk 4/10 · Minor
- Chance of severe wind over 30 yrs
- 13.0%
Air-quality risk 2/10 · Minimal
- Unhealthy air days now
- 1 days/yr
- Unhealthy air days in 30 yrs
- 3 days/yr
Risk factors via First Street. Map © Google.
Why this score? — see what drove the B grade
The composite is a weighted blend of 9 inputs, each scored 0–100. Each bar is that input's sub-score; the figure is the points it added to the 100-point composite (weight × sub-score).
- Cash flow +30.0/30.0
- 1% rule +10.0/10.0
- DSCR +10.0/10.0
- ARV discount +7.5/15.0
- Schools +4.8/10.0
- Livability +3.4/5.0
- Rent growth +2.5/5.0
- Condition / age +2.5/5.0
- Appreciation +0.0/10.0
$104,000
🖨 Deal sheet 📄 Offer letter ✓ Due diligence
Listing remarks MLS
MULTIPLE OFFERS RECEIVED property is under H & B with a current due date of 4/21/2026 11:59:00 PM Mountain Time. . SOLD AS IS. ENTER WITH FLASHLIGHT AND CAUTION. .SPACIOUS DUPLEX ZONED 2-4 FAMILY WITH POSSIBLE COMMERCIAL USE, 1ST . 2ND 3RD FLOORS PARTIALLY GUTTED WITH HEATING SYSTEM REMOVED. 2 FULL BATHS. SPACIOUS ROOM SIZES . A BLANK SLATE FOR THOSE WHO DESIRE A MARKET RENTAL INCOME FROM A RENOVATED INVESTMENT UNIT IN A HIGHLY EASILY RENTED MARKET OF BANGOR. NO PREVIOUS PERFORMA DATA AVAILABLE. .
Key facts
- Zoned 2-4 family
- Spacious duplex
- Partially gutted
Tags
Neighborhood map
What this means for you Summary
Snapshot
- This is a 4-bed/2.0-bath other listed at $104k.
Deal economics
- At list price, monthly cash flow is $603 ($7k/yr) — positive.
- The deal already cash-flows at list — no discount required.
- Meets the 1% rule at list price ($2k rent vs $104k).
- Recommended offer: $101k (3.0% below list) — sets the bar for market timing.
- Cap rate 13.9% vs local median 4.2% in Bangor — top-decile yield for the area; either an underpriced asset or a hidden risk that comps aren't pricing in. Stress-test before assuming the spread holds.
Location & tenants
- Location reads 68/100 on livability (#886 in PA) — a middle-class / working-renter tenant base. Strengths: cost of living A+, housing A+; Watch: employment C-, health & safety D, amenities F.
- Bangor Area SD (rural): math 50% / reading 60% proficiency, ranked #107 of 539 in PA (top 20%) — acceptable for families but not a draw, mixed tenant base, ~2y average lease.
- Market conditions: 76 active listings in the ZIP; solid renter incomes; 567 units permitted in Northampton County in 2024 (151 in 5+ unit buildings).
Forward outlook
- Local home prices are declining (-3.0%/yr); year-one equity from $719 of loan paydown is wiped out by about $3k of value loss. Plan a longer hold.
- At projected returns (-3.0% appreciation + 3.0% rent growth), your $29k cash investment doubles in ~5 years — after that, you're playing with house money.
Negotiation context
- It's been on market 41 days — a 3% lower offer ($101k) is reasonable based on typical stale-listing flexibility.
- 5 sale attempts since 24y ago with the ask held roughly flat each time — persistent listings suggest the price (not the market) is what's stuck; bring a comps-based counter.
Risks & watch-outs
- Watch-outs: property tax is 3.5% of price; flood insurance adds $56/mo; built in 1900 — expect roof / HVAC / electrical / plumbing capex.
- Climate carrying-cost: major flood risk — expect insurance premiums to compound above CPI over the hold.
Questions for the listing agent
- It's been on market 41 days. Have you received any prior offers? Is the seller open to a 3% concession, seller financing, or rate buy-down credit?
- Built in 1900 — when were the roof, HVAC, electrical panel, plumbing, and water heater last replaced?
- Property tax is high relative to price — has the assessment been appealed recently, and will the sale trigger a re-assessment?
- What's the actual annual flood-insurance premium (NFIP or private), and is the property in a SFHA with mandatory coverage?
- Is there a deadline driving the sale (1031 exchange, divorce, estate, relocation)? That informs how much negotiation room exists.
- What's the average days-on-market for RENTAL listings here right now (not sales)? A rising rental-DOM trend means longer vacancies and softer asking-rent achievability than the comps imply.
- What's the recent tenant-quality profile in this submarket — average credit score on applications, eviction rate, late-payment / NSF rate, and stable-employment percentage? A property-management company in the area should have these aggregated.
- How much new for-sale + rental construction is in the pipeline within 1–3 miles? Heavy new supply typically softens prices + rents 12–24 months out; constrained supply supports both.
Investment metrics
- 1% rule
- 1.89% ✓
- Cap rate
- 13.90%
- Cash-on-cash
- 27.16%
- DSCR
- 2.21
- GRM
- 4.4
CMA / ARV
- ARV (median comp)
- $281,473
- List price
- $104,000
- Delta
- -63.05%
- Verdict
- UNDERPRICED
- Comps
- 17 within 1.0 mi
Projected returns pro-forma
-3.0% appreciation · 3.0% rent growth · sell at horizon
- IRR
- 18.4%
- Equity multiple
- 1.75×
- Total profit
- $21,753
- Equity at exit
- $15,507
- IRR
- 26.9%
- Equity multiple
- 3.37×
- Total profit
- $69,130
- Equity at exit
- $8,992
Cash invested: $29,120 (down + closing). Projections, not guarantees.
Landlord ↔ Tenant lean methodology
- Overall (STATE)
- 62 Landlord-Friendly
- State Pennsylvania
- 62 Landlord-Friendly · EVEN
- County
- — inherits STATE
- City
- — inherits STATE
ZIP-level market 18013
- Active inventory
- 76
- Price-to-rent
- 4.4×
Monthly cashflow live
- Estimated rent
- $1,966 medium interval (Pro) →
- Mortgage (P&I)
- −$545
- Tax from tax record
- −$306 /mo · $3,669/yr
- Insurance
- −$43
- Flood insurance flood zone
- −$56 /mo · $666/yr
- HOA
- −$0
- Vacancy / Maint / Mgmt
- −$413
- Net cashflow
- $603
Break-even live
UW: 25.0% down · 7.5% · 30yr · 1.5% tax · 5.0% vac · 8.0% maint · 8.0% mgmt
Financing live
Cash to close
- Down payment
- $26,000
- Closing costs
- $3,120
- Reserves months
- —
- Total cash needed
- —
Loan-product check · same deal, 3 products live
Conventional
25% down · 7.5% · 30yr
- Down + closing
- —
- Monthly P&I
- —
- Monthly cashflow
- —
- DSCR
- —
- Eligible?
- —
Personal DTI + credit; lowest rate.
DSCR
20% down · 8.5% · 30yr
- Down + closing
- —
- Monthly P&I
- —
- Monthly cashflow
- —
- DSCR
- —
- Eligible?
- —
No personal income docs; deal must DSCR.
Hard money
10% down · 12.0% · 12mo
- Down + closing
- —
- Monthly P&I
- —
- Monthly cashflow
- —
- DSCR
- —
- Eligible?
- —
Short-term bridge; refi at stabilization.
Listing history 11 events
-
2026-05-04status Pending 695-char remark
Show marketing remark (695 chars)
MULTIPLE OFFERS RECEIVED property is under H & B with a current due date of 4/21/2026 11:59:00 PM Mountain Time. . SOLD AS IS. ENTER WITH FLASHLIGHT AND CAUTION. .SPACIOUS DUPLEX ZONED 2-4 FAMILY WITH POSSIBLE COMMERCIAL USE, 1ST . 2ND 3RD FLOORS PARTIALLY GUTTED WITH HEATING SYSTEM REMOVED. 2 FULL BATHS. SPACIOUS ROOM SIZES . A BLANK SLATE FOR THOSE WHO DESIRE A MARKET RENTAL INCOME FROM A RENOVATED INVESTMENT UNIT IN A HIGHLY EASILY RENTED MARKET OF BANGOR. NO PREVIOUS PERFORMA DATA AVAILABLE. .
-
2026-03-24$104,000 Active 695-char remark
Show marketing remark (695 chars)
MULTIPLE OFFERS RECEIVED property is under H & B with a current due date of 4/21/2026 11:59:00 PM Mountain Time. . SOLD AS IS. ENTER WITH FLASHLIGHT AND CAUTION. .SPACIOUS DUPLEX ZONED 2-4 FAMILY WITH POSSIBLE COMMERCIAL USE, 1ST . 2ND 3RD FLOORS PARTIALLY GUTTED WITH HEATING SYSTEM REMOVED. 2 FULL BATHS. SPACIOUS ROOM SIZES . A BLANK SLATE FOR THOSE WHO DESIRE A MARKET RENTAL INCOME FROM A RENOVATED INVESTMENT UNIT IN A HIGHLY EASILY RENTED MARKET OF BANGOR. NO PREVIOUS PERFORMA DATA AVAILABLE. .
-
2025-06-03historical
-
2025-03-15$149,900 Active
-
2017-03-07historical
-
2016-09-08$169,900 Active
-
2003-04-21soldstatus $95,400
-
2003-04-15soldstatus $95,400
-
2003-04-15soldstatus $95,400
-
2002-10-04$98,642
-
2002-10-02$98,642
ⓘ Source: listings_history table (triggers on properties + properties_extension) + one-shot
backfill from property_details.listing_events for pre-trigger history.
Tax reassessment forecast PA · Partial reset (capped growth)
- Current annual tax
- $3,669 · $306/mo
- Projected year-2 tax
- $3,669 · $306/mo
- Expected delta
- $0/yr ($0/mo · 0.0%)
ⓘ Screening estimate from a state-policy table — verify with the county assessor before closing.
Climate risk First Street
- Flood 7/10 Severe FEMA zone X (unshaded) · 97% chance over 30 yrs
- Wildfire 1/10 Low
- Heat 4/10 Moderate 7 d/yr ≥96°F today · 15 d/yr by 30 yrs out
- Wind 4/10 Moderate 13% chance of damaging wind over 30 yrs
- Air quality 2/10 Low 1 unhealthy d/yr today · 3 by 30 yrs out
Nearby sold comps map
Loading sold comps map…
Walkable amenities ~0.75 mi
Loading nearby amenities…
Taxation est. · year 1
- Rental income
- $23,597
- − Mortgage interest
- −$5,826
- − Property taxes
- −$3,669
- − Insurance
- −$1,186
- − Repairs & maintenance
- −$1,888
- − Management
- −$1,888
- − Depreciation
- −$3,025
- Taxable income
- $6,115
- Est. tax owed @ 24.0%
- −$1,468
- After-tax cash flow
- $5,774/yr
For passive investors: Depreciation is non-cash, so a rental often shows a tax loss while cash-flowing — sheltering income. Rental losses are passive: they offset passive income freely, and up to $25,000/yr can offset ordinary (W-2) income if you actively participate and your MAGI is under $100k (phasing out to $0 by $150k); unused losses carry forward. On sale, claimed depreciation is recaptured at up to 25%, and gains may owe capital-gains tax (a 1031 exchange can defer both). Figures are a year-1 estimate at your 24.0% rate — not tax advice; consult a CPA.
Schools (NCES district)
- District
- Bangor Area SD
- NCES district ID
- 4203000
- Math proficiency
- 50% ▲ 1.00%
- Reading proficiency
- 60% ▼ -5.00%
- Median HH income
- $57,818
- Composite
- 47.64/100
- National rank
- #2250
- State rank
- #107 of 539 in PA
Livability — Bangor
- Score
- 68/100
- State rank
- #886
- US rank
- #9437
Category grades
Schools grade is shown separately in the Schools card above.
Census & demographics
- Census place
- Bangor, PA
- County
- Northampton County · 236,814 people
- City population
- 17,597
- Metro
- Allentown-Bethlehem-Easton, PA-NJ
- Population (ZIP)
- 17,597
- Household income
- $78,847
- Rent vs Own
- Severe rent burden
- 346.0
Population outlook (Northampton County) Hauer SSP2
- Today (2025)
- 312,227 people
- By 2030
- 314,769 · +0.8%
- By 2040
- 316,914 · +1.5%
- By 2050
- 318,037 · +1.9%
- By 2075
- 334,003 · +7.0%
- By 2100
- 344,696 · +10.4%
Race, ethnicity, and origin ACS 2023
- Neighborhood character
- Predominantly White (89%)
- Race & ethnicity
- White 89% Hispanic / Latino 7% Two or more races 4% Black 1%
- Hispanic origin (detail)
- Mexican 1% Puerto Rican 2%
- Common ancestry
- Romanian 3% Iranian 2% Lithuanian 2%
- Foreign-born
- 3% · Canada, China
- Languages at home
- 95% English-only · Spanish 3% Other Indo-European 1% French/Haitian/Cajun 1%
Political lean MEDSL · Northampton
- 2024 margin
- Toss-up / Even · D 48.6% · R 50.4%
- 2008→2024 swing
- -14.1pp toward R · 2008: 12.3pp · 2024: -1.8pp
- All cycles
- 2024: R+1.8 2020: D+0.7 2016: R+3.8 2012: D+4.6 2008: D+12.3
Not yet ingested
- Civics
- —
Market trends
- HPI YoY
- ▼ -158.33%
- Current HPI
- 191.8044
- Rent YoY
- —
- Metro
- Allentown-Bethlehem-Easton, PA-NJ
- State GDP YoY
- ▲ 1.68%
- F500 in state
- 34
Industry mix (Fortune 500 HQ in PA)
| Industry | F500 HQs | Revenue |
|---|---|---|
| Healthcare | 2 | $309B |
|
||
| Insurance | 2 | $27B |
|
||
| Telecommunications / Media | 1 | $124B |
|
||
| Industrial Distribution | 1 | $22B |
|
||
| Financial Services | 1 | $20B |
|
||
| Chemicals / Materials | 1 | $18B |
|
||
Price history
+5.4% since first listed11 events — show timeline
- 2026-05-04 Pending — GLVRMLS
- 2026-03-24 Listed $104,000 GLVRMLS
- 2025-06-03 Listing Removed — GLVRMLS
- 2025-03-15 Listed $149,900 GLVRMLS
- 2017-03-07 Listing Removed — GLVRMLS
- 2016-09-08 Listed $169,900 GLVRMLS
- 2003-04-21 Sold (Public Records) $95,400 Public Records
- 2003-04-15 Sold (MLS) $95,400 PMAR
- 2003-04-15 Sold (MLS) $95,400 GLVRMLS
- 2002-10-04 Listed $98,642 PMAR
- 2002-10-02 Listed $98,642 GLVRMLS
Property tax history
+1.1%/yrLatest (2026): $3,669 · +0.6% YoY. Source: county tax records.
Cash-flow waterfall
monthlySold comps — $/sqft
last 12 mo · ≤1 miLoading sold comps…