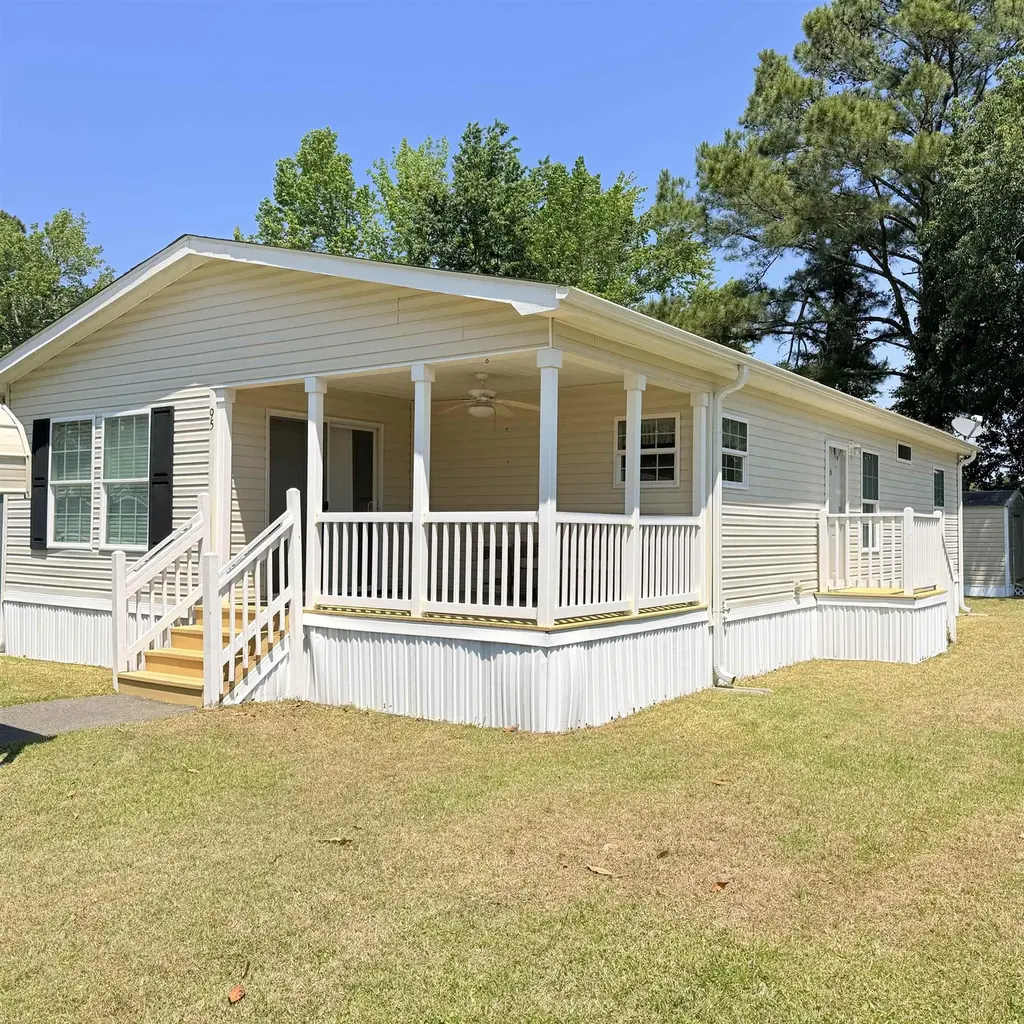
95 Crooked Island Cir · Murrells Inlet, SC
Flood risk 1/10 · Minimal
- FEMA flood zone
- X (unshaded)
- Chance of flooding over 30 yrs
- 0.0%
- Est. flood insurance / yr
- $507 – $1,088
Fire risk 4/10 · Minor
- Est. fire insurance / yr
- $783 – $1,453
Heat risk 9/10 · Severe
- Hot days now (above 106°F)
- 7 days/yr
- Hot days in 30 yrs
- 18 days/yr
Wind risk 9/10 · Severe
- Chance of severe wind over 30 yrs
- 99.0%
Air-quality risk 2/10 · Minimal
- Unhealthy air days now
- 0 days/yr
- Unhealthy air days in 30 yrs
- 1 days/yr
Risk factors via First Street. Map © Google.
Why this score? — see what drove the C+ grade
The composite is a weighted blend of 9 inputs, each scored 0–100. Each bar is that input's sub-score; the figure is the points it added to the 100-point composite (weight × sub-score).
- Cash flow +30.0/30.0
- DSCR +10.0/10.0
- 1% rule +9.5/10.0
- Livability +3.8/5.0
- Rent growth +3.7/5.0
- ARV discount +2.7/15.0
- Schools +2.7/10.0
- Condition / age +2.5/5.0
- Appreciation +0.0/10.0
$94,900
🖨 Deal sheet (PDF) 📄 Offer letter ✓ Due diligence
Listing remarks
Welcome to Paradise! This beautiful 2013 Destiny home is in pristine condition and move-in ready. The single owner home is waiting for you! This home offers plenty of room, walk in to a Florida room that opens into an Open concept floor plan. Center Island kitchen with all the appliances. .Big master suite with ceramic tile walk-in shower! This home has plenty of upgrades with 8 foot ceilings, crown moldings, base moldings, insulation and windows have all been upgraded! The home is energy efficient! Big shed out back for storage and your golf cart. Oceanside Landing is in a great location 5 minutes to Huntington Beach State Park and Brook Green Gardens, 10 minutes to the famous Murrells Inl
Key facts
- Big shed
- Florida room
- Energy efficient
Tags
Property features AI
Finance
- Financial info: Has land lease: $900 monthly; Offered for sale
- HOA & community: Monthly association fee
Exterior
- Parking: Driveway; 2 parking spaces (total)
- Home design: Double wide mobile home; Resale property
- Construction: Vinyl siding
- Exterior features: Residential zoning; Located on leased land (monthly land lease)
Interior
- Kitchen: Kitchen island; Walk-in pantry; Dishwasher; Microwave; Range; Refrigerator
- Bedrooms: Primary bedroom with separate shower
- Flooring: Carpet; Vinyl
- Bathrooms: 2 full bathrooms
- Heating & cooling: Central heating; Central air conditioning
- Interior features: Furnished; Ceiling fans throughout; Separate shower; Kitchen island
- Laundry & utility: Washer; Dryer
Neighborhood map
What this means for you Summary
Snapshot
- This is a 2-bed/2.0-bath manufactured listed at $95k.
Deal economics
- At list price, monthly cash flow is $432 ($5k/yr) — positive.
- The deal already cash-flows at list — no discount required.
- Meets the 1% rule at list price ($1k rent vs $95k).
- Recommended offer: $92k (3.0% below list) — sets the bar for market timing.
- Cap rate 11.7% vs local median 2.2% in Murrells Inlet — top-decile yield for the area; either an underpriced asset or a hidden risk that comps aren't pricing in. Stress-test before assuming the spread holds.
Location & tenants
- Location reads 76/100 on livability (#25 in SC, #3,720 nationally) — a middle-class / working-renter tenant base. Strengths: crime A+, housing A+, health & safety A+; Watch: amenities F, commute F.
- Georgetown 01 (town): math 26% / reading 38% proficiency, ranked #51 of 80 in SC (top 64%) — families likely to look elsewhere, expect single-tenant / working-renter base with shorter leases.
- Zoned schools: Waccamaw Elementary (math 67% / reading 62%, grade B, #56 of 597 statewide, top 10%, 519 students, 100% FRL); Waccamaw Intermediate (math 53% / reading 56%, grade B-, #24 of 229 statewide, top 11%, 420 students, 43% FRL); Waccamaw High (math 42% / reading 93%, grade B, #72 of 196 statewide, top 36%, 858 students, 35% FRL) — zoned schools at 59% FRL track the district average.
- Zoned-school proficiency averages 62% at this address vs 32% district-wide (+30 pts) — the actual schools serving this property are materially stronger than the Georgetown 01 average implies; a family-tenant draw the district grade alone would hide.
- Market conditions: Rents rising fast (+4.7%/yr); 290 active listings in the ZIP; 8 comparable units currently listed for rent nearby; rentals at typical pace (median 26d on market — plan ~3-4 weeks tenant-placement turnaround); 323 units permitted in Georgetown County in 2024 (0 in 5+ unit buildings).
Forward outlook
- Local home prices are declining (-3.0%/yr); year-one equity from $656 of loan paydown is wiped out by about $3k of value loss. Plan a longer hold.
- At projected returns (-3.0% appreciation + 4.7% rent growth), your $27k cash investment doubles in ~6 years — after that, you're playing with house money.
Negotiation context
- It's been on market 58 days — a 3% lower offer ($92k) is reasonable based on typical stale-listing flexibility.
- 2 sale attempts since 16y ago with the ask held roughly flat each time — persistent listings suggest the price (not the market) is what's stuck; bring a comps-based counter.
- Current owner paid $12k; list at $95k implies a 691% gain — meaningful room to come down on a strong offer.
Risks & watch-outs
- Climate carrying-cost: severe wind risk, 99% chance of damaging wind over 30y; extreme-heat days projected 7→18/yr by 2055 (HVAC capex compounding) — expect insurance premiums to compound above CPI over the hold.
Questions for the listing agent
- It's been on market 58 days. Have you received any prior offers? Is the seller open to a 3% concession, seller financing, or rate buy-down credit?
- Is there a deadline driving the sale (1031 exchange, divorce, estate, relocation)? That informs how much negotiation room exists.
- Schools are A-rated — typically a magnet for longer-tenancy family renters. What's the average tenant stay here, and is there a school-zone premium baked into asking?
- What's the average days-on-market for RENTAL listings here right now (not sales)? A rising rental-DOM trend means longer vacancies and softer asking-rent achievability than the comps imply.
- What's the recent tenant-quality profile in this submarket — average credit score on applications, eviction rate, late-payment / NSF rate, and stable-employment percentage? A property-management company in the area should have these aggregated.
- How much new for-sale + rental construction is in the pipeline within 1–3 miles? Heavy new supply typically softens prices + rents 12–24 months out; constrained supply supports both.
Investment metrics
- 1% rule
- 1.45% ✓
- Cap rate
- 11.75%
- Cash-on-cash
- 19.49%
- DSCR
- 1.87
- GRM
- 5.7
CMA / ARV
- ARV (on-the-fly)
- $85,800
- Comps found
- 12
Show comp detail 12 sales within ~0.75 mi
| Address | Dist | Beds/Ba | Sqft | Sold | Price | $/sf | Match |
|---|---|---|---|---|---|---|---|
| 100 Crooked Island Cir | 0.03mi | 3/2.0 (+1) | 1,344 (+2%) | 1mo | $40,000 | $30 | 90 |
| 22 Crooked Island Cir | 0.03mi | 3/2.0 (+1) | 1,431 (+8%) | 0mo | $65,000 | $45 | 79 |
| 8 Buccaneer St | 0.10mi | 3/2.0 (+1) | 1,400 (+6%) | 2mo | $59,000 | $42 | 79 |
| 163 Crooked Island Cir | 0.24mi | 3/2.0 (+1) | 1,344 (+2%) | 3mo | $75,000 | $56 | 78 |
| 59 Crooked Island Cir | 0.19mi | 3/2.0 (+1) | 1,300 (-2%) | 6mo | $85,000 | $65 | 78 |
| 835 South Marlin Cir | 0.26mi | 3/2.0 (+1) | 1,238 (-6%) | 6mo | $155,000 | $125 | 68 |
| 106 Inlet Oaks Village Ct | 0.53mi | 3/2.0 (+1) | 1,357 (+3%) | 8mo | $95,000 | $70 | 59 |
| 43 Ravenel Ct | 0.66mi | 2/2.0 | 1,260 (-4%) | 6mo | $54,900 | $44 | 56 |
| 983 Live Oak South Marlin Cir | 0.20mi | 3/2.0 (+1) | 1,500 (+14%) | 8mo | $278,000 | $185 | 56 |
| 121 Burr Cir | 0.66mi | 2/1.5 | 1,250 (-5%) | 9mo | $15,000 | $12 | 51 |
| 103 Village Ct | 0.55mi | 3/2.0 (+1) | 1,194 (-10%) | 9mo | $92,000 | $77 | 46 |
| 10 Acorn Ct | 0.50mi | 2/2.0 | 1,130 (-14%) | 8mo | $75,000 | $66 | 46 |
Match score weights: distance 35% · size 25% · config 20% · recency 20%. Top-matched comps best support the ARV.
Projected returns pro-forma
-3.0% appreciation · 4.66% rent growth · sell at horizon
- IRR
- 13.4%
- Equity multiple
- 1.54×
- Total profit
- $14,463
- Equity at exit
- $14,150
- IRR
- 23.5%
- Equity multiple
- 3.18×
- Total profit
- $57,987
- Equity at exit
- $8,205
Cash invested: $26,572 (down + closing). Projections, not guarantees.
Landlord ↔ Tenant lean methodology
- Overall (STATE)
- 90 Strongly Landlord-Friendly
- State South Carolina
- 90 Strongly Landlord-Friendly · R+6
- County
- — inherits STATE
- City
- — inherits STATE
ZIP-level market 29576
- Home prices YoY
- -18.8%
- Rents YoY
- 4.7%
- Active inventory
- 290
- Price-to-rent
- 5.7×
Monthly cashflow live
- Estimated rent
- $1,376 high interval (Pro) →
- Mortgage (P&I)
- −$498
- Tax est. 1.5%
- −$119 /mo · $1,424/yr
- Insurance
- −$40
- HOA
- −$0
- Lot rent leased land?
- −$0
- Vacancy / Maint / Mgmt
- −$289
- Net cashflow
- $432
Break-even live
Sensitivity live
| Price | -10% $497 | -5% $464 | +0% $432 | +5% $399 | +10% $366 |
|---|---|---|---|---|---|
| Rent | -10% $323 | -5% $377 | +0% $432 | +5% $486 | +10% $540 |
| Rate | -1.0pp $479 | -0.5pp $456 | base $432 | +0.5pp $407 | +1.0pp $382 |
UW: 25.0% down · 7.5% · 30yr · 1.5% tax · 5.0% vac · 8.0% maint · 8.0% mgmt
Financing live
Cash to close
- Down payment
- $23,725
- Closing costs
- $2,847
- Reserves months
- —
- Total cash needed
- —
Loan-product check · same deal, 3 products live
Conventional
25% down · 7.5% · 30yr
- Down + closing
- —
- Monthly P&I
- —
- Monthly cashflow
- —
- DSCR
- —
- Eligible?
- —
Personal DTI + credit; lowest rate.
DSCR
20% down · 8.5% · 30yr
- Down + closing
- —
- Monthly P&I
- —
- Monthly cashflow
- —
- DSCR
- —
- Eligible?
- —
No personal income docs; deal must DSCR.
Hard money
10% down · 12.0% · 12mo
- Down + closing
- —
- Monthly P&I
- —
- Monthly cashflow
- —
- DSCR
- —
- Eligible?
- —
Short-term bridge; refi at stabilization.
Rent comps 8 comps
| Address | Beds | Baths | Sqft | Rent | $/sqft | DOM | Units | Dist |
|---|---|---|---|---|---|---|---|---|
| 4996 Highway 17 Business Murrells Inlet, SC | 2.0 | 2.0 | 925 | $1,500 | $1.62 | 16d | 1 | 0.42mi |
| 13 Muddy Bay Dr Murrells Inlet, SC | 2.0–3.0 | 2.0 | 1095 | $1,801 | $1.64 | 16d | 13 | 0.66mi |
| 50 Turning Stone Boulelvard Murrells Inlet, SC | 3.0 | 2.0 | 1350 | $1,750 | $1.30 | 25d | 1 | 0.75mi |
| 66 Turning Stone Boulelvard Unit 1 Murrells Inlet, SC | 3.0 | 2.0 | 1350 | $1,595 | $1.18 | 25d | 1 | 0.76mi |
| 66 Turning Stone Blvd Murrells Inlet, SC | 3.0 | 2.0 | 1450 | $1,700 | $1.17 | 25d | 1 | 0.78mi |
| 4323 Lotus Ct Unit F Murrells Inlet, SC | 3.0 | 2.0 | 1319 | $1,750 | $1.33 | 25d | 1 | 1.19mi |
| 4384 Daphne Ln Murrells Inlet, SC | 3.0 | 2.0 | 1450 | $1,950 | $1.34 | 23d | 1 | 1.39mi |
| 4376 Crepe Myrtle Ct Murrells Inlet, SC | 3.0 | 2.0 | 1500 | $1,850 | $1.23 | 25d | 1 | 1.48mi |
Listing history 18 events
-
2026-06-22days on market $94,900 Active 58 DOM
-
2026-06-18days on market $94,900 Active 55 DOM
-
2026-06-17days on market $94,900 Active 54 DOM
-
2026-06-16days on market $94,900 Active 53 DOM
-
2026-06-15days on market $94,900 Active 52 DOM
-
2026-06-14days on market $94,900 Active 50 DOM
-
2026-06-10days on market $94,900 Active 47 DOM
-
2026-06-09days on market $94,900 Active 46 DOM
-
2026-06-08days on market $94,900 Active 45 DOM
-
2026-06-07days on market $94,900 Active 44 DOM
-
2026-06-03days on market $94,900 Active 40 DOM
-
2026-06-02days on market $94,900 Active 39 DOM
-
2026-06-01days on market $94,900 Active 38 DOM
-
2026-05-31days on market $94,900 Active 37 DOM
-
2026-05-30days on market $94,900 Active 36 DOM
-
2026-04-24$94,900 Active
-
2011-04-15soldstatus $12,000
-
2010-09-23$15,900
ⓘ Source: listings_history table (triggers on properties + properties_extension) + one-shot
backfill from property_details.listing_events for pre-trigger history.
Climate risk First Street
- Flood 1/10 Low FEMA zone X (unshaded) · 0% chance over 30 yrs
- Wildfire 4/10 Moderate
- Heat 9/10 Extreme 7 d/yr ≥106°F today · 18 d/yr by 30 yrs out
- Wind 9/10 Extreme 99% chance of damaging wind over 30 yrs
- Air quality 2/10 Low 0 unhealthy d/yr today · 1 by 30 yrs out
Nearby sold comps map
Loading sold comps map…
Walkable amenities ~0.75 mi
Loading nearby amenities…
Taxation est. · year 1
- Rental income
- $16,517
- − Mortgage interest
- −$5,316
- − Property taxes
- −$1,424
- − Insurance
- −$474
- − Repairs & maintenance
- −$1,321
- − Management
- −$1,321
- − Depreciation
- −$2,761
- Taxable income
- $3,899
- Est. tax owed @ 24.0%
- −$936
- After-tax cash flow
- $4,242/yr
For passive investors: Depreciation is non-cash, so a rental often shows a tax loss while cash-flowing — sheltering income. Rental losses are passive: they offset passive income freely, and up to $25,000/yr can offset ordinary (W-2) income if you actively participate and your MAGI is under $100k (phasing out to $0 by $150k); unused losses carry forward. On sale, claimed depreciation is recaptured at up to 25%, and gains may owe capital-gains tax (a 1031 exchange can defer both). Figures are a year-1 estimate at your 24.0% rate — not tax advice; consult a CPA.
Schools (NCES district)
- District
- Georgetown 01
- NCES district ID
- 4502280
- Math proficiency
- 26% ▼ -11.00%
- Reading proficiency
- 38% ▼ -5.00%
- Median HH income
- $43,045
- Composite
- 27.15/100
- National rank
- #7030
- State rank
- #51 of 80 in SC
Livability — Murrells Inlet
- Score
- 76/100
- State rank
- #25
- US rank
- #3720
Category grades
Schools grade is shown separately in the Schools card above.
Census & demographics
- Census place
- Murrells Inlet, SC
- County
- Horry County · 356,152 people
- City population
- 34,695
- Metro
- Myrtle Beach-Conway-North Myrtle Beach, SC-NC
- Population (ZIP)
- 34,695
- Household income
- $70,691
- Rent vs Own
- Severe rent burden
- 309.0
Population outlook (Georgetown County) Hauer SSP2
- Today (2025)
- 63,275 people
- By 2030
- 63,630 · +0.6%
- By 2040
- 63,130 · -0.2%
- By 2050
- 61,904 · -2.2%
- By 2075
- 59,305 · -6.3%
- By 2100
- 53,852 · -14.9%
Race, ethnicity, and origin ACS 2023
- Neighborhood character
- Predominantly White (89%)
- Race & ethnicity
- White 89% Hispanic / Latino 4% Black 3% Two or more races 3% Asian 2%
- Common ancestry
- Romanian 4% Slovak 3% Serbian 2%
- Foreign-born
- 5% · Canada, China, Vietnam
- Languages at home
- 96% English-only · Spanish 2% Chinese 1%
Political lean MEDSL · Georgetown
- 2024 margin
- R (+19.5) · D 39.6% · R 59.1% · Other 1.2%
- 2008→2024 swing
- -14.2pp toward R · 2008: -5.2pp · 2024: -19.5pp
- All cycles
- 2024: R+19.5 2020: R+12.7 2016: R+13.0 2012: R+7.6 2008: R+5.2
Not yet ingested
- Civics
- —
Market trends
- HPI YoY
- ▼ -57.53%
- Current HPI
- 248.5102
- Rent YoY
- ▲ 4.66%
- Metro
- Myrtle Beach-Conway-North Myrtle Beach, SC-NC
- State GDP YoY
- ▲ 4.51%
- F500 in state
- 2
Industry mix (Fortune 500 HQ in SC)
| Industry | F500 HQs | Revenue |
|---|---|---|
| Packaging | 1 | $7B |
|
||
Price history
+496.9% since first listed3 events — show timeline
- 2026-04-24 Listed $94,900 CCAR
- 2011-04-15 Sold (MLS) $12,000 CCAR
- 2010-09-23 Listed $15,900 CCAR
Cash-flow waterfall
monthlySold comps — $/sqft
last 12 mo · ≤1 miLoading sold comps…