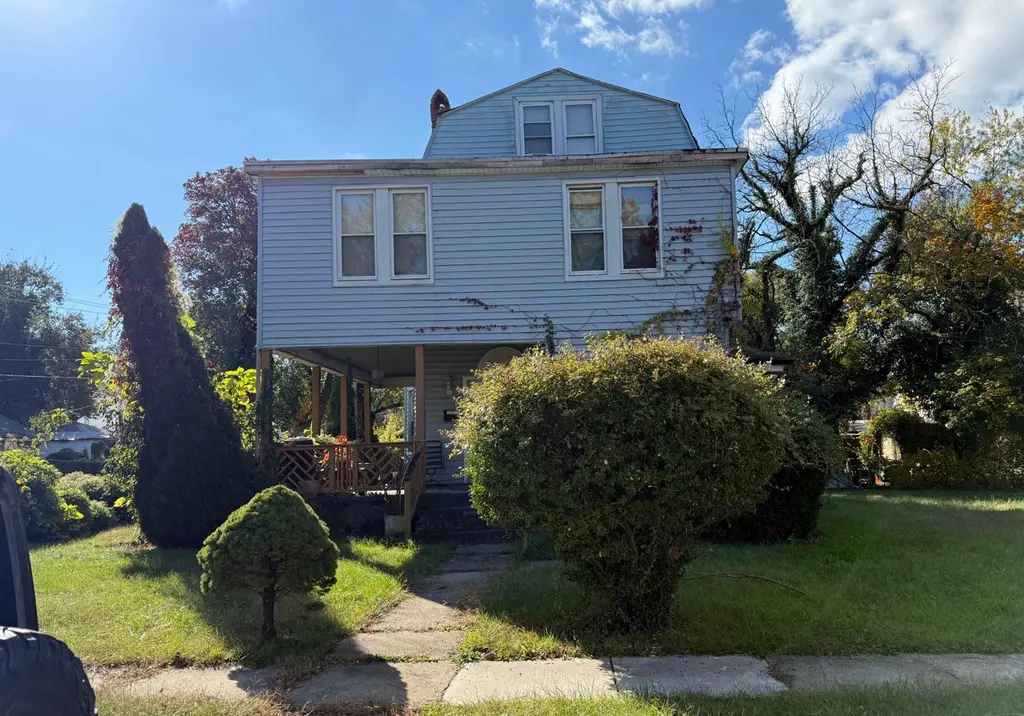
None · Baltimore, MD
Flood risk 1/10 · Minimal
- FEMA flood zone
- X (unshaded)
- Chance of flooding over 30 yrs
- 0.0%
- Est. flood insurance / yr
- $473 – $860
Fire risk 1/10 · Minimal
- Est. fire insurance / yr
- $755 – $1,403
Heat risk 6/10 · Moderate
- Hot days now (above 103°F)
- 7 days/yr
- Hot days in 30 yrs
- 15 days/yr
Wind risk 5/10 · Moderate
- Chance of severe wind over 30 yrs
- 23.0%
Air-quality risk 3/10 · Minor
- Unhealthy air days now
- 3 days/yr
- Unhealthy air days in 30 yrs
- 4 days/yr
Risk factors via First Street. Map © Google.
Why this score? — see what drove the D+ grade
The composite is a weighted blend of 9 inputs, each scored 0–100. Each bar is that input's sub-score; the figure is the points it added to the 100-point composite (weight × sub-score).
- ARV discount +15.0/15.0
- Cash flow +13.6/30.0
- 1% rule +4.3/10.0
- DSCR +4.1/10.0
- Livability +3.8/5.0
- Rent growth +3.1/5.0
- Condition / age +2.5/5.0
- Schools +1.0/10.0
- Appreciation +0.0/10.0
$180,000
🖨 Deal sheet (PDF) 📄 Offer letter ✓ Due diligence
Key facts
- 0.34 acre lot
- 3 parking spots
- Built 1920
Property features AI
Finance
- Other: Above-grade finished area listed as 2,492 (assessor); Total below-grade area reported as 0; Land and improvement assessment values reported (financial details excluded per instructions)
- Financial info: Ownership: Fee simple
Exterior
- Parking: Driveway parking (3 spaces total)
- Utilities: Public water; Public sewer; 60+ gallon hot water tank
- Home design: Detached property; Main entrance faces northwest; Building not winterized; Below average property condition; Estimated year built with major remodel in 1998
- Construction: Aluminum siding, brick, and frame construction; Composite roof; Concrete perimeter foundation
- Exterior features: Deck(s); Porch(es); Corner lot/unit; Not in a federal flood zone; Accessible switches and outlets
Interior
- Kitchen: Kitchen (details not specified)
- Bedrooms: Three bedrooms on the upper level
- Flooring: Hardwood
- Bathrooms: One full bathroom
- Heating & cooling: Radiator heating; Ceiling fans for cooling; Electric heating fuel
- Interior features: Second kitchen; Attic; Ceiling fans; Dining area; Traditional floor plan; Wood floors; Connecting stairway to basement
- Laundry & utility: Not furnished (no specific laundry appliances listed)
Neighborhood map
What this means for you Summary
Snapshot
- This is a 3-bed/2.0-bath single-family listed at $180k.
Deal economics
- At list price, monthly cash flow is $9 ($113/yr) — positive.
- The deal already cash-flows at list — no discount required.
- To meet the 1% rule (rent ≥ 1% of price), the offer needs to be $168k (6.5% below list).
- Recommended offer: $168k (6.5% below list) — sets the bar for 1% rule.
Location & tenants
- Location reads 76/100 on livability (#90 in MD, #3,396 nationally) — a middle-class / working-renter tenant base. Strengths: amenities A+, commute A+, housing A+; Watch: crime F.
- Baltimore City Public Schools (urban): math 7% / reading 16% proficiency, ranked #24 of 24 in MD (top 100%) — low school quality limits family demand, transient renter base, plan for 1-2y turnover; 79% free/reduced lunch — lower-income household profile, screen leases tightly.
- Zoned schools: Elmer A. Henderson: A Johns Hopkins Partnership (math 2% / reading 16%, grade F, #650 of 860 statewide, top 77%, 642 students, 80% FRL); Baltimore Polytechnic Institute (math 71% / reading 84%, grade A-, #22 of 222 statewide, top 10%, 1,555 students, 43% FRL) — zoned schools average 62% FRL vs 79% district-wide (17 pts lower); this property's tenant base skews higher-income than the district average.
- Zoned-school proficiency averages 43% at this address vs 12% district-wide (+32 pts) — the actual schools serving this property are materially stronger than the Baltimore City Public Schools average implies; a family-tenant draw the district grade alone would hide.
- Market conditions: Rents rising (+2.4%/yr); 354 active listings in the ZIP; 8 comparable units currently listed for rent nearby; rentals at typical pace (median 26d on market — plan ~3-4 weeks tenant-placement turnaround); 1,273 units permitted in Baltimore city in 2024 (1,104 in 5+ unit buildings).
- This rent runs 39% of the median local income ($52k/yr) — at the standard rent-burdened threshold; future hikes will face affordability resistance.
Forward outlook
- Local home prices are declining (-3.0%/yr); year-one equity from $1k of loan paydown is wiped out by about $5k of value loss. Plan a longer hold.
- Baltimore County population projected to shrink 4% by 2050 — rents likely to lag national; underwrite the cash flow, not the appreciation.
Negotiation context
- It's been on market 58 days — a 3% lower offer ($175k) is reasonable based on typical stale-listing flexibility.
- Current owner paid $32k; list at $180k implies a 467% gain — meaningful room to come down on a strong offer.
Risks & watch-outs
- Watch-outs: built in 1920 — expect roof / HVAC / electrical / plumbing capex.
- Climate carrying-cost: moderate wind risk, 23% chance of damaging wind over 30y; extreme-heat days projected 7→15/yr by 2055 (HVAC capex compounding) — expect insurance premiums to compound above CPI over the hold.
Questions for the listing agent
- It's been on market 58 days. Have you received any prior offers? Is the seller open to a 7% concession, seller financing, or rate buy-down credit?
- Built in 1920 — when were the roof, HVAC, electrical panel, plumbing, and water heater last replaced?
- Is there a deadline driving the sale (1031 exchange, divorce, estate, relocation)? That informs how much negotiation room exists.
- Schools are D-rated, which usually means shorter tenancies and higher turnover. Who's the typical renter profile here, and what's been the actual vacancy rate?
- Crime grade is F in this area — have there been break-ins, vandalism, or insurance claims at this property in the last 3 years? What carrier currently insures it and at what premium?
- The area grade is low — what's the realistic commute time and amenity access for the typical tenant pool here? Any planned neighborhood developments (good or bad) we should know about?
- What's the average days-on-market for RENTAL listings here right now (not sales)? A rising rental-DOM trend means longer vacancies and softer asking-rent achievability than the comps imply.
- What's the recent tenant-quality profile in this submarket — average credit score on applications, eviction rate, late-payment / NSF rate, and stable-employment percentage? A property-management company in the area should have these aggregated.
- How much new for-sale + rental construction is in the pipeline within 1–3 miles? Heavy new supply typically softens prices + rents 12–24 months out; constrained supply supports both.
Investment metrics
- 1% rule
- 0.93% ✗
- Cap rate
- 6.36%
- Cash-on-cash
- 0.22%
- DSCR
- 1.01
- GRM
- 8.9
CMA / ARV
- ARV (median comp)
- $352,670
- List price
- $180,000
- Delta
- -48.96%
- Verdict
- UNDERPRICED
- Comps
- 20 within 1.0 mi
Show comp detail 10 sales within ~0.75 mi
| Address | Dist | Beds/Ba | Sqft | Sold | Price | $/sf | Match |
|---|---|---|---|---|---|---|---|
| 4211 Fernhill Ave | 0.09mi | 4/3.5 (+1) | 2,507 (+1%) | 15mo | $439,900 | $175 | 71 |
| 4115 Boarman Ave | 0.33mi | 4/3.5 (+1) | 2,504 (+0%) | 2mo | $375,000 | $150 | 71 |
| 3912 Fernhill Ave | 0.37mi | 3/2.0 | 2,324 (-7%) | 4mo | $275,000 | $118 | 68 |
| 5300 Wabash Ave | 0.28mi | 3/2.5 | 2,240 (-10%) | 9mo | $317,500 | $142 | 61 |
| 4900 Haddon Ave | 0.53mi | 4/3.5 (+1) | 2,470 (-1%) | 6mo | $425,000 | $172 | 58 |
| 3807 Fernhill Ave | 0.54mi | 4/3.0 (+1) | 2,432 (-2%) | 9mo | $329,900 | $136 | 54 |
| 3809 N Rogers Ave | 0.65mi | 4/3.0 (+1) | 2,412 (-3%) | 5mo | $330,000 | $137 | 51 |
| 3812 Milford Ave | 0.42mi | 4/3.5 (+1) | 2,280 (-8%) | 7mo | $460,000 | $202 | 49 |
| 5601 Groveland Ave | 0.61mi | 3/2.5 | 2,118 (-15%) | 6mo | $335,000 | $158 | 40 |
| 3723 Milford Ave | 0.51mi | 4/3.0 (+1) | 2,280 (-8%) | 16mo | $342,000 | $150 | 39 |
Match score weights: distance 35% · size 25% · config 20% · recency 20%. Top-matched comps best support the ARV.
Projected returns pro-forma
-3.0% appreciation · 2.41% rent growth · sell at horizon
- IRR
- -16.6%
- Equity multiple
- 0.41×
- Total profit
- $-29,488
- Equity at exit
- $26,839
- IRR
- -9.5%
- Equity multiple
- 0.43×
- Total profit
- $-28,639
- Equity at exit
- $15,563
Cash invested: $50,400 (down + closing). Projections, not guarantees.
Landlord ↔ Tenant lean methodology
- Overall (CITY)
- 12 Strongly Tenant-Friendly
- State Maryland
- 27 Tenant-Leaning · D+14
- County
- — inherits STATE
- City Baltimore
- 12 Strongly Tenant-Friendly · D+58
ZIP-level market 21215
- Rents YoY
- 2.4%
- Active inventory
- 354
- Price-to-rent
- 8.9×
Monthly cashflow live
- Estimated rent
- $1,683 high interval (Pro) →
- Mortgage (P&I)
- −$944
- Tax from tax record
- −$301 /mo · $3,611/yr
- Insurance
- −$75
- HOA
- −$0
- Vacancy / Maint / Mgmt
- −$353
- Net cashflow
- $9
Break-even live
Sensitivity live
| Price | -10% $111 | -5% $60 | +0% $9 | +5% $-42 | +10% $-92 |
|---|---|---|---|---|---|
| Rent | -10% $-124 | -5% $-57 | +0% $9 | +5% $76 | +10% $142 |
| Rate | -1.0pp $100 | -0.5pp $55 | base $9 | +0.5pp $-37 | +1.0pp $-85 |
UW: 25.0% down · 7.5% · 30yr · 1.5% tax · 5.0% vac · 8.0% maint · 8.0% mgmt
Financing live
Cash to close
- Down payment
- $45,000
- Closing costs
- $5,400
- Reserves months
- —
- Total cash needed
- —
Loan-product check · same deal, 3 products live
Conventional
25% down · 7.5% · 30yr
- Down + closing
- —
- Monthly P&I
- —
- Monthly cashflow
- —
- DSCR
- —
- Eligible?
- —
Personal DTI + credit; lowest rate.
DSCR
20% down · 8.5% · 30yr
- Down + closing
- —
- Monthly P&I
- —
- Monthly cashflow
- —
- DSCR
- —
- Eligible?
- —
No personal income docs; deal must DSCR.
Hard money
10% down · 12.0% · 12mo
- Down + closing
- —
- Monthly P&I
- —
- Monthly cashflow
- —
- DSCR
- —
- Eligible?
- —
Short-term bridge; refi at stabilization.
Rent comps 8 comps
| Address | Beds | Baths | Sqft | Rent | $/sqft | DOM | Units | Dist |
|---|---|---|---|---|---|---|---|---|
| 3914 Maine Ave Unit 3 Baltimore, MD | 2.0 | 1.0 | 2127 | $1,150 | $0.54 | 45d | 1 | 0.81mi |
| 5807 Gist Ave Baltimore, MD | 2.0 | 1.5 | 2100 | $1,395 | $0.66 | 25d | 1 | 1.01mi |
| 4704 Pimlico Rd Baltimore, MD | 3.0 | 1.5 | 2006 | $1,800 | $0.90 | 25d | 1 | 1.25mi |
| 3411 Fairview Ave Baltimore, MD | 2.0 | 1.0 | 2949 | $1,600 | $0.54 | 19d | 1 | 1.34mi |
| 3213 Dorchester Rd Baltimore, MD | 2.0 | 1.0 | 2640 | $1,850 | $0.70 | 25d | 1 | 1.36mi |
| 3204 Sequoia Ave Baltimore, MD | 4.0 | 2.5 | 1791 | $2,600 | $1.45 | 45d | 1 | 1.38mi |
| 3709 Fords Ln Baltimore, MD | 4.0 | 3.5 | 2248 | $3,000 | $1.33 | 0d | 1 | 1.44mi |
| 2805 Oakley Ave Baltimore, MD | 2.0 | 1.0 | 2400 | $1,500 | $0.62 | 16d | 1 | 1.47mi |
Listing history 16 events
-
2026-06-21days on market $180,000 Active 58 DOM
-
2026-06-18days on market $180,000 Active 55 DOM
-
2026-06-17days on market $180,000 Active 54 DOM
-
2026-06-16days on market $180,000 Active 53 DOM
-
2026-06-15days on market $180,000 Active 52 DOM
-
2026-06-13days on market $180,000 Active 50 DOM
-
2026-06-09days on market $180,000 Active 46 DOM
-
2026-06-08days on market $180,000 Active 45 DOM
-
2026-06-07days on market $180,000 Active 44 DOM
-
2026-06-04days on market $180,000 Active 41 DOM
-
2026-06-03days on market $180,000 Active 40 DOM
-
2026-06-02days on market $180,000 Active 39 DOM
-
2026-06-01days on market $180,000 Active 38 DOM
-
2026-05-31days on market $180,000 Active 37 DOM
-
2026-04-24$180,000 Active
-
1983-05-12soldstatus $31,750
ⓘ Source: listings_history table (triggers on properties + properties_extension) + one-shot
backfill from property_details.listing_events for pre-trigger history.
Tax reassessment forecast MD · Partial reset (capped growth)
- Current annual tax
- $3,611 · $301/mo
- Projected year-2 tax
- $3,611 · $301/mo
- Expected delta
- $0/yr ($0/mo · 0.0%)
ⓘ Screening estimate from a state-policy table — verify with the county assessor before closing.
Climate risk First Street
- Flood 1/10 Low FEMA zone X (unshaded) · 0% chance over 30 yrs
- Wildfire 1/10 Low
- Heat 6/10 Major 7 d/yr ≥103°F today · 15 d/yr by 30 yrs out
- Wind 5/10 Major 23% chance of damaging wind over 30 yrs
- Air quality 3/10 Moderate 3 unhealthy d/yr today · 4 by 30 yrs out
Nearby sold comps map
Loading sold comps map…
Walkable amenities ~0.75 mi
Loading nearby amenities…
Taxation est. · year 1
- Rental income
- $20,192
- − Mortgage interest
- −$10,083
- − Property taxes
- −$3,611
- − Insurance
- −$900
- − Repairs & maintenance
- −$1,615
- − Management
- −$1,615
- − Depreciation
- −$5,236
- Taxable loss
- −$2,869
- Est. tax savings @ 24.0%
- +$689
- After-tax cash flow
- $802/yr
For passive investors: Depreciation is non-cash, so a rental often shows a tax loss while cash-flowing — sheltering income. Rental losses are passive: they offset passive income freely, and up to $25,000/yr can offset ordinary (W-2) income if you actively participate and your MAGI is under $100k (phasing out to $0 by $150k); unused losses carry forward. On sale, claimed depreciation is recaptured at up to 25%, and gains may owe capital-gains tax (a 1031 exchange can defer both). Figures are a year-1 estimate at your 24.0% rate — not tax advice; consult a CPA.
Schools (NCES district)
- District
- Baltimore City Public Schools
- NCES district ID
- 2400090
- Math proficiency
- 7% ▼ -9.00%
- Reading proficiency
- 16% ▼ -5.00%
- Median HH income
- $42,108
- Composite
- 10.08/100
- National rank
- #9805
- State rank
- #24 of 24 in MD
Livability — Baltimore
- Score
- 76/100
- State rank
- #90
- US rank
- #3396
Category grades
Schools grade is shown separately in the Schools card above.
Census & demographics
- Census place
- Baltimore, MD
- County
- Baltimore City · 558,601 people
- City population
- 588,727
- Metro
- Baltimore-Columbia-Towson, MD
- Population (ZIP)
- 52,229
- Household income
- $51,587
- Rent vs Own
- Severe rent burden
- 3644.0
Population outlook (Baltimore County) Hauer SSP2
- Today (2025)
- 624,249 people
- By 2030
- 621,541 · -0.4%
- By 2040
- 609,756 · -2.3%
- By 2050
- 597,249 · -4.3%
- By 2075
- 552,236 · -11.5%
- By 2100
- 513,934 · -17.7%
Race, ethnicity, and origin ACS 2023
- Neighborhood character
- Predominantly Black (73%)
- Race & ethnicity
- Black 73% White 17% Hispanic / Latino 5% Two or more races 4% Asian 1%
- Common ancestry
- Scotch-Irish 2% Romanian 2% Italian 1%
- Foreign-born
- 9% · Canada, South Korea
- Languages at home
- 91% English-only · Spanish 4% French/Haitian/Cajun 1% Other Indo-European 1%
Political lean MEDSL · Baltimore
- 2024 margin
- Solid D (+73.0) · D 85.2% · R 12.2% · Other 2.6%
- 2008→2024 swing
- -2.5pp toward R · 2008: 75.5pp · 2024: 73.0pp
- All cycles
- 2024: D+73.0 2020: D+76.6 2016: D+74.6 2012: D+76.4 2008: D+75.5
Not yet ingested
- Civics
- —
Market trends
- HPI YoY
- ▼ -318.58%
- Current HPI
- 291.4926
- Rent YoY
- ▲ 2.41%
- Metro
- Baltimore-Columbia-Towson, MD
- State GDP YoY
- ▲ 2.97%
- F500 in state
- 12
Industry mix (Fortune 500 HQ in MD)
| Industry | F500 HQs | Revenue |
|---|---|---|
| Aerospace / Defense | 1 | $71B |
|
||
| Utilities | 1 | $25B |
|
||
| Hotels | 1 | $24B |
|
||
| Consumer Goods | 1 | $7B |
|
||
| Real Estate | 1 | $6B |
|
||
| Chemicals | 1 | $2B |
|
||
Price history
+466.9% since first listed2 events — show timeline
- 2026-04-24 Listed $180,000 BRIGHT MLS
- 1983-05-12 Sold (Public Records) $31,750 Public Records
Property tax history
-0.3%/yrLatest (2025): $3,611 · +2.9% YoY. Source: county tax records.
Cash-flow waterfall
monthlySold comps — $/sqft
last 12 mo · ≤1 miLoading sold comps…