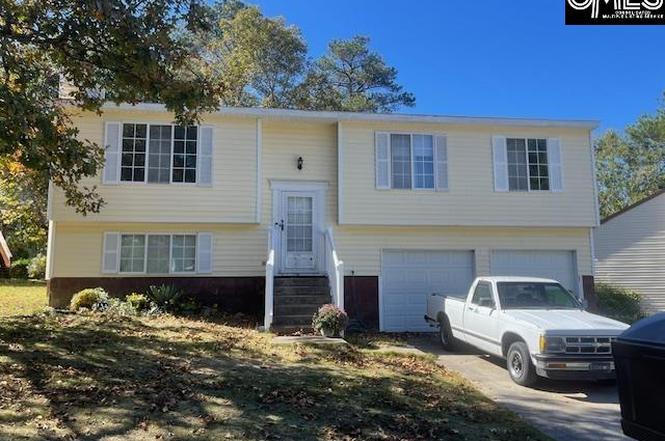
121 Foxglove Cir · Columbia, SC
Flood risk 1/10 · Minimal
- FEMA flood zone
- X
- Chance of flooding over 30 yrs
- 0.0%
- Est. flood insurance / yr
- $435 – $905
Fire risk 2/10 · Minimal
- Est. fire insurance / yr
- $783 – $1,453
Heat risk 6/10 · Moderate
- Hot days now (above threshold)
- 7 days/yr
- Hot days in 30 yrs
- 16 days/yr
Wind risk No data
- Chance of severe wind over 30 yrs
- —
Air-quality risk No data
- Unhealthy air days now
- —
- Unhealthy air days in 30 yrs
- —
Risk factors via First Street. Map © Google.
Why this score? — see what drove the D- grade
The composite is a weighted blend of 9 inputs, each scored 0–100. Each bar is that input's sub-score; the figure is the points it added to the 100-point composite (weight × sub-score).
- Cash flow +9.3/30.0
- ARV discount +7.5/15.0
- Appreciation +5.0/10.0
- Schools +4.5/10.0
- Livability +3.9/5.0
- DSCR +2.6/10.0
- Rent growth +2.5/5.0
- Condition / age +2.5/5.0
- 1% rule +1.8/10.0
$249,900
🖨 Deal sheet 📄 Offer letter ✓ Due diligence
Listing remarks
MUST SEE THIS HOME JUST RE DONE RENOVATION NEW FLOOR ( LAMINATE AND NEW CARPET HOUSE AND NEW PAINTS) BASEMENT HAS FRMILY ROOM WITH FIRE PLACE AND DOUBLE GRAGE , BASEMENT AND 1/2 BATH ROOM : Family still working on repair but I put in market today 01/15/2026 any question? contact to listing agent. Disclaimer: CMLS has not reviewed and, therefore, does not endorse vendors who may appear in listings.
Key facts
- New carpet
- Fire place
- Double garage
Tags
Neighborhood map
What this means for you Summary
Snapshot
- This is a 3-bed/2.0-bath single-family listed at $250k.
Deal economics
- At list price, monthly cash flow is $-183 ($-2k/yr) — negative.
- To cash-flow at today's rent, offer at most $218k (12.9% below list).
- To meet the 1% rule (rent ≥ 1% of price), the offer needs to be $170k (32.0% below list).
- Recommended offer: $170k (32.0% below list) — sets the bar for 1% rule.
Location & tenants
- Location reads 78/100 on livability (#18 in SC, #2,436 nationally) — a middle-class / working-renter tenant base. Strengths: amenities A+, commute A+, cost of living A+; Watch: employment D, crime F.
- Lexington 05 (suburban): math 47% / reading 55% proficiency, ranked #5 of 80 in SC (top 6%) — acceptable for families but not a draw, mixed tenant base, ~2y average lease.
- Zoned schools: Harbison West Elementary (math 45% / reading 43%, grade F, #239 of 597 statewide, top 41%, 550 students, 100% FRL); Irmo High (math 27% / reading 82%, grade C-, #130 of 196 statewide, top 69%, 1,307 students, 100% FRL) — zoned schools average 100% FRL vs 27% district-wide (73 pts higher); higher-poverty schools than district average — tighter screening recommended.
- Market conditions: 1 active listings in the ZIP; 14 comparable units currently listed for rent nearby; rentals at typical pace (median 14d on market — plan ~3-4 weeks tenant-placement turnaround); 3,472 units permitted in Richland County in 2024 (1,096 in 5+ unit buildings).
Forward outlook
- In year one you build about $9k of equity ($2k loan paydown + $7k appreciation (3.0% local appreciation)).
- Richland County population projected at +30% by 2050 — long-run rental-demand tailwind backs the buy-and-hold thesis.
- By year 4, paydown + projected appreciation supports a ~$31k cash-out refi (75% LTV) — recoverable capital for the next deal without selling this one.
Negotiation context
- It's been on market 74 days — a 6% lower offer ($235k) is reasonable based on typical stale-listing flexibility.
- 2 sale attempts with the ask held roughly flat each time — persistent listings suggest the price (not the market) is what's stuck; bring a comps-based counter.
- Current owner paid $63k; list at $250k implies a 298% gain — meaningful room to come down on a strong offer.
Risks & watch-outs
- Climate carrying-cost: extreme-heat days projected 7→16/yr by 2055 (HVAC capex compounding) — expect insurance premiums to compound above CPI over the hold.
Questions for the listing agent
- What do current leases actually rent for vs. the listed asking? Can we see a recent rent roll and the last 12 months of T-12 income?
- It's been on market 74 days. Have you received any prior offers? Is the seller open to a 32% concession, seller financing, or rate buy-down credit?
- What does the HOA fee cover, when was the last increase, and are there any pending special assessments or reserve-fund shortfalls?
- Why hasn't it sold? Are there any deal-killer items the seller is aware of (foundation, flood, title, zoning, code violations)?
- Is there a deadline driving the sale (1031 exchange, divorce, estate, relocation)? That informs how much negotiation room exists.
- Schools are D-rated, which usually means shorter tenancies and higher turnover. Who's the typical renter profile here, and what's been the actual vacancy rate?
- Crime grade is F in this area — have there been break-ins, vandalism, or insurance claims at this property in the last 3 years? What carrier currently insures it and at what premium?
- The area grade is low — what's the realistic commute time and amenity access for the typical tenant pool here? Any planned neighborhood developments (good or bad) we should know about?
- What's the average days-on-market for RENTAL listings here right now (not sales)? A rising rental-DOM trend means longer vacancies and softer asking-rent achievability than the comps imply.
- What's the recent tenant-quality profile in this submarket — average credit score on applications, eviction rate, late-payment / NSF rate, and stable-employment percentage? A property-management company in the area should have these aggregated.
- How much new for-sale + rental construction is in the pipeline within 1–3 miles? Heavy new supply typically softens prices + rents 12–24 months out; constrained supply supports both.
Investment metrics
- 1% rule
- 0.68% ✗
- Cap rate
- 5.42%
- Cash-on-cash
- -3.13%
- DSCR
- 0.86
- GRM
- 12.3
CMA / ARV
No comps found within radius.
Projected returns pro-forma
3.0% appreciation · 3.0% rent growth · sell at horizon
- IRR
- 4.6%
- Equity multiple
- 1.26×
- Total profit
- $18,368
- Equity at exit
- $112,366
- IRR
- 7.7%
- Equity multiple
- 2.17×
- Total profit
- $81,603
- Equity at exit
- $173,169
Cash invested: $69,972 (down + closing). Projections, not guarantees.
Landlord ↔ Tenant lean methodology
- Overall (STATE)
- 90 Strongly Landlord-Friendly
- State South Carolina
- 90 Strongly Landlord-Friendly · R+6
- County
- — inherits STATE
- City
- — inherits STATE
ZIP-level market 29063-8606
- Active inventory
- 1
- Price-to-rent
- 12.3×
Monthly cashflow live
- Estimated rent
- $1,699 high interval (Pro) →
- Mortgage (P&I)
- −$1,311
- Tax from tax record
- −$80 /mo · $955/yr
- Insurance
- −$104
- HOA
- −$31
- Vacancy / Maint / Mgmt
- −$357
- Net cashflow
- $-183
Break-even live
UW: 25.0% down · 7.5% · 30yr · 1.5% tax · 5.0% vac · 8.0% maint · 8.0% mgmt
Financing live
Cash to close
- Down payment
- $62,475
- Closing costs
- $7,497
- Reserves months
- —
- Total cash needed
- —
Loan-product check · same deal, 3 products live
Conventional
25% down · 7.5% · 30yr
- Down + closing
- —
- Monthly P&I
- —
- Monthly cashflow
- —
- DSCR
- —
- Eligible?
- —
Personal DTI + credit; lowest rate.
DSCR
20% down · 8.5% · 30yr
- Down + closing
- —
- Monthly P&I
- —
- Monthly cashflow
- —
- DSCR
- —
- Eligible?
- —
No personal income docs; deal must DSCR.
Hard money
10% down · 12.0% · 12mo
- Down + closing
- —
- Monthly P&I
- —
- Monthly cashflow
- —
- DSCR
- —
- Eligible?
- —
Short-term bridge; refi at stabilization.
Rent comps 14 comps
| Address | Beds | Baths | Sqft | Rent | $/sqft | DOM | Units | Dist |
|---|---|---|---|---|---|---|---|---|
| 6 Forestgrove Ct Columbia, SC | 3.0 | 2.0 | 1066 | $1,599 | $1.50 | 21d | 1 | 0.08mi |
| 356 Lake Murray Blvd Irmo, SC | 1.0–3.0 | 1.0–2.0 | 1020 | $2,537 | $2.49 | 3d | 23 | 0.44mi |
| 500 Harbison Blvd Columbia, SC | 2.0–3.0 | 2.0–3.0 | 1152 | $1,849 | $1.61 | 2d | 11 | 0.47mi |
| 101 Riverwalk Way Irmo, SC | 3.0 | 2.0 | 1300 | $1,750 | $1.35 | 14d | 1 | 0.57mi |
| 100 Walden Heights Dr Irmo, SC | 1.0–3.0 | 1.0–2.0 | 1030 | $1,880 | $1.83 | 3d | 23 | 0.57mi |
| 100 Fairforest Rd Columbia, SC | 2.0 | 1.5 | 1150 | $1,224 | $1.06 | 3d | 3 | 0.75mi |
| 171 Winding Chestnut Dr Columbia, SC | 3.0 | 2.5 | 1335 | $1,975 | $1.48 | 23d | 1 | 0.85mi |
| 121 Manorwood Ct Unit C Columbia, SC | 2.0 | 1.5 | 1120 | $1,095 | $0.98 | 23d | 1 | 0.96mi |
| 113 Paces Brook Ave Columbia, SC | 1.0–3.0 | 1.0–2.0 | 929 | $1,770 | $1.91 | 11d | 12 | 1.01mi |
| 14 Heritage Village Ln Columbia, SC | 2.0 | 2.0 | 1100 | $2,150 | $1.95 | 23d | 1 | 1.02mi |
| 401 Columbiana Dr Columbia, SC | 2.0–4.0 | 1.5–2.0 | 1207 | $1,216 | $1.01 | 3d | 1 | 1.14mi |
| 13 Crossbow Pl Columbia, SC | 2.0 | 2.5 | 1250 | $1,650 | $1.32 | 14d | 1 | 1.14mi |
| 51 Heritage Village Ln Unit 1 Columbia, SC | 2.0 | 2.0 | 1150 | $1,400 | $1.22 | 23d | 1 | 1.14mi |
| 408 Foxfire Dr Columbia, SC | 1.0–3.0 | 1.0–2.0 | 1016 | $1,225 | $1.21 | 3d | 7 | 1.35mi |
HOA detail
- Monthly dues
- $31 · $372/yr
Listing history 7 events
-
2026-03-29status Pending
-
2026-03-14historical Active - Contingent
-
2026-01-16status Active
-
2025-12-29historical
-
2025-12-28$249,900 Active
-
1988-01-01soldstatus $62,750
-
1987-12-01soldstatus $13,000
ⓘ Source: listings_history table (triggers on properties + properties_extension) + one-shot
backfill from property_details.listing_events for pre-trigger history.
Tax reassessment forecast SC · Resets to sale price
- Current annual tax
- $955 · $80/mo
- Projected year-2 tax
- $1,424 · $119/mo
- Expected delta
- +$469/yr (+$39/mo · 49.2%)
ⓘ Screening estimate from a state-policy table — verify with the county assessor before closing.
Climate risk First Street
- Flood 1/10 Low FEMA zone X · 0% chance over 30 yrs
- Wildfire 2/10 Low
- Heat 6/10 Major
Nearby sold comps map
Loading sold comps map…
Walkable amenities ~0.75 mi
Loading nearby amenities…
Taxation est. · year 1
- Rental income
- $20,392
- − Mortgage interest
- −$13,998
- − Property taxes
- −$955
- − Insurance
- −$1,250
- − Repairs & maintenance
- −$1,631
- − Management
- −$1,631
- − HOA
- −$372
- − Depreciation
- −$7,270
- Taxable loss
- −$6,715
- Est. tax savings @ 24.0%
- +$1,612
- After-tax cash flow
- $-581/yr
For passive investors: Depreciation is non-cash, so a rental often shows a tax loss while cash-flowing — sheltering income. Rental losses are passive: they offset passive income freely, and up to $25,000/yr can offset ordinary (W-2) income if you actively participate and your MAGI is under $100k (phasing out to $0 by $150k); unused losses carry forward. On sale, claimed depreciation is recaptured at up to 25%, and gains may owe capital-gains tax (a 1031 exchange can defer both). Figures are a year-1 estimate at your 24.0% rate — not tax advice; consult a CPA.
Schools (NCES district)
- District
- Lexington 05
- NCES district ID
- 4502820
- Math proficiency
- 47% ▼ -7.00%
- Reading proficiency
- 55% ▼ -4.00%
- Median HH income
- $67,732
- Composite
- 45.28/100
- National rank
- #2656
- State rank
- #5 of 80 in SC
Livability — Columbia
- Score
- 78/100
- State rank
- #18
- US rank
- #2436
Category grades
Schools grade is shown separately in the Schools card above.
Census & demographics
No demographic data for this ZIP.
Market trends
- HPI YoY
- —
- Current HPI
- —
- Rent YoY
- —
- Metro
- —
- State GDP YoY
- ▲ 4.51%
- F500 in state
- 2
Industry mix (Fortune 500 HQ in SC)
| Industry | F500 HQs | Revenue |
|---|---|---|
| Packaging | 1 | $7B |
|
||
Price history
+1822.3% since first listed7 events — show timeline
- 2026-03-29 Pending — Consolidated MLS
- 2026-03-14 Contingent — Consolidated MLS
- 2026-01-16 Relisted — Consolidated MLS
- 2025-12-29 Delisted — Consolidated MLS
- 2025-12-28 Listed $249,900 Consolidated MLS
- 1988-01-01 Sold (Public Records) $62,750 Public Records
- 1987-12-01 Sold (Public Records) $13,000 Public Records
Property tax history
+2.5%/yrLatest (2025): $955 · +3.9% YoY. Source: county tax records.
Cash-flow waterfall
monthlySold comps — $/sqft
last 12 mo · ≤1 miLoading sold comps…