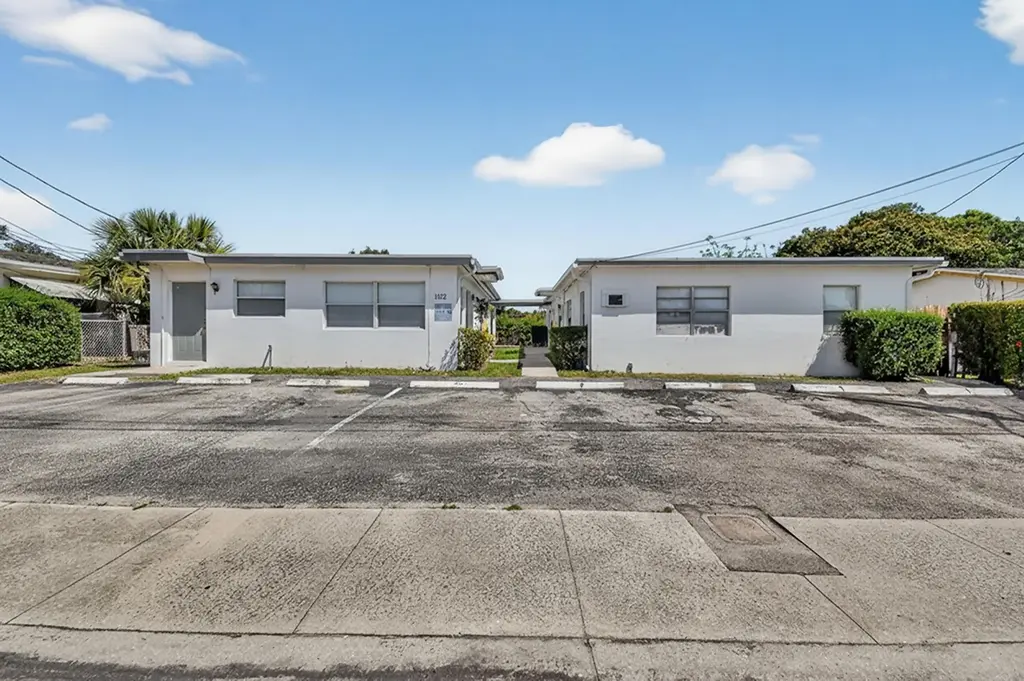
 Fourplex
1172 W 34th St #1 · Riviera Beach, FL
Flood risk 1/10 · Minimal
- FEMA flood zone
- X (unshaded)
- Chance of flooding over 30 yrs
- 0.0%
- Est. flood insurance / yr
- $507 – $1,088
Fire risk 1/10 · Minimal
- Est. fire insurance / yr
- $947 – $1,759
Heat risk 10/10 · Severe
- Hot days now (above 106°F)
- 7 days/yr
- Hot days in 30 yrs
- 24 days/yr
Wind risk 10/10 · Severe
- Chance of severe wind over 30 yrs
- 99.0%
Air-quality risk 2/10 · Minimal
- Unhealthy air days now
- 0 days/yr
- Unhealthy air days in 30 yrs
- 1 days/yr
Risk factors via First Street. Map © Google.
Why this score? — see what drove the B- grade
The composite is a weighted blend of 9 inputs, each scored 0–100. Each bar is that input's sub-score; the figure is the points it added to the 100-point composite (weight × sub-score).
- Cash flow +30.0/30.0
- DSCR +10.0/10.0
- 1% rule +8.7/10.0
- ARV discount +7.5/15.0
- Schools +4.3/10.0
- Livability +3.4/5.0
- Condition / age +2.5/5.0
- Rent growth +2.3/5.0
- Appreciation +0.0/10.0
$735,000
🖨 Deal sheet 📄 Offer letter ✓ Due diligence
Multi-family units
County records classify this as Multi-Family (5+ Unit). Listing-text estimate: 4 units. estimate disagrees with records
5+ unit building — per-unit beds/baths from public records are typically unavailable; the breakdown below (if shown) is an estimate from the listing text.
Listing remarks
Investor Opportunity | 4-Unit Multifamily | Riviera Beach, FL Prime income-producing quadruplex in Riviera Beach's Pleasant Heights subdivision. Features (3) 2bed/1bath and (1) 3bed/1bath units across ±3,000 sq ft on a 0.17-acre lot. Annual leases in place. Minutes from Singer Island beaches, shopping, dining, and easy access to I-95 and Blue Heron Blvd. Excellent value-add potential in one of Palm Beach County's most affordable multifamily markets. Schedule your showing today!
Key facts
- Value add potential
- Multifamily
- Income producing
Tags
Neighborhood map
What this means for you Summary
Snapshot
- This is a 3×2bd/1ba + 1×3bd/1ba units multifamily listed at $735k.
Deal economics
- At list price, monthly cash flow is $3k ($35k/yr) — positive. Per door: $724/mo.
- The deal already cash-flows at list — no discount required.
- Meets the 1% rule at list price ($10k rent vs $735k).
- Recommended offer: $724k (1.5% below list) — sets the bar for market timing.
Location & tenants
- Location reads 67/100 on livability (#581 in FL) — a middle-class / working-renter tenant base. Strengths: housing A+, health & safety A+, cost of living A-; Watch: employment D, crime F, amenities F.
- Palm Beach (suburban): math 46% / reading 53% proficiency, ranked #34 of 73 in FL (top 47%) — families likely to look elsewhere, expect single-tenant / working-renter base with shorter leases.
- Zoned schools: Dr. Mary Mcleod Bethune Elementary (math 28% / reading 25%, grade F, #2,009 of 2,144 statewide, top 94%, 540 students, 87% FRL); Howell L. Watkins Middle School (math 18% / reading 33%, grade F, #512 of 571 statewide, top 90%, 794 students, 76% FRL); Palm Beach Gardens High School (math 19% / reading 40%, grade F, #447 of 667 statewide, top 68%, 2,570 students, 61% FRL) — zoned schools average 75% FRL vs 52% district-wide (23 pts higher); higher-poverty schools than district average — tighter screening recommended.
- Zoned-school proficiency averages 27% at this address vs 50% district-wide (-22 pts) — the specific schools serving this property underperform the Palm Beach average; the district grade overstates school quality for this exact location.
- Market conditions: Rents soft (-0.7%/yr); 506 active listings in the ZIP; 27 comparable units currently listed for rent nearby; rentals at typical pace (median 25d on market — plan ~3-4 weeks tenant-placement turnaround); 3,974 units permitted in Palm Beach County in 2024 (1,012 in 5+ unit buildings).
- At $10,100/mo this rent would consume 186% of the median local household income ($65k/yr) (locally 1838% of renters already pay >50% of income on rent) — very limited rent-growth headroom before tenants either downsize or default.
Forward outlook
- Local home prices are declining (-3.0%/yr); year-one equity from $5k of loan paydown is wiped out by about $22k of value loss. Plan a longer hold.
- Palm Beach County population projected at +30% by 2050 — long-run rental-demand tailwind backs the buy-and-hold thesis.
- At projected returns (-3.0% appreciation + 0.0% rent growth), your $206k cash investment doubles in ~10 years — after that, you're playing with house money.
Negotiation context
- It's been on market 30 days — a 2% lower offer ($724k) is reasonable based on typical stale-listing flexibility.
- 5 sale attempts since 4y ago with the ask held roughly flat each time — persistent listings suggest the price (not the market) is what's stuck; bring a comps-based counter.
Risks & watch-outs
- Climate carrying-cost: severe wind risk, 99% chance of damaging wind over 30y; extreme-heat days projected 7→24/yr by 2055 (HVAC capex compounding) — expect insurance premiums to compound above CPI over the hold.
Questions for the listing agent
- Can we see the unit-by-unit rent roll, current vacancy, and any below-market leases? What's the average tenancy length?
- What capital expenditures (roof, boiler, parking lot, exteriors) have been made in the last 5 years, and what's planned in the next 2?
- Built in 1960 — when were the roof, HVAC, electrical panel, plumbing, and water heater last replaced?
- Is there a deadline driving the sale (1031 exchange, divorce, estate, relocation)? That informs how much negotiation room exists.
- Crime grade is F in this area — have there been break-ins, vandalism, or insurance claims at this property in the last 3 years? What carrier currently insures it and at what premium?
- What's the average days-on-market for RENTAL listings here right now (not sales)? A rising rental-DOM trend means longer vacancies and softer asking-rent achievability than the comps imply.
- What's the recent tenant-quality profile in this submarket — average credit score on applications, eviction rate, late-payment / NSF rate, and stable-employment percentage? A property-management company in the area should have these aggregated.
- How much new apartment / multifamily construction is in the pipeline within 1–3 miles? Heavy new supply (>2% of stock underway) typically softens rents 12–24 months out; light construction supports rent growth.
Investment metrics
- 1% rule
- 1.37% ✓
- Cap rate
- 11.02%
- Cash-on-cash
- 16.89%
- DSCR
- 1.75
- GRM
- 6.1
CMA / ARV
No comps found within radius.
Projected returns pro-forma
-3.0% appreciation · 0.0% rent growth · sell at horizon
- IRR
- 4.7%
- Equity multiple
- 1.17×
- Total profit
- $35,956
- Equity at exit
- $109,591
- IRR
- 11.2%
- Equity multiple
- 1.75×
- Total profit
- $155,122
- Equity at exit
- $63,549
Cash invested: $205,800 (down + closing). Projections, not guarantees.
Landlord ↔ Tenant lean methodology
- Overall (STATE)
- 87 Strongly Landlord-Friendly
- State Florida
- 87 Strongly Landlord-Friendly · R+3
- County
- — inherits STATE
- City
- — inherits STATE
ZIP-level market 33404
- Home prices YoY
- -31.1%
- Rents YoY
- -0.7%
- Active inventory
- 506
- Price-to-rent
- 25.7×
Monthly cashflow live
- Estimated rent
- $10,100 medium interval (Pro) →
- Mortgage (P&I)
- −$3,854
- Tax from tax record
- −$921 /mo · $11,058/yr
- Insurance
- −$306
- HOA
- −$0
- Vacancy / Maint / Mgmt
- −$2,121
- Net cashflow
- $2,897
Break-even live
4-unit breakdown (identical units grouped — click to expand)
| Units | Beds | Baths | Est. rent |
|---|---|---|---|
| 3× units | 2 | 1 | $7,158 |
| #1 | 2 | 1 | $2,386 |
| #2 | 2 | 1 | $2,386 |
| #3 | 2 | 1 | $2,386 |
| 1× unit | 3 | 1 | $2,941 |
| Total (4 units) | $10,100 | ||
UW: 25.0% down · 7.5% · 30yr · 1.5% tax · 5.0% vac · 8.0% maint · 8.0% mgmt
Financing live
Cash to close
- Down payment
- $183,750
- Closing costs
- $22,050
- Reserves months
- —
- Total cash needed
- —
Loan-product check · same deal, 3 products live
Conventional
25% down · 7.5% · 30yr
- Down + closing
- —
- Monthly P&I
- —
- Monthly cashflow
- —
- DSCR
- —
- Eligible?
- —
Personal DTI + credit; lowest rate.
DSCR
20% down · 8.5% · 30yr
- Down + closing
- —
- Monthly P&I
- —
- Monthly cashflow
- —
- DSCR
- —
- Eligible?
- —
No personal income docs; deal must DSCR.
Hard money
10% down · 12.0% · 12mo
- Down + closing
- —
- Monthly P&I
- —
- Monthly cashflow
- —
- DSCR
- —
- Eligible?
- —
Short-term bridge; refi at stabilization.
Rent comps 27 comps
| Address | Beds | Baths | Sqft | Rent | $/sqft | DOM | Units | Dist |
|---|---|---|---|---|---|---|---|---|
| 1389 W 33rd St Riviera Beach, FL | 4.0 | 3.0 | 1737 | $3,000 | $1.73 | 24d | 1 | 0.27mi |
| 815 Silver Beach Rd Lake Park, FL | 4.0 | 3.0 | 1480 | $3,000 | $2.03 | 24d | 1 | 0.29mi |
| 1400 W 28th St Unit 1 Riviera Beach, FL | 4.0 | 2.0 | 1100 | $3,200 | $2.91 | 24d | 1 | 0.39mi |
| 855 Date Palm Dr West Palm Beach, FL | 3.0 | 3.0 | 1216 | $3,150 | $2.59 | 24d | 1 | 0.45mi |
| 520 W 28th St Riviera Beach, FL | 3.0 | 1.0 | 1296 | $6,000 | $4.63 | 3d | 1 | 0.67mi |
| 2226 Oakmont Dr Riviera Beach, FL | 3.0 | 2.5 | 1972 | $2,850 | $1.45 | 24d | 1 | 0.90mi |
| 2016 Avenue S Riviera Beach, FL | 4.0 | 3.0 | 1128 | $3,800 | $3.37 | 24d | 1 | 0.91mi |
| 111 W 35th St Riviera Beach, FL | 4.0 | 2.0 | 1600 | $3,000 | $1.88 | 11d | 1 | 0.95mi |
| 250 Foresteria Dr West Palm Beach, FL | 4.0 | 3.0 | 2080 | $11,500 | $5.53 | 20d | 1 | 1.02mi |
| 301 Hawthorne Dr West Palm Beach, FL | 3.0 | 2.0 | 1402 | $3,200 | $2.28 | 24d | 1 | 1.10mi |
| 220 Lake Shore Dr Lake Park, FL | 1.0–3.0 | 1.5–3.5 | 1575 | $25,000 | $15.87 | 5d | 18 | 1.19mi |
| 135 E 28th St Riviera Beach, FL | 4.0 | 2.0 | 1711 | $3,200 | $1.87 | 24d | 1 | 1.25mi |
| 1401 W 9th St Riviera Beach, FL | 3.0 | 2.0 | 1304 | $3,200 | $2.45 | 24d | 1 | 1.36mi |
| 65 W 16th St Apt 1 Riviera Beach, FL | 4.0 | 2.0 | 1232 | $3,500 | $2.84 | 17d | 1 | 1.37mi |
| 65 W 16th St Apt 1 Riviera Beach, FL | 4.0 | 2.0 | 1200 | $3,500 | $2.92 | 7d | 1 | 1.37mi |
| 620 Southwind Cir Unit A North Palm Beach, FL | 3.0 | 2.0 | 1697 | $4,200 | $2.47 | 24d | 1 | 1.45mi |
| 624 Southwind Cir Apt 4 North Palm Beach, FL | 3.0 | 2.0 | 1134 | $4,750 | $4.19 | 24d | 1 | 1.45mi |
| 624 Southwind Cir Unit 3 North Palm Beach, FL | 3.0 | 3.0 | 1316 | $5,500 | $4.18 | 24d | 1 | 1.45mi |
| 360 Wilma Cir #7 Riviera Beach, FL | 3.0 | 2.0 | 1590 | $4,500 | $2.83 | 24d | 1 | 1.45mi |
| 2545 Conroy Dr West Palm Beach, FL | 3.0 | 2.0 | 1066 | $3,295 | $3.09 | 24d | 1 | 1.48mi |
| 2573 Conroy Dr West Palm Beach, FL | 5.0 | 3.0 | 2153 | $5,950 | $2.76 | 24d | 1 | 1.49mi |
| 2650 Lake Shore Dr #2303 Riviera Beach, FL | 3.0 | 3.0 | 1537 | $4,950 | $3.22 | 24d | 1 | 1.49mi |
| 2650 Lake Shore Dr #1003 Riviera Beach, FL | 3.0 | 3.0 | 1788 | $4,200 | $2.35 | 24d | 1 | 1.49mi |
| 2650 Lake Shore Dr #1203 Riviera Beach, FL | 3.0 | 3.0 | 1803 | $4,250 | $2.36 | 24d | 1 | 1.49mi |
| 2650 Lake Shore Dr #2403 Riviera Beach, FL | 3.0 | 3.0 | 1788 | $6,000 | $3.36 | 24d | 1 | 1.49mi |
| 2650 Lake Shore Dr #804 Riviera Beach, FL | 3.0 | 3.5 | 1704 | $4,500 | $2.64 | 24d | 1 | 1.49mi |
| 2650 Lake Shore Dr #803 Riviera Beach, FL | 3.0 | 3.0 | 1800 | $5,000 | $2.78 | 24d | 1 | 1.49mi |
Listing history 29 events
-
2026-06-18days on market $735,000 Active 30 DOM
-
2026-06-17days on market $735,000 Active 29 DOM
-
2026-06-16days on market $735,000 Active 28 DOM
-
2026-06-15days on market $735,000 Active 27 DOM
-
2026-06-13days on market $735,000 Active 25 DOM
-
2026-06-09days on market $735,000 Active 21 DOM
-
2026-06-08days on market $735,000 Active 20 DOM
-
2026-06-07days on market $735,000 Active 19 DOM
-
2026-06-04days on market $735,000 Active 16 DOM
-
2026-06-03days on market $735,000 Active 15 DOM
-
2026-06-02days on market $735,000 Active 14 DOM
-
2026-06-01days on market $735,000 Active 13 DOM
-
2026-05-31days on market $735,000 Active 12 DOM
-
2026-04-23status Pending
-
2026-04-13$735,000 Active
-
2025-11-19historical $2,500
-
2025-10-17$2,500
-
2023-07-17soldstatus $650,000
-
2022-12-02historical
-
2022-11-01status Active
-
2022-10-30historical
-
2022-09-27price $629,000
-
2022-08-04price $642,000
-
2022-07-25status Active
-
2022-07-14status Pending
-
2022-07-01$650,000 Active
-
2016-07-22soldstatus $230,000
-
2015-02-11soldstatus $136,000
-
2015-02-11soldstatus $162,900
ⓘ Source: listings_history table (triggers on properties + properties_extension) + one-shot
backfill from property_details.listing_events for pre-trigger history.
Tax reassessment forecast FL · Resets to sale price
- Current annual tax
- $11,058 · $921/mo
- Projected year-2 tax
- $11,058 · $921/mo
- Expected delta
- $0/yr ($0/mo · 0.0%)
ⓘ Screening estimate from a state-policy table — verify with the county assessor before closing.
Climate risk First Street
- Flood 1/10 Low FEMA zone X (unshaded) · 0% chance over 30 yrs
- Wildfire 1/10 Low
- Heat 10/10 Extreme 7 d/yr ≥106°F today · 24 d/yr by 30 yrs out
- Wind 10/10 Extreme 99% chance of damaging wind over 30 yrs
- Air quality 2/10 Low 0 unhealthy d/yr today · 1 by 30 yrs out
Nearby sold comps map
Loading sold comps map…
Walkable amenities ~0.75 mi
Loading nearby amenities…
Taxation est. · year 1
- Rental income
- $121,200
- − Mortgage interest
- −$41,171
- − Property taxes
- −$11,058
- − Insurance
- −$3,675
- − Repairs & maintenance
- −$9,696
- − Management
- −$9,696
- − Depreciation
- −$21,382
- Taxable income
- $24,522
- Est. tax owed @ 24.0%
- −$5,885
- After-tax cash flow
- $28,877/yr
For passive investors: Depreciation is non-cash, so a rental often shows a tax loss while cash-flowing — sheltering income. Rental losses are passive: they offset passive income freely, and up to $25,000/yr can offset ordinary (W-2) income if you actively participate and your MAGI is under $100k (phasing out to $0 by $150k); unused losses carry forward. On sale, claimed depreciation is recaptured at up to 25%, and gains may owe capital-gains tax (a 1031 exchange can defer both). Figures are a year-1 estimate at your 24.0% rate — not tax advice; consult a CPA.
Schools (NCES district)
- District
- Palm Beach
- NCES district ID
- 1201500
- Math proficiency
- 46% ▼ -16.00%
- Reading proficiency
- 53% ▼ -4.00%
- Median HH income
- $53,943
- Composite
- 42.72/100
- National rank
- #3160
- State rank
- #34 of 73 in FL
Livability — Riviera Beach
- Score
- 67/100
- State rank
- #581
- US rank
- #11060
Category grades
Schools grade is shown separately in the Schools card above.
Census & demographics
- Census place
- Riviera Beach, FL
- County
- Palm Beach County · 1,438,312 people
- City population
- 30,912
- Metro
- Miami-Fort Lauderdale-Pompano Beach, FL
- Population (ZIP)
- 30,912
- Household income
- $65,063
- Rent vs Own
- Severe rent burden
- 1838.0
Population outlook (Palm Beach County) Hauer SSP2
- Today (2025)
- 1,637,487 people
- By 2030
- 1,743,255 · +6.5%
- By 2040
- 1,948,712 · +19.0%
- By 2050
- 2,132,979 · +30.3%
- By 2075
- 2,530,027 · +54.5%
- By 2100
- 2,706,979 · +65.3%
Race, ethnicity, and origin ACS 2023
- Neighborhood character
- Majority Black (64%)
- Race & ethnicity
- Black 64% White 22% Hispanic / Latino 9% Two or more races 8%
- Hispanic origin (detail)
- Mexican 1% Puerto Rican 1%
- Common ancestry
- Hispanic 8% Romanian 1% Italian 1%
- Foreign-born
- 21% · Canada, Jamaica
- Languages at home
- 82% English-only · Spanish 8% French/Haitian/Cajun 7% Other Indo-European 1%
Political lean MEDSL · Palm Beach
- 2024 margin
- Toss-up / Even · D 50.0% · R 49.2%
- 2008→2024 swing
- -22.1pp toward R · 2008: 22.9pp · 2024: 0.8pp
- All cycles
- 2024: D+0.8 2020: D+12.8 2016: D+15.3 2012: D+17.0 2008: D+22.9
Not yet ingested
- Civics
- —
Market trends
- HPI YoY
- ▼ -153.74%
- Current HPI
- 341.1761
- Rent YoY
- ▼ -0.72%
- Metro
- Miami-Fort Lauderdale-Pompano Beach, FL
- State GDP YoY
- ▲ 3.28%
- F500 in state
- 36
Industry mix (Fortune 500 HQ in FL)
| Industry | F500 HQs | Revenue |
|---|---|---|
| Industrial Technology | 2 | $29B |
|
||
| Insurance | 2 | $17B |
|
||
| Retail | 1 | $60B |
|
||
| Technology Distribution | 1 | $58B |
|
||
| Homebuilding | 1 | $35B |
|
||
| Technology Manufacturing | 1 | $35B |
|
||
Price history
+440.4% since first listed16 events — show timeline
- 2026-04-23 Pending — Beaches MLS
- 2026-04-13 Listed $735,000 Beaches MLS
- 2025-11-19 Rental Removed $2,500 RMLSFL
- 2025-10-17 Listed for Rent $2,500 RMLSFL
- 2023-07-17 Sold (Public Records) $650,000 Public Records
- 2022-12-02 Listing Removed — Beaches MLS
- 2022-11-01 Relisted — Beaches MLS
- 2022-10-30 Listing Removed — Beaches MLS
- 2022-09-27 Price Changed $629,000 Beaches MLS
- 2022-08-04 Price Changed $642,000 Beaches MLS
- 2022-07-25 Relisted — Beaches MLS
- 2022-07-14 Pending — Beaches MLS
- 2022-07-01 Listed $650,000 Beaches MLS
- 2016-07-22 Sold (Public Records) $230,000 Public Records
- 2015-02-11 Sold (Public Records) $162,900 Public Records
- 2015-02-11 Sold (Public Records) $136,000 Public Records
Property tax history
+14.1%/yrLatest (2025): $11,058 · -1.6% YoY. Source: county tax records.
Cash-flow waterfall
monthlySold comps — $/sqft
last 12 mo · ≤1 miLoading sold comps…