7300 N 51st Ave Unit F93 · Glendale, AZ
Flood risk 1/10 · Minimal
- FEMA flood zone
- X (shaded)
- Chance of flooding over 30 yrs
- 0.0%
- Est. flood insurance / yr
- $507 – $1,088
Fire risk 1/10 · Minimal
- Est. fire insurance / yr
- $610 – $1,132
Heat risk 9/10 · Severe
- Hot days now (above 112°F)
- 6 days/yr
- Hot days in 30 yrs
- 17 days/yr
Wind risk 1/10 · Minimal
- Chance of severe wind over 30 yrs
- —
Air-quality risk 2/10 · Minimal
- Unhealthy air days now
- 0 days/yr
- Unhealthy air days in 30 yrs
- 1 days/yr
Risk factors via First Street. Map © Google.
Why this score? — see what drove the C+ grade
The composite is a weighted blend of 9 inputs, each scored 0–100. Each bar is that input's sub-score; the figure is the points it added to the 100-point composite (weight × sub-score).
- Cash flow +30.0/30.0
- 1% rule +10.0/10.0
- DSCR +10.0/10.0
- Livability +3.8/5.0
- Condition / age +2.5/5.0
- Schools +2.3/10.0
- Rent growth +1.8/5.0
- ARV discount +0.0/15.0
- Appreciation +0.0/10.0
$25,500
🖨 Deal sheet (PDF) 📄 Offer letter ✓ Due diligence
Listing remarks
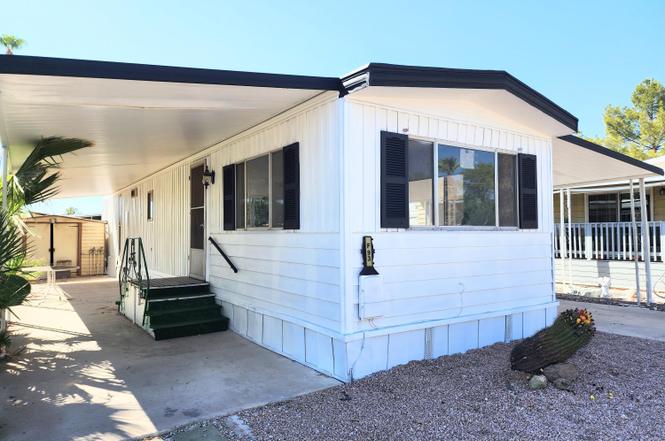
Perfect 1 Bedroom 1 Bathroom escape. Home was recently updated with New interior and exterior paint. Whole home flooring, newly finished roof and two new wall mount AC units. Tankless water heater and updated appliances. Home Priced to Sell fast. Lot rent is still very affordable with nice community amenities. Owner will consider financing: ✔ Down Payment: $5,000 ✔ Monthly Payment $555/ month for 60 moths ✔ Sold As-Is Comes with Large shed Must get park approval , 55+ community.
Key facts
- Newly finished roof
- Large shed
- Whole home flooring
Tags
Property features AI
Finance
- Other: Lot features include a 3,000 sq ft lot with gravel/stone front and back
- HOA & community: Land lease (monthly); Monthly land lease fee of $754; Association covers sewer, grounds maintenance, street maintenance, and trash; Community pool
Exterior
- Parking: 2 covered parking spaces; 2 open parking spaces; 2 carport spaces
- Utilities: City water; Public sewer; 220 volts available in kitchen (electric)
- Home design: Leasehold property; Manufactured/mobile housing
- Construction: Wood frame construction; Painted exterior; Metal roof with reflective coating; Building area provided by owner
- Exterior features: Storage; Gravel/stone front and back
Interior
- Kitchen: Electric range/oven; 220-volt outlet in kitchen
- Bedrooms: 1 bedroom
- Flooring: Tile
- Bathrooms: 1 full bathroom
- Heating & cooling: Ceiling fan(s); ENERGY STAR qualified equipment; Window/wall unit cooling; No heating
- Interior features: Eat-in kitchen; Tankless hot water heater; Tile flooring
- Laundry & utility: No laundry hook-ups on site
Neighborhood map
What this means for you Summary
Snapshot
- This is a 1-bed/1.0-bath manufactured listed at $26k.
Deal economics
- At list price, monthly cash flow is $452 ($5k/yr) — positive.
- The deal already cash-flows at list — no discount required.
- Meets the 1% rule at list price ($795 rent vs $26k).
- Recommended offer: $22k (12.0% below list) — sets the bar for market timing.
- Cap rate 27.6% vs local median 3.5% in Glendale — top-decile yield for the area; either an underpriced asset or a hidden risk that comps aren't pricing in. Stress-test before assuming the spread holds.
Location & tenants
- Location reads 76/100 on livability (#12 in AZ, #3,235 nationally) — a middle-class / working-renter tenant base. Strengths: commute A+, housing A+, amenities B; Watch: health & safety D+, crime F.
- Glendale Union High School District (4285) (urban): math 23% / reading 31% proficiency, ranked #130 of 249 in AZ (top 52%) — low school quality limits family demand, transient renter base, plan for 1-2y turnover.
- Zoned schools: Glendale Landmark School (math 9% / reading 11%, grade F, #1,005 of 1,109 statewide, top 92%, 828 students, 93% FRL); Glendale High School (math 13% / reading 22%, grade F, #245 of 381 statewide, top 65%, 1,816 students, 76% FRL).
- Zoned-school proficiency averages 14% at this address vs 27% district-wide (-13 pts) — the specific schools serving this property underperform the Glendale Union High School District (4285) average; the district grade overstates school quality for this exact location.
- Market conditions: Rents soft (-3.0%/yr); 220 active listings in the ZIP; 40 comparable units currently listed for rent nearby; rentals leasing fast (median 0d on market — plan ~1-2 weeks tenant-placement turnaround); 36,011 units permitted in Maricopa County in 2024 (12,801 in 5+ unit buildings).
- This rent is only 18% of the median local income ($54k/yr) — well below the 30% rent-burden line; pricing power to push rent on renewal without tenant pushback.
Forward outlook
- Local home prices are declining (-3.0%/yr); year-one equity from $176 of loan paydown is wiped out by about $765 of value loss. Plan a longer hold.
- Maricopa County population projected at +38% by 2050 — long-run rental-demand tailwind backs the buy-and-hold thesis.
- At projected returns (-3.0% appreciation + 0.0% rent growth), your $7k cash investment doubles in ~2 years — after that, you're playing with house money.
Negotiation context
- It's been on market 586 days — a 12% lower offer ($22k) is reasonable based on typical stale-listing flexibility.
- 2 sale attempts since 2y ago; this cycle's ask has dropped $9k (27%) from the opening price — seller is motivated, your offer sets the floor, not the list.
Risks & watch-outs
- Climate carrying-cost: extreme-heat days projected 6→17/yr by 2055 (HVAC capex compounding) — expect insurance premiums to compound above CPI over the hold.
Questions for the listing agent
- It's been on market 586 days. Have you received any prior offers? Is the seller open to a 12% concession, seller financing, or rate buy-down credit?
- Built in 1971 — when were the roof, HVAC, electrical panel, plumbing, and water heater last replaced?
- Why hasn't it sold? Are there any deal-killer items the seller is aware of (foundation, flood, title, zoning, code violations)?
- Is there a deadline driving the sale (1031 exchange, divorce, estate, relocation)? That informs how much negotiation room exists.
- Crime grade is F in this area — have there been break-ins, vandalism, or insurance claims at this property in the last 3 years? What carrier currently insures it and at what premium?
- What's the average days-on-market for RENTAL listings here right now (not sales)? A rising rental-DOM trend means longer vacancies and softer asking-rent achievability than the comps imply.
- What's the recent tenant-quality profile in this submarket — average credit score on applications, eviction rate, late-payment / NSF rate, and stable-employment percentage? A property-management company in the area should have these aggregated.
- How much new for-sale + rental construction is in the pipeline within 1–3 miles? Heavy new supply typically softens prices + rents 12–24 months out; constrained supply supports both.
Investment metrics
- 1% rule
- 3.12% ✓
- Cap rate
- 27.57%
- Cash-on-cash
- 75.99%
- DSCR
- 4.38
- GRM
- 2.7
CMA / ARV
- ARV (on-the-fly)
- $21,700
- Comps found
- 3
Show comp detail 3 sales within ~0.75 mi
| Address | Dist | Beds/Ba | Sqft | Sold | Price | $/sf | Match |
|---|---|---|---|---|---|---|---|
| 7300 N 51st Ave Unit F96 | 0.01mi | 2/2.0 (+1) | 720 (+3%) | 16mo | $22,000 | $31 | 72 |
| 7300 N 51st Ave Unit D212 | 0.17mi | 1/1.0 | 774 (+11%) | 9mo | $25,000 | $32 | 67 |
| 7300 N 51st Ave Ave Unit F177 | 0.00mi | 2/2.0 (+1) | 768 (+10%) | 20mo | $12,000 | $16 | 59 |
Match score weights: distance 35% · size 25% · config 20% · recency 20%. Top-matched comps best support the ARV.
Projected returns pro-forma
-3.0% appreciation · 0.0% rent growth · sell at horizon
- IRR
- 72.5%
- Equity multiple
- 4.13×
- Total profit
- $22,347
- Equity at exit
- $3,802
- IRR
- 75.5%
- Equity multiple
- 7.66×
- Total profit
- $47,583
- Equity at exit
- $2,205
Cash invested: $7,140 (down + closing). Projections, not guarantees.
Landlord ↔ Tenant lean methodology
- Overall (STATE)
- 87 Strongly Landlord-Friendly
- State Arizona
- 87 Strongly Landlord-Friendly · R+3
- County
- — inherits STATE
- City
- — inherits STATE
ZIP-level market 85301
- Home prices YoY
- -10.6%
- Rents YoY
- -3.0%
- Active inventory
- 220
- Price-to-rent
- 2.7×
Monthly cashflow live
- Estimated rent
- $795 high interval (Pro) →
- Mortgage (P&I)
- −$134
- Tax est. 1.5%
- −$32 /mo · $382/yr
- Insurance
- −$11
- HOA
- −$0
- Lot rent leased land?
- −$0
- Vacancy / Maint / Mgmt
- −$167
- Net cashflow
- $452
Break-even live
Sensitivity live
| Price | -10% $470 | -5% $461 | +0% $452 | +5% $443 | +10% $435 |
|---|---|---|---|---|---|
| Rent | -10% $389 | -5% $421 | +0% $452 | +5% $484 | +10% $515 |
| Rate | -1.0pp $465 | -0.5pp $459 | base $452 | +0.5pp $446 | +1.0pp $439 |
UW: 25.0% down · 7.5% · 30yr · 1.5% tax · 5.0% vac · 8.0% maint · 8.0% mgmt
Financing live
Cash to close
- Down payment
- $6,375
- Closing costs
- $765
- Reserves months
- —
- Total cash needed
- —
Loan-product check · same deal, 3 products live
Conventional
25% down · 7.5% · 30yr
- Down + closing
- —
- Monthly P&I
- —
- Monthly cashflow
- —
- DSCR
- —
- Eligible?
- —
Personal DTI + credit; lowest rate.
DSCR
20% down · 8.5% · 30yr
- Down + closing
- —
- Monthly P&I
- —
- Monthly cashflow
- —
- DSCR
- —
- Eligible?
- —
No personal income docs; deal must DSCR.
Hard money
10% down · 12.0% · 12mo
- Down + closing
- —
- Monthly P&I
- —
- Monthly cashflow
- —
- DSCR
- —
- Eligible?
- —
Short-term bridge; refi at stabilization.
Rent comps 40 comps
| Address | Beds | Baths | Sqft | Rent | $/sqft | DOM | Units | Dist |
|---|---|---|---|---|---|---|---|---|
| 7160 N 53rd Ave Unit 2 Glendale, AZ | 2.0 | 1.0 | 625 | $925 | $1.48 | 0d | 1 | 0.23mi |
| 7151 N 53rd Ave Unit 3 Glendale, AZ | 2.0 | 1.0 | 625 | $1,400 | $2.24 | 0d | 1 | 0.24mi |
| 7235 N 55th Ave Glendale, AZ | 1.0 | 1.0 | 631 | $925 | $1.47 | 0d | 1 | 0.27mi |
| 7107 N 53rd Ave Unit 13 Glendale, AZ | 1.0 | 1.0 | 420 | $750 | $1.79 | 0d | 1 | 0.33mi |
| 7107 N 53rd Ave Apt 10 Glendale, AZ | 1.0 | 1.0 | 649 | $900 | $1.39 | 0d | 1 | 0.33mi |
| 7107 N 53rd Ave Unit 5 Glendale, AZ | 2.0 | 1.0 | 750 | $950 | $1.27 | 0d | 1 | 0.33mi |
| 4937 W Myrtle Ave Glendale, AZ | 1.0–2.0 | 1.0–2.0 | 752 | $975 | $1.30 | 0d | 11 | 0.48mi |
| 5623 W Myrtle Ave Unit 105 Glendale, AZ | 2.0 | 1.0 | 700 | $1,195 | $1.71 | 0d | 1 | 0.50mi |
| 7711 N 51st Ave Glendale, AZ | 2.0 | 1.0 | 590 | $1,110 | $1.88 | 0d | 69 | 0.52mi |
| 7153 N 57th Dr Unit 3 Glendale, AZ | 1.0 | 1.0 | 607 | $925 | $1.52 | 0d | 1 | 0.57mi |
| 4949 W Northern Ave Glendale, AZ | 2.0 | 1.0–2.0 | 632 | $1,120 | $1.77 | 0d | 12 | 0.65mi |
| 8080 N 51st Ave Glendale, AZ | 1.0–2.0 | 1.0–2.0 | 702 | $1,245 | $1.77 | 0d | 11 | 0.68mi |
| 5206 W Ocotillo Rd Unit A Glendale, AZ | 2.0 | 1.0 | 750 | $1,350 | $1.80 | 0d | 1 | 0.69mi |
| 4730 W Northern Ave Glendale, AZ | 1.0–2.0 | 1.0–2.0 | 841 | $1,195 | $1.42 | 26d | 2 | 0.95mi |
| 4730 W Northern Ave Glendale, AZ | 1.0 | 1.0 | 624 | $1,170 | $1.87 | 10d | 2 | 0.95mi |
| 4730 W Northern Ave Glendale, AZ | 1.0 | 1.0 | 624 | $1,120 | $1.79 | 0d | 2 | 0.95mi |
| 6637 N 58th Dr Glendale, AZ | — | 1.0 | 350 | $595 | $1.70 | 0d | 1 | 0.99mi |
| 6637 N 58th Dr Unit 8 Glendale, AZ | 1.0 | 1.0 | 500 | $695 | $1.39 | 12d | 1 | 0.99mi |
| 4748 W Sierra Vista Dr Glendale, AZ | 1.0 | 1.0 | 650 | $1,000 | $1.54 | 0d | 1 | 1.03mi |
| 4748 W Sierra Vista Dr Unit A1 Glendale, AZ | 1.0 | 1.0 | 650 | $910 | $1.40 | 0d | 1 | 1.04mi |
| 5902 W Royal Palm Rd Glendale, AZ | 1.0–2.0 | 1.0 | 630 | $1,075 | $1.71 | 0d | 19 | 1.18mi |
| 7102 N 43rd Ave Glendale, AZ | 2.0 | 1.0 | 537 | $1,188 | $2.21 | 0d | 28 | 1.20mi |
| 4530 W McLellan Rd Glendale, AZ | 1.0–3.0 | 1.0 | 782 | $999 | $1.28 | 0d | 6 | 1.22mi |
| 4444 W Ocotillo Rd Glendale, AZ | 1.0–2.0 | 1.0–1.5 | 766 | $1,099 | $1.43 | 0d | 3 | 1.25mi |
| 6060 W Royal Palm Rd Glendale, AZ | 1.0 | 1.0 | 543 | $1,142 | $2.10 | 0d | 4 | 1.26mi |
| 8450 N 59th Ave Glendale, AZ | 1.0–3.0 | 1.0–2.0 | 919 | $1,399 | $1.52 | 7d | 1 | 1.34mi |
| 6043 W Laurie Ln Apt 4 Glendale, AZ | 1.0 | 1.0 | 675 | $1,050 | $1.56 | 13d | 1 | 1.34mi |
| 8605 N 59th Ave Unit 2023 Glendale, AZ | 1.0 | 1.0 | 650 | $1,150 | $1.77 | 4d | 1 | 1.35mi |
| 6049 W Laurie Ln Unit 4 Glendale, AZ | 1.0 | 1.0 | 675 | $1,100 | $1.63 | 12d | 1 | 1.35mi |
| 6049 W Laurie Ln Unit 7 Glendale, AZ | 1.0 | 1.0 | 650 | $1,050 | $1.62 | 0d | 1 | 1.35mi |
| 6049 W Laurie Ln Unit 5 Glendale, AZ | 2.0 | 1.0 | 750 | $1,210 | $1.61 | 0d | 1 | 1.35mi |
| 8150 N 61st Ave Glendale, AZ | 1.0–2.0 | 1.0–2.0 | 725 | $866 | $1.19 | 0d | 32 | 1.37mi |
| 8605 N 59th Ave Unit 2027 Glendale, AZ | 1.0 | 1.0 | 650 | $1,150 | $1.77 | 10d | 1 | 1.37mi |
| 8546 N 59th Ave Apt 206 Glendale, AZ | 1.0 | 1.0 | 700 | $1,056 | $1.51 | 22d | 1 | 1.39mi |
| 6141 N 59th Ave Glendale, AZ | 1.0–2.0 | 1.0–2.0 | 796 | $1,095 | $1.38 | 0d | 1 | 1.40mi |
| 5926 W Rose Ln Unit A Glendale, AZ | 2.0 | 1.0 | 750 | $1,435 | $1.91 | 3d | 1 | 1.42mi |
| 5201 W Olive Ave Glendale, AZ | 1.0–3.0 | 1.0–2.0 | 981 | $1,445 | $1.47 | 0d | 19 | 1.43mi |
| 8530 N 59th Ave Glendale, AZ | 1.0 | 0.5–1.0 | 690 | $1,057 | $1.53 | 0d | 3 | 1.43mi |
| 6105 N 59th Ave Glendale, AZ | 1.0 | 1.0 | 475 | $899 | $1.89 | 0d | 1 | 1.47mi |
| 5947 W Rose Ln Unit 5927-09 Glendale, AZ | 1.0 | 1.0 | 600 | $1,030 | $1.72 | 0d | 1 | 1.47mi |
Listing history 23 events
-
2026-06-22days on market $25,500 Active 586 DOM
-
2026-06-21days on market $25,500 Active 585 DOM
-
2026-06-18days on market $25,500 Active 582 DOM
-
2026-06-17days on market $25,500 Active 581 DOM
-
2026-06-16days on market $25,500 Active 580 DOM
-
2026-06-15days on market $25,500 Active 579 DOM
-
2026-06-13days on market $25,500 Active 577 DOM
-
2026-06-13days on market $25,500 Active 576 DOM
-
2026-06-09days on market $25,500 Active 573 DOM
-
2026-06-08days on market $25,500 Active 572 DOM
-
2026-06-07days on market $25,500 Active 571 DOM
-
2026-06-04days on market $25,500 Active 568 DOM
-
2026-06-03days on market $25,500 Active 567 DOM
-
2026-06-02days on market $25,500 Active 566 DOM
-
2026-06-01days on market $25,500 Active 565 DOM
-
2026-05-31days on market $25,500 Active 564 DOM
-
2025-10-28price $25,500
-
2025-02-04status Active
-
2025-02-04price $27,500
-
2024-12-21historical
-
2024-12-14price $29,500
-
2024-11-18price $32,500
-
2024-09-30$34,750 Active
ⓘ Source: listings_history table (triggers on properties + properties_extension) + one-shot
backfill from property_details.listing_events for pre-trigger history.
Climate risk First Street
- Flood 1/10 Low FEMA zone X (shaded) · 0% chance over 30 yrs
- Wildfire 1/10 Low
- Heat 9/10 Extreme 6 d/yr ≥112°F today · 17 d/yr by 30 yrs out
- Wind 1/10 Low
- Air quality 2/10 Low 0 unhealthy d/yr today · 1 by 30 yrs out
Nearby sold comps map
Loading sold comps map…
Walkable amenities ~0.75 mi
Loading nearby amenities…
Taxation est. · year 1
- Rental income
- $9,545
- − Mortgage interest
- −$1,428
- − Property taxes
- −$382
- − Insurance
- −$128
- − Repairs & maintenance
- −$764
- − Management
- −$764
- − Depreciation
- −$742
- Taxable income
- $5,338
- Est. tax owed @ 24.0%
- −$1,281
- After-tax cash flow
- $4,145/yr
For passive investors: Depreciation is non-cash, so a rental often shows a tax loss while cash-flowing — sheltering income. Rental losses are passive: they offset passive income freely, and up to $25,000/yr can offset ordinary (W-2) income if you actively participate and your MAGI is under $100k (phasing out to $0 by $150k); unused losses carry forward. On sale, claimed depreciation is recaptured at up to 25%, and gains may owe capital-gains tax (a 1031 exchange can defer both). Figures are a year-1 estimate at your 24.0% rate — not tax advice; consult a CPA.
Schools (NCES district)
- District
- Glendale Union High School District (4285)
- NCES district ID
- 0403450
- Math proficiency
- 23% ▼ -38.00%
- Reading proficiency
- 31% ▼ -19.00%
- Median HH income
- $40,846
- Composite
- 22.81/100
- National rank
- #8020
- State rank
- #130 of 249 in AZ
Livability — Glendale
- Score
- 76/100
- State rank
- #12
- US rank
- #3235
Category grades
Schools grade is shown separately in the Schools card above.
Census & demographics
- Census place
- Glendale, AZ
- County
- Maricopa County · 4,537,380 people
- City population
- 294,586
- Metro
- Phoenix-Mesa-Chandler, AZ
- Population (ZIP)
- 68,178
- Household income
- $53,827
- Rent vs Own
- Severe rent burden
- 3741.0
Population outlook (Maricopa County) Hauer SSP2
- Today (2025)
- 4,979,203 people
- By 2030
- 5,378,229 · +8.0%
- By 2040
- 6,156,598 · +23.6%
- By 2050
- 6,872,376 · +38.0%
- By 2075
- 8,401,270 · +68.7%
- By 2100
- 9,247,439 · +85.7%
Race, ethnicity, and origin ACS 2023
- Neighborhood character
- Majority Hispanic (63%)
- Race & ethnicity
- Hispanic / Latino 63% Two or more races 37% White 22% Black 8% Asian 2% Native American 2%
- Hispanic origin (detail)
- Mexican 57% Cuban 1%
- Common ancestry
- Slovak 1% Italian 1%
- Foreign-born
- 26% · Canada, Vietnam, Philippines
- Languages at home
- 46% English-only · Spanish 48% Arabic 1% Other Indo-European 1%
Political lean MEDSL · Maricopa
- 2024 margin
- Toss-up / Even · D 47.7% · R 51.2% · Other 1.1%
- 2008→2024 swing
- +7.1pp toward D · 2008: -10.6pp · 2024: -3.5pp
- All cycles
- 2024: R+3.5 2020: D+2.2 2016: R+3.5 2012: R+12.0 2008: R+10.6
Not yet ingested
- Civics
- —
Market trends
- HPI YoY
- ▼ -50.49%
- Current HPI
- 427.3069
- Rent YoY
- ▼ -2.98%
- Metro
- Phoenix-Mesa-Chandler, AZ
- State GDP YoY
- ▲ 4.54%
- F500 in state
- 20
Industry mix (Fortune 500 HQ in AZ)
| Industry | F500 HQs | Revenue |
|---|---|---|
| Technology | 2 | $13B |
|
||
| Mining / Metals | 1 | $23B |
|
||
| Environmental Services | 1 | $16B |
|
||
| Metals / Steel | 1 | $14B |
|
||
| Technology Distribution | 1 | $9B |
|
||
| Homebuilding | 1 | $8B |
|
||
Price history
-26.6% since first listed7 events — show timeline
- 2025-10-28 Price Changed $25,500 ARMLS
- 2025-02-04 Relisted — ARMLS
- 2025-02-04 Price Changed $27,500 ARMLS
- 2024-12-21 Listing Removed — ARMLS
- 2024-12-14 Price Changed $29,500 ARMLS
- 2024-11-18 Price Changed $32,500 ARMLS
- 2024-09-30 Listed $34,750 ARMLS
Cash-flow waterfall
monthlySold comps — $/sqft
last 12 mo · ≤1 miLoading sold comps…