 Multi-family
42 Manchester Rd · Eastchester, NY
Flood risk 1/10 · Minimal
- FEMA flood zone
- X (unshaded)
- Chance of flooding over 30 yrs
- 0.0%
- Est. flood insurance / yr
- $507 – $1,088
Fire risk 1/10 · Minimal
- Est. fire insurance / yr
- $691 – $1,283
Heat risk 6/10 · Moderate
- Hot days now (above 98°F)
- 7 days/yr
- Hot days in 30 yrs
- 15 days/yr
Wind risk 6/10 · Moderate
- Chance of severe wind over 30 yrs
- 27.0%
Air-quality risk 4/10 · Minor
- Unhealthy air days now
- 3 days/yr
- Unhealthy air days in 30 yrs
- 5 days/yr
Risk factors via First Street. Map © Google.
Why this score? — see what drove the F grade
The composite is a weighted blend of 9 inputs, each scored 0–100. Each bar is that input's sub-score; the figure is the points it added to the 100-point composite (weight × sub-score).
- ARV discount +7.5/15.0
- Schools +7.2/10.0
- Cash flow +7.1/30.0
- Livability +3.9/5.0
- Rent growth +2.5/5.0
- Condition / age +2.5/5.0
- 1% rule +1.9/10.0
- DSCR +1.2/10.0
- Appreciation +0.0/10.0
$539,000
🖨 Deal sheet 📄 Offer letter ✓ Due diligence
Multi-family units
County records classify this as Multi-Family (5+ Unit). Listing-text estimate: 1 unit. estimate disagrees with records
5+ unit building — per-unit beds/baths from public records are typically unavailable; the breakdown below (if shown) is an estimate from the listing text.
Listing remarks
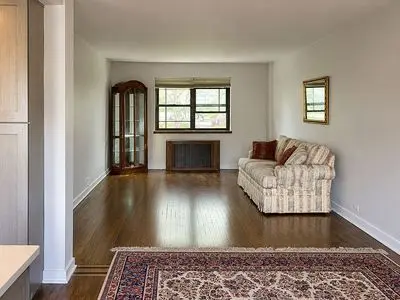
Welcome to this beautifully updated two-bedroom, one-bath, first floor co-op with large white picket fenced patio and garden area. Located in one of Eastchester, NY& apos; s most desired communities, Interlaken Gardens. Only 30 minutes by train to Grand Central Terminal. The open-concept kitchen / dining / living area is renovated, spacious and filled with natural light. The modern kitchen includes granite or marble? counter tops, stainless steel appliances and an entrance out to private patio. Convenient in-home laundry with your own washer/dryer. Updated bathroom. Large primary bedroom with two custom closets. Sizable second bedroom. Ceiling fans/lights in both bedrooms and dining roo
Key facts
- Garden area
- In-home laundry
- Private patio
Tags
Neighborhood map
What this means for you Summary
Snapshot
- This is a 2-bed/1.0-bath multifamily listed at $539k.
Deal economics
- At list price, monthly cash flow is $-778 ($-9k/yr) — negative.
- To cash-flow at today's rent, offer at most $426k (20.9% below list).
- To meet the 1% rule (rent ≥ 1% of price), the offer needs to be $373k (30.8% below list).
- Recommended offer: $373k (30.8% below list) — sets the bar for 1% rule.
Location & tenants
- Location reads 78/100 on livability (#159 in NY, #2,451 nationally) — a middle-class / working-renter tenant base. Strengths: schools A+, crime A+, commute A+; Watch: amenities D-, cost of living F, health & safety D-.
- Eastchester Union Free School District (suburban): math 79% / reading 80% proficiency, ranked #42 of 590 in NY (top 7%) — strong family-tenant draw, lease renewals of 3-5y typical; only 2% free/reduced lunch — higher-income household profile.
- Market conditions: 54 active listings in the ZIP; 40 comparable units currently listed for rent nearby; rentals at typical pace (median 21d on market — plan ~3-4 weeks tenant-placement turnaround); 954 units permitted in Westchester County in 2024 (649 in 5+ unit buildings).
Forward outlook
- Local home prices are declining (-3.0%/yr); year-one equity from $4k of loan paydown is wiped out by about $16k of value loss. Plan a longer hold.
- Westchester County population projected at +10% by 2050 — modest demand growth; plan on rents tracking national, not racing it.
Negotiation context
- It's been on market 36 days — a 3% lower offer ($523k) is reasonable based on typical stale-listing flexibility.
Risks & watch-outs
- Watch-outs: built in 1940 — expect roof / HVAC / electrical / plumbing capex.
- Climate carrying-cost: major wind risk, 27% chance of damaging wind over 30y; extreme-heat days projected 7→15/yr by 2055 (HVAC capex compounding) — expect insurance premiums to compound above CPI over the hold.
Questions for the listing agent
- What do current leases actually rent for vs. the listed asking? Can we see a recent rent roll and the last 12 months of T-12 income?
- It's been on market 36 days. Have you received any prior offers? Is the seller open to a 31% concession, seller financing, or rate buy-down credit?
- Built in 1940 — when were the roof, HVAC, electrical panel, plumbing, and water heater last replaced?
- Is there a deadline driving the sale (1031 exchange, divorce, estate, relocation)? That informs how much negotiation room exists.
- Schools are A-rated — typically a magnet for longer-tenancy family renters. What's the average tenant stay here, and is there a school-zone premium baked into asking?
- The area grade is low — what's the realistic commute time and amenity access for the typical tenant pool here? Any planned neighborhood developments (good or bad) we should know about?
- What's the average days-on-market for RENTAL listings here right now (not sales)? A rising rental-DOM trend means longer vacancies and softer asking-rent achievability than the comps imply.
- What's the recent tenant-quality profile in this submarket — average credit score on applications, eviction rate, late-payment / NSF rate, and stable-employment percentage? A property-management company in the area should have these aggregated.
- How much new apartment / multifamily construction is in the pipeline within 1–3 miles? Heavy new supply (>2% of stock underway) typically softens rents 12–24 months out; light construction supports rent growth.
Investment metrics
- 1% rule
- 0.69% ✗
- Cap rate
- 4.56%
- Cash-on-cash
- -6.18%
- DSCR
- 0.72
- GRM
- 12.0
CMA / ARV
No comps found within radius.
Show comp detail 1 sale within ~0.75 mi
| Address | Dist | Beds/Ba | Sqft | Sold | Price | $/sf | Match |
|---|---|---|---|---|---|---|---|
| 11 Maple Ave | 0.55mi | 3/2.0 (+1) | 1,900 | 20mo | $790,000 | $416 | 36 |
Match score weights: distance 35% · size 25% · config 20% · recency 20%. Top-matched comps best support the ARV.
Projected returns pro-forma
-3.0% appreciation · 3.0% rent growth · sell at horizon
- IRR
- -26.9%
- Equity multiple
- 0.09×
- Total profit
- $-136,811
- Equity at exit
- $80,367
- IRR
- -24.5%
- Equity multiple
- -0.21×
- Total profit
- $-182,677
- Equity at exit
- $46,603
Cash invested: $150,920 (down + closing). Projections, not guarantees.
Landlord ↔ Tenant lean methodology
- Overall (STATE)
- 15 Strongly Tenant-Friendly
- State New York
- 15 Strongly Tenant-Friendly · D+10
- County
- — inherits STATE
- City
- — inherits STATE
ZIP-level market 10709
- Home prices YoY
- -21.7%
- Active inventory
- 54
- Price-to-rent
- 12.0×
Monthly cashflow live
- Estimated rent
- $3,731 high interval (Pro) →
- Mortgage (P&I)
- −$2,827
- Tax est. 1.5%
- −$674 /mo · $8,085/yr
- Insurance
- −$225
- HOA
- −$0
- Vacancy / Maint / Mgmt
- −$783
- Net cashflow
- $-778
Break-even live
UW: 25.0% down · 7.5% · 30yr · 1.5% tax · 5.0% vac · 8.0% maint · 8.0% mgmt
Financing live
Cash to close
- Down payment
- $134,750
- Closing costs
- $16,170
- Reserves months
- —
- Total cash needed
- —
Loan-product check · same deal, 3 products live
Conventional
25% down · 7.5% · 30yr
- Down + closing
- —
- Monthly P&I
- —
- Monthly cashflow
- —
- DSCR
- —
- Eligible?
- —
Personal DTI + credit; lowest rate.
DSCR
20% down · 8.5% · 30yr
- Down + closing
- —
- Monthly P&I
- —
- Monthly cashflow
- —
- DSCR
- —
- Eligible?
- —
No personal income docs; deal must DSCR.
Hard money
10% down · 12.0% · 12mo
- Down + closing
- —
- Monthly P&I
- —
- Monthly cashflow
- —
- DSCR
- —
- Eligible?
- —
Short-term bridge; refi at stabilization.
Rent comps 40 comps
| Address | Beds | Baths | Sqft | Rent | $/sqft | DOM | Units | Dist |
|---|---|---|---|---|---|---|---|---|
| 109 Hillside Pl Apt 2 Eastchester, NY | 3.0 | 2.0 | 1583 | $4,500 | $2.84 | 43d | 1 | 0.48mi |
| Fisher Ave Eastchester, NY | 1.0 | 1.0 | 731 | $2,500 | $3.42 | 43d | 1 | 0.48mi |
| 2 Park Ave Unit 1B Eastchester, NY | 1.0 | 1.0 | 740 | $2,500 | $3.38 | 43d | 1 | 0.48mi |
| Glen Rd Unit H Eastchester, NY | 1.0 | 1.0 | 612 | $2,200 | $3.59 | 43d | 1 | 0.54mi |
| 47 Morgan St Eastchester, NY | 2.0 | 1.0 | 1000 | $4,000 | $4.00 | 43d | 1 | 0.61mi |
| 24 Hall Ave Eastchester, NY | 3.0 | 2.5 | 2600 | $7,300 | $2.81 | 1d | 1 | 0.68mi |
| 212 Alpine Pl Tuckahoe, NY | 1.0 | 1.0 | 700 | $2,700 | $3.86 | 20d | 1 | 0.69mi |
| Young Pl Tuckahoe, NY | 3.0 | 2.5 | 1936 | $7,500 | $3.87 | 1d | 1 | 0.70mi |
| 40 Jackson Ave Eastchester, NY | 1.0 | 1.0 | 725 | $2,950 | $4.07 | 14d | 1 | 0.83mi |
| 156 Wallace St Unit 1 Tuckahoe, NY | 2.0 | 2.0 | 1300 | $3,300 | $2.54 | 24d | 1 | 0.86mi |
| 2 Consulate Dr Unit 1J Tuckahoe, NY | 1.0 | 1.0 | 750 | $2,700 | $3.60 | 12d | 1 | 0.93mi |
| 39 Maynard St Unit 3 Tuckahoe, NY | 3.0 | 1.0 | — | $2,975 | — | 13d | 1 | 0.96mi |
| 39 Maynard St Unit 3 Tuckahoe, NY | 3.0 | 1.0 | — | $2,975 | — | 43d | 1 | 0.96mi |
| 39 Maynard St Unit 3 Tuckahoe, NY | 3.0 | 1.0 | — | $2,975 | — | 20d | 1 | 0.96mi |
| 39 Maynard St Unit 3 Tuckahoe, NY | 3.0 | 1.0 | — | $2,975 | — | 7d | 1 | 0.96mi |
| 39 Maynard St Unit 2E Tuckahoe, NY | 2.0 | 1.0 | 875 | $2,650 | $3.03 | 43d | 1 | 0.96mi |
| 39 Maynard St Tuckahoe, NY | 3.0 | 1.0 | — | $2,975 | — | 24d | 1 | 0.96mi |
| 39 Maynard St Tuckahoe, NY | 3.0 | 1.0 | — | $2,975 | — | 10d | 1 | 0.96mi |
| 39 Maynard St Tuckahoe, NY | 3.0 | 1.0 | — | $2,975 | — | 16d | 1 | 0.96mi |
| 2 Winter Hill Rd Unit 2 Tuckahoe, NY | 2.0 | 2.0 | — | $5,880 | — | 13d | 1 | 0.98mi |
| 2 Winter Hill Rd Unit 2 Tuckahoe, NY | 2.0 | 2.0 | — | $5,495 | — | 10d | 1 | 0.98mi |
| 2 Winter Hill Rd Unit 2 Tuckahoe, NY | 2.0 | 2.0 | — | $5,880 | — | 43d | 1 | 0.98mi |
| 1 Winter Hill Rd Unit 1 Tuckahoe, NY | 1.0 | 1.0 | — | $3,670 | — | 13d | 1 | 0.98mi |
| 1 Winter Hill Rd Unit 1 Tuckahoe, NY | 1.0 | 1.0 | — | $3,390 | — | 43d | 1 | 0.98mi |
| 50 Columbus Ave Unit 817 Tuckahoe, NY | 1.0 | 1.0 | 750 | $3,000 | $4.00 | 22d | 1 | 1.04mi |
| 60 Washington St Unit 2 Tuckahoe, NY | 3.0 | 2.0 | 1500 | $4,800 | $3.20 | 24d | 1 | 1.05mi |
| 54 Washington St Unit 2nd Floor Tuckahoe, NY | 3.0 | 2.0 | 1250 | $3,900 | $3.12 | 6d | 1 | 1.06mi |
| 21 Scarsdale Rd Yonkers, NY | 2.0 | 1.0 | 835 | $4,600 | $5.51 | 1d | 21 | 1.28mi |
| 70 Lake Ave Unit 1 Tuckahoe, NY | 3.0 | 2.5 | 1200 | $4,995 | $4.16 | 11d | 1 | 1.31mi |
| 1 Elm St Unit 3B Tuckahoe, NY | 2.0 | 1.0 | 1100 | $3,200 | $2.91 | 10d | 1 | 1.34mi |
| 1 Elm St Unit 3B Tuckahoe, NY | 2.0 | 1.0 | 1100 | $3,200 | $2.91 | 7d | 1 | 1.34mi |
| 11 Oak Ave Unit 1 Bronxville, NY | 3.0 | 2.0 | 1400 | $4,300 | $3.07 | 43d | 1 | 1.34mi |
| 7 Oak Ave Tuckahoe, NY | 2.0 | 1.0 | 1200 | $2,500 | $2.08 | 43d | 1 | 1.36mi |
| 7 Dunwoodie St Unit 1S Scarsdale, NY | 1.0 | 1.0 | 542 | $2,500 | $4.61 | 43d | 1 | 1.42mi |
| 111 Kensington Rd Unit 8 Bronxville, NY | 1.0 | 1.0 | 825 | $2,650 | $3.21 | 13d | 1 | 1.42mi |
| 106 White Rd Scarsdale, NY | 3.0 | 2.0 | 1700 | $5,999 | $3.53 | 22d | 1 | 1.42mi |
| 106 White Rd Scarsdale, NY | 3.0 | 2.0 | 1700 | $5,800 | $3.41 | 1d | 1 | 1.42mi |
| 128 Colonial Pkwy Unit 3B Yonkers, NY | 1.0 | 1.0 | 871 | $2,750 | $3.16 | 43d | 1 | 1.43mi |
| 837 White Plains Rd Unit 3R Scarsdale, NY | 2.0 | 1.0 | 950 | $2,500 | $2.63 | 7d | 1 | 1.45mi |
| 152 Summerfield St Unit 1 Left Scarsdale, NY | 2.0 | 1.0 | 668 | $2,850 | $4.27 | 43d | 1 | 1.47mi |
Listing history 14 events
-
2026-06-18days on market $539,000 Active 36 DOM
-
2026-06-17days on market $539,000 Active 35 DOM
-
2026-06-16days on market $539,000 Active 34 DOM
-
2026-06-15days on market $539,000 Active 33 DOM
-
2026-06-13days on market $539,000 Active 31 DOM
-
2026-06-09days on market $539,000 Active 27 DOM
-
2026-06-08days on market $539,000 Active 26 DOM
-
2026-06-07days on market $539,000 Active 25 DOM
-
2026-06-04days on market $539,000 Active 22 DOM
-
2026-06-03days on market $539,000 Active 21 DOM
-
2026-06-02days on market $539,000 Active 20 DOM
-
2026-06-01days on market $539,000 Active 19 DOM
-
2026-05-31days on market $539,000 Active 18 DOM
-
2026-05-14$539,000 Active 1202-char remark
ⓘ Source: listings_history table (triggers on properties + properties_extension) + one-shot
backfill from property_details.listing_events for pre-trigger history.
Climate risk First Street
- Flood 1/10 Low FEMA zone X (unshaded) · 0% chance over 30 yrs
- Wildfire 1/10 Low
- Heat 6/10 Major 7 d/yr ≥98°F today · 15 d/yr by 30 yrs out
- Wind 6/10 Major 27% chance of damaging wind over 30 yrs
- Air quality 4/10 Moderate 3 unhealthy d/yr today · 5 by 30 yrs out
Nearby sold comps map
Loading sold comps map…
Walkable amenities ~0.75 mi
Loading nearby amenities…
Taxation est. · year 1
- Rental income
- $44,769
- − Mortgage interest
- −$30,192
- − Property taxes
- −$8,085
- − Insurance
- −$2,695
- − Repairs & maintenance
- −$3,582
- − Management
- −$3,582
- − Depreciation
- −$15,680
- Taxable loss
- −$19,046
- Est. tax savings @ 24.0%
- +$4,571
- After-tax cash flow
- $-4,760/yr
For passive investors: Depreciation is non-cash, so a rental often shows a tax loss while cash-flowing — sheltering income. Rental losses are passive: they offset passive income freely, and up to $25,000/yr can offset ordinary (W-2) income if you actively participate and your MAGI is under $100k (phasing out to $0 by $150k); unused losses carry forward. On sale, claimed depreciation is recaptured at up to 25%, and gains may owe capital-gains tax (a 1031 exchange can defer both). Figures are a year-1 estimate at your 24.0% rate — not tax advice; consult a CPA.
Schools (NCES district)
- District
- Eastchester Union Free School District
- NCES district ID
- 3610080
- Math proficiency
- 79% ▲ 1.00%
- Reading proficiency
- 80% ▲ 9.00%
- Median HH income
- $96,944
- Composite
- 71.74/100
- National rank
- #216
- State rank
- #42 of 590 in NY
Livability — Eastchester
- Score
- 78/100
- State rank
- #159
- US rank
- #2451
Category grades
Schools grade is shown separately in the Schools card above.
Census & demographics
- Census place
- Eastchester, NY
- City population
- 10,274
- Population (ZIP)
- 10,274
Population outlook (Westchester County) Hauer SSP2
- Today (2025)
- 1,028,035 people
- By 2030
- 1,051,636 · +2.3%
- By 2040
- 1,098,520 · +6.9%
- By 2050
- 1,136,044 · +10.5%
- By 2075
- 1,196,925 · +16.4%
- By 2100
- 1,175,147 · +14.3%
Race, ethnicity, and origin ACS 2023
- Neighborhood character
- Predominantly White (81%)
- Race & ethnicity
- White 81% Asian 9% Hispanic / Latino 8% Two or more races 7%
- Hispanic origin (detail)
- Puerto Rican 4% Dominican 1%
- Common ancestry
- Scotch-Irish 3% Russian 2% Slovak 2%
- Foreign-born
- 17% · Canada, China, Vietnam
- Languages at home
- 77% English-only · Other Indo-European 9% Spanish 4% Other Asian/Pacific 3%
Political lean MEDSL · Westchester
- 2024 margin
- Strong D (+26.3) · D 63.1% · R 36.9%
- 2008→2024 swing
- -1.3pp toward R · 2008: 27.6pp · 2024: 26.3pp
- All cycles
- 2024: D+26.3 2020: D+36.3 2016: D+32.8 2012: D+22.2 2008: D+27.6
Not yet ingested
- Civics
- —
Market trends
- HPI YoY
- ▼ -75.63%
- Current HPI
- 273.1667
- Rent YoY
- —
- Metro
- —
- State GDP YoY
- ▲ 2.60%
- F500 in state
- 92
Industry mix (Fortune 500 HQ in NY)
| Industry | F500 HQs | Revenue |
|---|---|---|
| Financial Services | 10 | $950B |
|
||
| Consumer Goods | 9 | $162B |
|
||
| Insurance | 4 | $225B |
|
||
| Telecommunications | 2 | $144B |
|
||
| Pharmaceuticals | 2 | $112B |
|
||
| Media / Entertainment | 2 | $69B |
|
||
Price history
1 event — show timeline
- 2026-05-14 Listed $539,000 FSBO.com
Property tax history
+1.8%/yrLatest (2025): $46,186 · +6.8% YoY. Source: county tax records.
Cash-flow waterfall
monthlySold comps — $/sqft
last 12 mo · ≤1 miLoading sold comps…