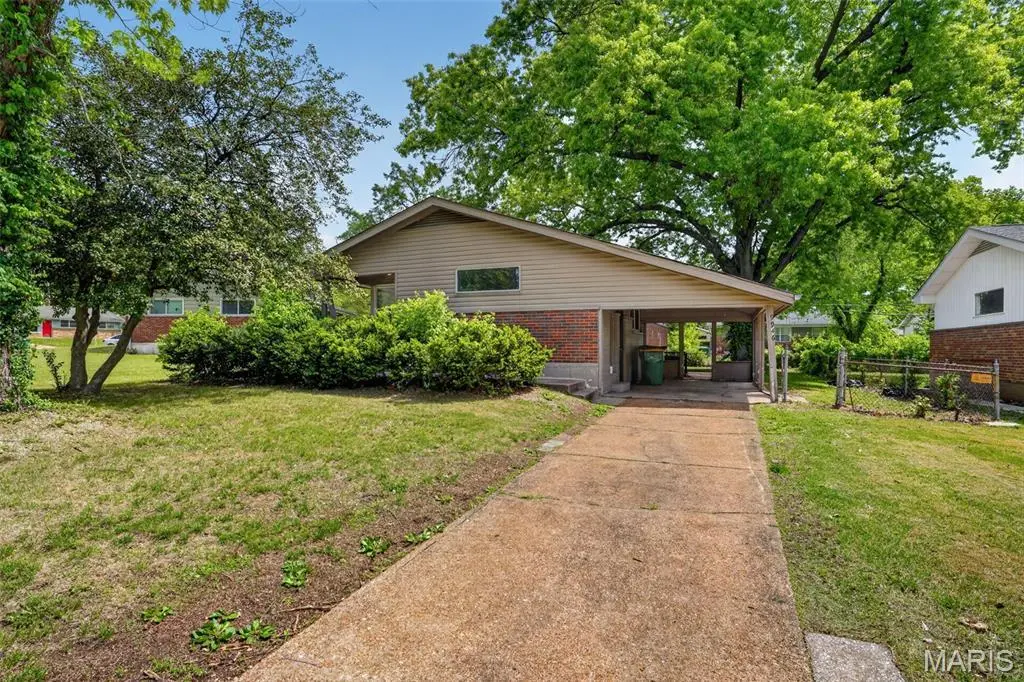
9946 Lanier Dr · Moline Acres, MO
Flood risk 1/10 · Minimal
- FEMA flood zone
- X (unshaded)
- Chance of flooding over 30 yrs
- 0.0%
- Est. flood insurance / yr
- $473 – $860
Fire risk 1/10 · Minimal
- Est. fire insurance / yr
- $1,054 – $1,958
Heat risk 5/10 · Moderate
- Hot days now (above 107°F)
- 7 days/yr
- Hot days in 30 yrs
- 21 days/yr
Wind risk 2/10 · Minimal
- Chance of severe wind over 30 yrs
- 1.0%
Air-quality risk 4/10 · Minor
- Unhealthy air days now
- 5 days/yr
- Unhealthy air days in 30 yrs
- 6 days/yr
Risk factors via First Street. Map © Google.
Why this score? — see what drove the A- grade
The composite is a weighted blend of 9 inputs, each scored 0–100. Each bar is that input's sub-score; the figure is the points it added to the 100-point composite (weight × sub-score).
- Cash flow +30.0/30.0
- ARV discount +15.0/15.0
- 1% rule +10.0/10.0
- DSCR +10.0/10.0
- Appreciation +6.9/10.0
- Rent growth +3.7/5.0
- Livability +3.0/5.0
- Condition / age +2.5/5.0
- Schools +0.4/10.0
$84,900
🖨 Deal sheet 📄 Offer letter ✓ Due diligence
Listing remarks MLS
Welcome to 9946 Lanier Dr, a charming single-story home nestled in a quiet St. Louis neighborhood. This property offers a great opportunity for homeowners or investors alike, featuring a functional layout with comfortable living spaces and plenty of natural light throughout. The spacious yard provides room for outdoor enjoyment, gardening, or future improvements. Conveniently located near major roads, shopping, and local amenities, this home combines accessibility with neighborhood appeal. Whether you're looking to personalize your first home or expand your investment portfolio, this property holds strong potential. Don’t miss your chance to make it your own, schedule your showing today!
Key facts
- Spacious yard
- Natural light
- Outdoor enjoyment
Tags
Neighborhood map
What this means for you Summary
Snapshot
- This is a 3-bed/1.0-bath single-family listed at $85k.
Deal economics
- At list price, monthly cash flow is $416 ($5k/yr) — positive.
- The deal already cash-flows at list — no discount required.
- Meets the 1% rule at list price ($1k rent vs $85k).
- Recommended offer: $82k (3.0% below list) — sets the bar for market timing.
Location & tenants
- Location reads 60/100 on livability (#480 in MO) — a middle-class / working-renter tenant base. Strengths: cost of living A+, housing A-; Watch: health & safety C-, employment D, schools F.
- Riverview Gardens (suburban): math 2% / reading 9% proficiency, ranked #324 of 324 in MO (top 100%) — low school quality limits family demand, transient renter base, plan for 1-2y turnover; 90% free/reduced lunch — lower-income household profile, screen leases tightly.
- Market conditions: Rents rising fast (+5.0%/yr); 372 active listings in the ZIP; 40 comparable units currently listed for rent nearby; rentals at typical pace (median 24d on market — plan ~3-4 weeks tenant-placement turnaround); lower-income renter base — watch delinquency; 920 units permitted in St. Louis County in 2024 (250 in 5+ unit buildings).
- This rent runs 38% of the median local income ($41k/yr) — at the standard rent-burdened threshold; future hikes will face affordability resistance.
Forward outlook
- In year one you build about $4k of equity ($587 loan paydown + $3k appreciation (3.8% local appreciation)).
- At projected returns (3.8% appreciation + 5.0% rent growth), your $24k cash investment doubles in ~3 years — after that, you're playing with house money.
- By year 9, paydown + projected appreciation supports a ~$33k cash-out refi (75% LTV) — recoverable capital for the next deal without selling this one.
Negotiation context
- It's been on market 57 days — a 3% lower offer ($82k) is reasonable based on typical stale-listing flexibility.
- 3 sale attempts since 10y ago; this cycle's ask has dropped $15k (15%) from the opening price — seller is motivated, your offer sets the floor, not the list.
- Current owner paid $51k; list at $85k implies a 66% gain — meaningful room to come down on a strong offer.
Risks & watch-outs
- Watch-outs: built in 1954 — expect roof / HVAC / electrical / plumbing capex.
- Climate carrying-cost: extreme-heat days projected 7→21/yr by 2055 (HVAC capex compounding) — expect insurance premiums to compound above CPI over the hold.
Questions for the listing agent
- It's been on market 57 days. Have you received any prior offers? Is the seller open to a 3% concession, seller financing, or rate buy-down credit?
- Built in 1954 — when were the roof, HVAC, electrical panel, plumbing, and water heater last replaced?
- Is there a deadline driving the sale (1031 exchange, divorce, estate, relocation)? That informs how much negotiation room exists.
- Schools are F-rated, which usually means shorter tenancies and higher turnover. Who's the typical renter profile here, and what's been the actual vacancy rate?
- Crime grade is F in this area — have there been break-ins, vandalism, or insurance claims at this property in the last 3 years? What carrier currently insures it and at what premium?
- What's the average days-on-market for RENTAL listings here right now (not sales)? A rising rental-DOM trend means longer vacancies and softer asking-rent achievability than the comps imply.
- What's the recent tenant-quality profile in this submarket — average credit score on applications, eviction rate, late-payment / NSF rate, and stable-employment percentage? A property-management company in the area should have these aggregated.
- How much new for-sale + rental construction is in the pipeline within 1–3 miles? Heavy new supply typically softens prices + rents 12–24 months out; constrained supply supports both.
Investment metrics
- 1% rule
- 1.54% ✓
- Cap rate
- 12.18%
- Cash-on-cash
- 21.02%
- DSCR
- 1.94
- GRM
- 5.4
CMA / ARV
- ARV (median comp)
- $104,472
- List price
- $84,900
- Delta
- -18.73%
- Verdict
- UNDERPRICED
- Comps
- 20 within 1.0 mi
Show comp detail 12 sales within ~0.75 mi
| Address | Dist | Beds/Ba | Sqft | Sold | Price | $/sf | Match |
|---|---|---|---|---|---|---|---|
| 2360 Chambers Rd | 0.13mi | 2/1.0 (-1) | 1,168 (+1%) | 1mo | $44,900 | $38 | 87 |
| 2225 Kerwin Dr | 0.29mi | 3/1.0 | 1,135 (-2%) | 2mo | $135,900 | $120 | 82 |
| 9939 Duke Dr | 0.03mi | 3/1.0 | 1,040 (-10%) | 3mo | $102,000 | $98 | 79 |
| 10139 Edgefield Dr | 0.52mi | 3/2.0 | 1,140 (-2%) | 0mo | $119,900 | $105 | 69 |
| 2442 Gardner Dr | 0.24mi | 3/2.0 | 1,054 (-9%) | 2mo | $59,900 | $57 | 68 |
| 9850 Monarch Dr | 0.17mi | 3/2.0 | 1,014 (-12%) | 2mo | $99,900 | $99 | 65 |
| 9742 Wendell Dr | 0.28mi | 3/1.0 | 1,014 (-12%) | 2mo | $69,900 | $69 | 64 |
| 9828 Omega Dr | 0.33mi | 3/1.0 | 988 (-15%) | 0mo | $100,000 | $101 | 60 |
| 10217 Viscount Dr | 0.61mi | 3/2.0 | 1,205 (+4%) | 2mo | $149,000 | $124 | 59 |
| 1331 Norchester Dr | 0.51mi | 3/2.0 | 1,240 (+7%) | 2mo | $209,900 | $169 | 58 |
| 10231 Monarch Dr | 0.59mi | 3/2.0 | 1,073 (-7%) | 1mo | $189,999 | $177 | 55 |
| 10127 Monarch Dr | 0.47mi | 3/1.5 | 1,015 (-12%) | 1mo | $155,000 | $153 | 55 |
Match score weights: distance 35% · size 25% · config 20% · recency 20%. Top-matched comps best support the ARV.
Projected returns pro-forma
3.79% appreciation · 4.97% rent growth · sell at horizon
- IRR
- 30.3%
- Equity multiple
- 2.81×
- Total profit
- $43,042
- Equity at exit
- $42,008
- IRR
- 31.1%
- Equity multiple
- 5.88×
- Total profit
- $116,001
- Equity at exit
- $67,891
Cash invested: $23,772 (down + closing). Projections, not guarantees.
Landlord ↔ Tenant lean methodology
- Overall (STATE)
- 81 Strongly Landlord-Friendly
- State Missouri
- 81 Strongly Landlord-Friendly · R+10
- County
- — inherits STATE
- City
- — inherits STATE
ZIP-level market 63136
- Home prices YoY
- 0.9%
- Rents YoY
- 5.0%
- Active inventory
- 372
- Price-to-rent
- 5.4×
Monthly cashflow live
- Estimated rent
- $1,310 high interval (Pro) →
- Mortgage (P&I)
- −$445
- Tax from tax record
- −$138 /mo · $1,654/yr
- Insurance
- −$35
- HOA
- −$0
- Vacancy / Maint / Mgmt
- −$275
- Net cashflow
- $416
Break-even live
UW: 25.0% down · 7.5% · 30yr · 1.5% tax · 5.0% vac · 8.0% maint · 8.0% mgmt
Financing live
Cash to close
- Down payment
- $21,225
- Closing costs
- $2,547
- Reserves months
- —
- Total cash needed
- —
Loan-product check · same deal, 3 products live
Conventional
25% down · 7.5% · 30yr
- Down + closing
- —
- Monthly P&I
- —
- Monthly cashflow
- —
- DSCR
- —
- Eligible?
- —
Personal DTI + credit; lowest rate.
DSCR
20% down · 8.5% · 30yr
- Down + closing
- —
- Monthly P&I
- —
- Monthly cashflow
- —
- DSCR
- —
- Eligible?
- —
No personal income docs; deal must DSCR.
Hard money
10% down · 12.0% · 12mo
- Down + closing
- —
- Monthly P&I
- —
- Monthly cashflow
- —
- DSCR
- —
- Eligible?
- —
Short-term bridge; refi at stabilization.
Rent comps 40 comps
| Address | Beds | Baths | Sqft | Rent | $/sqft | DOM | Units | Dist |
|---|---|---|---|---|---|---|---|---|
| 2321 Noll Dr Saint Louis, MO | 3.0 | 1.0 | 975 | $1,320 | $1.35 | 23d | 1 | 0.06mi |
| 2326 Chambers Rd Saint Louis, MO | 2.0 | 1.0 | 1056 | $1,050 | $0.99 | 23d | 1 | 0.15mi |
| 9744 Lanier Dr Saint Louis, MO | 3.0 | 1.0 | 1014 | $1,345 | $1.33 | 43d | 1 | 0.24mi |
| 2257 Chambers Rd Saint Louis, MO | 3.0 | 1.0 | 1200 | $1,400 | $1.17 | 23d | 1 | 0.26mi |
| 10113 Duke Dr Saint Louis, MO | 3.0 | 1.0 | 770 | $1,325 | $1.72 | 43d | 1 | 0.34mi |
| 10112 Count Dr Saint Louis, MO | 2.0 | 1.0 | 792 | $1,000 | $1.26 | 7d | 1 | 0.34mi |
| 10113 Count Dr Saint Louis, MO | 2.0 | 1.0 | 882 | $775 | $0.88 | 43d | 1 | 0.35mi |
| 9723 Portage Dr Saint Louis, MO | 3.0 | 1.0 | 1014 | $1,450 | $1.43 | 7d | 1 | 0.36mi |
| 10139 Royal Dr Saint Louis, MO | 2.0 | 1.0 | 1016 | $900 | $0.89 | 43d | 1 | 0.40mi |
| 9908 Norbridge Ln Saint Louis, MO | 2.0 | 2.0 | 1240 | $1,650 | $1.33 | 19d | 1 | 0.49mi |
| 2152 Nemnich Rd Saint Louis, MO | 2.0 | 1.5 | 1030 | $1,100 | $1.07 | 43d | 1 | 0.60mi |
| 10322 Monarch Dr Saint Louis, MO | 3.0 | 2.0 | 1073 | $1,728 | $1.61 | 23d | 1 | 0.67mi |
| 10365 Lord Dr Saint Louis, MO | 3.0 | 1.0 | 864 | $1,075 | $1.24 | 2d | 1 | 0.71mi |
| 1520 Attica Dr Saint Louis, MO | 2.0 | 1.0 | 1062 | $1,200 | $1.13 | 23d | 1 | 0.71mi |
| 10404 Earl Dr Saint Louis, MO | 2.0 | 1.0 | 770 | $1,100 | $1.43 | 4d | 1 | 0.74mi |
| 10409 Count Dr Saint Louis, MO | 3.0 | 1.0 | 912 | $1,100 | $1.21 | 21d | 1 | 0.75mi |
| 10129 Cavalier Ct Saint Louis, MO | 3.0 | 1.5 | 912 | $1,250 | $1.37 | 23d | 1 | 0.76mi |
| 2008 Kappel Dr Saint Louis, MO | 3.0 | 1.0 | 858 | $1,175 | $1.37 | 23d | 1 | 0.76mi |
| 10421 Prince Dr Saint Louis, MO | 3.0 | 2.0 | 1023 | $1,275 | $1.25 | 23d | 1 | 0.79mi |
| 1255 Bosworth Dr Saint Louis, MO | 3.0 | 1.0 | 1071 | $1,575 | $1.47 | 10d | 1 | 0.84mi |
| 10441 Prince Dr Saint Louis, MO | 4.0 | 1.5 | 1380 | $1,380 | $1.00 | 43d | 1 | 0.84mi |
| 10501 Duke Dr Saint Louis, MO | 2.0 | 1.0 | 1140 | $1,090 | $0.96 | 43d | 1 | 0.87mi |
| 10128 Cloverdale Dr Saint Louis, MO | 2.0 | 1.0 | 792 | $1,000 | $1.26 | 43d | 1 | 0.88mi |
| 10128 Cloverdale Dr Saint Louis, MO | 2.0 | 1.0 | 792 | $1,000 | $1.26 | 23d | 1 | 0.88mi |
| 10504 Baron Dr Saint Louis, MO | 3.0 | 1.0 | 1000 | $1,300 | $1.30 | 7d | 1 | 0.89mi |
| 10078 Green Valley Dr Saint Louis, MO | 3.0 | 1.0 | 900 | $1,325 | $1.47 | 7d | 1 | 0.90mi |
| 10512 Count Dr Saint Louis, MO | 3.0 | 1.0 | 888 | $1,195 | $1.35 | 14d | 1 | 0.90mi |
| 1926 Chambers Rd Saint Louis, MO | 4.0 | 1.0 | 1095 | $995 | $0.91 | 14d | 1 | 0.92mi |
| 9827 Winkler Dr Saint Louis, MO | 3.0 | 1.0 | 864 | $1,450 | $1.68 | 7d | 1 | 0.95mi |
| 9823 Winkler Dr Saint Louis, MO | 2.0 | 1.0 | 788 | $900 | $1.14 | 43d | 1 | 0.95mi |
| 10124 Winkler Dr Saint Louis, MO | 2.0 | 1.0 | 792 | $1,400 | $1.77 | 3d | 1 | 0.98mi |
| 9812 Balboa Dr Saint Louis, MO | 4.0 | 2.0 | 1500 | $1,495 | $1.00 | 21d | 1 | 0.99mi |
| 1130 Forest Home Dr Saint Louis, MO | 3.0 | 1.0 | 1025 | $1,275 | $1.24 | 43d | 1 | 0.99mi |
| 13061 Lord Dr St. Louis, MO | 2.0 | 1.0 | 900 | $1,040 | $1.16 | 21d | 1 | 1.00mi |
| 10557 Castle Dr Saint Louis, MO | 3.0 | 2.0 | 1023 | $1,300 | $1.27 | 14d | 1 | 1.02mi |
| 9709 Balboa Dr Saint Louis, MO | 3.0 | 1.0 | 1000 | $1,600 | $1.60 | 43d | 1 | 1.03mi |
| 1253 Avant Dr Saint Louis, MO | 2.0 | 1.0 | 795 | $1,295 | $1.63 | 14d | 1 | 1.09mi |
| 1253 Avant Dr Saint Louis, MO | 2.0 | 1.0 | 795 | $1,295 | $1.63 | 17d | 1 | 1.09mi |
| 10239 Green Valley Dr Saint Louis, MO | 3.0 | 1.0 | 1014 | $1,395 | $1.38 | 23d | 1 | 1.12mi |
| 10200 Tappan Dr Saint Louis, MO | 3.0 | 1.0 | 912 | $1,450 | $1.59 | 16d | 1 | 1.12mi |
Listing history 28 events
-
2026-06-18days on market $84,900 Active 57 DOM
-
2026-06-17days on market $84,900 Active 56 DOM
-
2026-06-16days on market $84,900 Active 55 DOM
-
2026-06-15days on market $84,900 Active 54 DOM
-
2026-06-13days on market $84,900 Active 52 DOM
-
2026-06-13pricedays on market $84,900 Active 51 DOM
-
2026-06-09days on market $94,900 Active 48 DOM
-
2026-06-08days on market $94,900 Active 47 DOM
-
2026-06-07days on market $94,900 Active 46 DOM
-
2026-06-05days on market $94,900 Active 43 DOM
-
2026-06-03days on market $94,900 Active 42 DOM
-
2026-06-02days on market $94,900 Active 41 DOM
-
2026-06-01days on market $94,900 Active 40 DOM
-
2026-05-31days on market $94,900 Active 39 DOM
-
2026-04-22$99,900 Active 702-char remark
Show marketing remark (702 chars)
Welcome to 9946 Lanier Dr, a charming single-story home nestled in a quiet St. Louis neighborhood. This property offers a great opportunity for homeowners or investors alike, featuring a functional layout with comfortable living spaces and plenty of natural light throughout. The spacious yard provides room for outdoor enjoyment, gardening, or future improvements. Conveniently located near major roads, shopping, and local amenities, this home combines accessibility with neighborhood appeal. Whether you're looking to personalize your first home or expand your investment portfolio, this property holds strong potential. Don’t miss your chance to make it your own, schedule your showing today!
-
2020-08-25soldstatus $51,000
-
2020-08-20status Pending 771-char remark
Show marketing remark (771 chars)
3 Bed, 1 bath, plus attached carport. Property has recently been updated with Newer Plumbing, Appliances, Fixtures, Paint, Flooring, Property will offer years of low maintenance. Great Tenant at $800.00/ Month, this property is ready to start cash-flowing from day one!. To be sold in a package of (7) homes all within short-distance of each other and all of equal or better quality with solid tenants. A great opportunity for someone to expand their portfolio with quality properties. Seller may consider, parceling out the package. PACKAGE Consists of: 8030 Titus, 63114 - MLS# 20045573 - 8112 Titus 63114 MLS# 20045577- 2021 N. Hanley MLS# 200045558- 9946 Lanier MLS# 20045556 - 5409 Fletcher MLS# 20045546 - 2527 Switzer MLS# 20045540 - 10134 Edgefield MLS#20045507
-
2020-08-20soldstatus Closed 771-char remark
Show marketing remark (771 chars)
3 Bed, 1 bath, plus attached carport. Property has recently been updated with Newer Plumbing, Appliances, Fixtures, Paint, Flooring, Property will offer years of low maintenance. Great Tenant at $800.00/ Month, this property is ready to start cash-flowing from day one!. To be sold in a package of (7) homes all within short-distance of each other and all of equal or better quality with solid tenants. A great opportunity for someone to expand their portfolio with quality properties. Seller may consider, parceling out the package. PACKAGE Consists of: 8030 Titus, 63114 - MLS# 20045573 - 8112 Titus 63114 MLS# 20045577- 2021 N. Hanley MLS# 200045558- 9946 Lanier MLS# 20045556 - 5409 Fletcher MLS# 20045546 - 2527 Switzer MLS# 20045540 - 10134 Edgefield MLS#20045507
-
2020-07-20historical Active Under Contract 771-char remark
Show marketing remark (771 chars)
3 Bed, 1 bath, plus attached carport. Property has recently been updated with Newer Plumbing, Appliances, Fixtures, Paint, Flooring, Property will offer years of low maintenance. Great Tenant at $800.00/ Month, this property is ready to start cash-flowing from day one!. To be sold in a package of (7) homes all within short-distance of each other and all of equal or better quality with solid tenants. A great opportunity for someone to expand their portfolio with quality properties. Seller may consider, parceling out the package. PACKAGE Consists of: 8030 Titus, 63114 - MLS# 20045573 - 8112 Titus 63114 MLS# 20045577- 2021 N. Hanley MLS# 200045558- 9946 Lanier MLS# 20045556 - 5409 Fletcher MLS# 20045546 - 2527 Switzer MLS# 20045540 - 10134 Edgefield MLS#20045507
-
2020-07-02$53,000 Active 771-char remark
Show marketing remark (771 chars)
3 Bed, 1 bath, plus attached carport. Property has recently been updated with Newer Plumbing, Appliances, Fixtures, Paint, Flooring, Property will offer years of low maintenance. Great Tenant at $800.00/ Month, this property is ready to start cash-flowing from day one!. To be sold in a package of (7) homes all within short-distance of each other and all of equal or better quality with solid tenants. A great opportunity for someone to expand their portfolio with quality properties. Seller may consider, parceling out the package. PACKAGE Consists of: 8030 Titus, 63114 - MLS# 20045573 - 8112 Titus 63114 MLS# 20045577- 2021 N. Hanley MLS# 200045558- 9946 Lanier MLS# 20045556 - 5409 Fletcher MLS# 20045546 - 2527 Switzer MLS# 20045540 - 10134 Edgefield MLS#20045507
-
2016-09-06soldstatus Closed
-
2016-08-04status Pending
-
2016-07-11$24,900 Active
-
2016-06-09price $27,500
-
1996-09-05soldstatus
-
1991-12-17soldstatus $53,000
-
1991-04-25soldstatus
-
1990-10-01soldstatus $58,362
ⓘ Source: listings_history table (triggers on properties + properties_extension) + one-shot
backfill from property_details.listing_events for pre-trigger history.
Tax reassessment forecast MO · Resets to sale price
- Current annual tax
- $1,654 · $138/mo
- Projected year-2 tax
- $1,654 · $138/mo
- Expected delta
- $0/yr ($0/mo · -0.0%)
ⓘ Screening estimate from a state-policy table — verify with the county assessor before closing.
Climate risk First Street
- Flood 1/10 Low FEMA zone X (unshaded) · 0% chance over 30 yrs
- Wildfire 1/10 Low
- Heat 5/10 Major 7 d/yr ≥107°F today · 21 d/yr by 30 yrs out
- Wind 2/10 Low 100% chance of damaging wind over 30 yrs
- Air quality 4/10 Moderate 5 unhealthy d/yr today · 6 by 30 yrs out
Nearby sold comps map
Loading sold comps map…
Walkable amenities ~0.75 mi
Loading nearby amenities…
Taxation est. · year 1
- Rental income
- $15,720
- − Mortgage interest
- −$4,756
- − Property taxes
- −$1,654
- − Insurance
- −$424
- − Repairs & maintenance
- −$1,258
- − Management
- −$1,258
- − Depreciation
- −$2,470
- Taxable income
- $3,901
- Est. tax owed @ 24.0%
- −$936
- After-tax cash flow
- $4,061/yr
For passive investors: Depreciation is non-cash, so a rental often shows a tax loss while cash-flowing — sheltering income. Rental losses are passive: they offset passive income freely, and up to $25,000/yr can offset ordinary (W-2) income if you actively participate and your MAGI is under $100k (phasing out to $0 by $150k); unused losses carry forward. On sale, claimed depreciation is recaptured at up to 25%, and gains may owe capital-gains tax (a 1031 exchange can defer both). Figures are a year-1 estimate at your 24.0% rate — not tax advice; consult a CPA.
Schools (NCES district)
- District
- Riverview Gardens
- NCES district ID
- 2926670
- Math proficiency
- 2% ▼ -6.00%
- Reading proficiency
- 9% ▼ -6.00%
- Median HH income
- $32,759
- Composite
- 4.22/100
- National rank
- #10058
- State rank
- #324 of 324 in MO
Livability — Moline Acres
- Score
- 60/100
- State rank
- #480
- US rank
- #18899
Category grades
Schools grade is shown separately in the Schools card above.
Census & demographics
- Census place
- Moline Acres, MO
- County
- Saint Louis County · 888,823 people
- Metro
- St. Louis, MO-IL
- Population (ZIP)
- 40,929
- Household income
- $41,154
- Rent vs Own
- Severe rent burden
- 3085.0
Population outlook (St. Louis County) Hauer SSP2
- Today (2025)
- 1,025,227 people
- By 2030
- 1,028,023 · +0.3%
- By 2040
- 1,020,940 · -0.4%
- By 2050
- 1,007,280 · -1.8%
- By 2075
- 987,277 · -3.7%
- By 2100
- 921,984 · -10.1%
Race, ethnicity, and origin ACS 2023
- Neighborhood character
- Predominantly Black (90%)
- Race & ethnicity
- Black 90% White 5% Two or more races 3%
- Foreign-born
- 1% · Canada
Political lean MEDSL · St. Louis
- 2024 margin
- Strong D (+23.4) · D 60.8% · R 37.4% · Other 1.7%
- 2008→2024 swing
- +3.5pp toward D · 2008: 19.9pp · 2024: 23.4pp
- All cycles
- 2024: D+23.4 2020: D+24.0 2016: D+16.2 2012: D+13.7 2008: D+19.9
Not yet ingested
- Civics
- —
Market trends
- HPI YoY
- ▲ 3.79%
- Current HPI
- 420.28
- Rent YoY
- ▲ 4.97%
- Metro
- St. Louis, MO-IL
- State GDP YoY
- ▲ 1.84%
- F500 in state
- 20
Industry mix (Fortune 500 HQ in MO)
| Industry | F500 HQs | Revenue |
|---|---|---|
| Healthcare | 1 | $163B |
|
||
| Insurance | 1 | $21B |
|
||
| Industrial Technology | 1 | $17B |
|
||
| Retail | 1 | $16B |
|
||
| Industrial Distribution | 1 | $10B |
|
||
| Utilities | 1 | $9B |
|
||
Price history
+71.2% since first listed14 events — show timeline
- 2026-04-22 Listed $99,900 MARIS as Distributed by MLS Grid
- 2020-08-25 Sold (Public Records) $51,000 Public Records
- 2020-08-20 Pending — MARIS as Distributed by MLS Grid
- 2020-08-20 Sold (MLS) — MARIS as Distributed by MLS Grid
- 2020-07-20 Contingent — MARIS as Distributed by MLS Grid
- 2020-07-02 Listed $53,000 MARIS as Distributed by MLS Grid
- 2016-09-06 Sold (MLS) — MARIS as Distributed by MLS Grid
- 2016-08-04 Pending — MARIS as Distributed by MLS Grid
- 2016-07-11 Listed $24,900 MARIS as Distributed by MLS Grid
- 2016-06-09 Price Changed $27,500 MARIS as Distributed by MLS Grid
- 1996-09-05 Sold (Public Records) — Public Records
- 1991-12-17 Sold (Public Records) $53,000 Public Records
- 1991-04-25 Sold (Public Records) — Public Records
- 1990-10-01 Sold (Public Records) $58,362 Public Records
Property tax history
+3.9%/yrLatest (2022): $1,654 · +0.3% YoY. Source: county tax records.
Cash-flow waterfall
monthlySold comps — $/sqft
last 12 mo · ≤1 miLoading sold comps…