2812 Cynwood St · Lansing, MI
Flood risk 1/10 · Minimal
- FEMA flood zone
- X (unshaded)
- Chance of flooding over 30 yrs
- 0.0%
- Est. flood insurance / yr
- $473 – $860
Fire risk 1/10 · Minimal
- Est. fire insurance / yr
- $784 – $1,456
Heat risk 3/10 · Minor
- Hot days now (above 97°F)
- 7 days/yr
- Hot days in 30 yrs
- 16 days/yr
Wind risk 2/10 · Minimal
- Chance of severe wind over 30 yrs
- —
Air-quality risk 2/10 · Minimal
- Unhealthy air days now
- 1 days/yr
- Unhealthy air days in 30 yrs
- 2 days/yr
Risk factors via First Street. Map © Google.
Why this score? — see what drove the B grade
The composite is a weighted blend of 9 inputs, each scored 0–100. Each bar is that input's sub-score; the figure is the points it added to the 100-point composite (weight × sub-score).
- Cash flow +30.0/30.0
- 1% rule +10.0/10.0
- DSCR +10.0/10.0
- ARV discount +7.5/15.0
- Rent growth +5.0/5.0
- Livability +4.0/5.0
- Condition / age +2.5/5.0
- Schools +1.9/10.0
- Appreciation +0.0/10.0
$29,903
🖨 Deal sheet 📄 Offer letter ✓ Due diligence
Listing remarks MLS
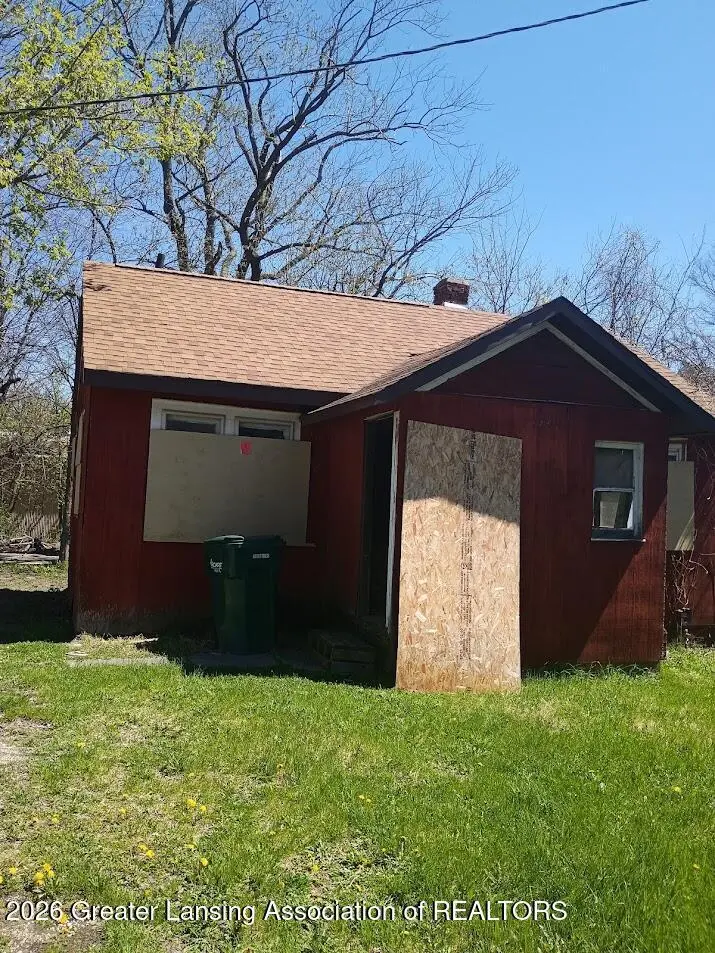
2bedroom ready for your rehab and creative thoughts. The home features a newer roof, 2bedrooms, 1 bath and a great yard! Location is easy to shopping, near bus route, short drive to downtown, old town or college campus. This would make a great investment property as a rental or flip. Schedule your viewing today!
Key facts
- Newer roof
- Great yard
- Near bus route
Tags
Property features AI
Finance
- Financial info: Current use listed as investment
Exterior
- Parking: Driveway and on-site parking; No attached garage
- Utilities: Public sewer; Sewer, natural gas, and electricity connected
- Home design: One-level home; Built in 1925; Road frontage on a city street
- Construction: Hardboard exterior; Built in 1925
- Exterior features: Front and back yard on a city lot; Front porch; Shingle roof; Paved road frontage
Interior
- Kitchen: Kitchen (appliance details not provided)
- Bedrooms: 2 bedrooms (including primary bedroom)
- Bathrooms: 1 full bathroom
- Heating & cooling: Forced air heating; No cooling
- Interior features: Main-level laundry; Michigan-style basement
- Laundry & utility: Laundry located on main level
Neighborhood map
What this means for you Summary
Snapshot
- This is a 1-bed/1.0-bath single-family listed at $30k.
Deal economics
- At list price, monthly cash flow is $491 ($6k/yr) — positive.
- The deal already cash-flows at list — no discount required.
- Meets the 1% rule at list price ($883 rent vs $30k).
- Recommended offer: $29k (3.0% below list) — sets the bar for market timing.
- Cap rate 26.0% vs local median 6.0% in Lansing — top-decile yield for the area; either an underpriced asset or a hidden risk that comps aren't pricing in. Stress-test before assuming the spread holds.
Location & tenants
- Location reads 79/100 on livability (#94 in MI, #2,182 nationally) — a middle-class / working-renter tenant base. Strengths: amenities A+, commute A+, cost of living A+; Watch: employment D, schools F, crime F.
- Lansing Public School District (urban): math 14% / reading 23% proficiency, ranked #650 of 760 in MI (top 86%) — low school quality limits family demand, transient renter base, plan for 1-2y turnover; 68% free/reduced lunch — lower-income household profile, screen leases tightly.
- Market conditions: Rents rising fast (+10.5%/yr); 138 active listings in the ZIP; 9 comparable units currently listed for rent nearby; rentals lingering (median 44d on market — plan ~5-8 weeks vacancy on turnover, expect pricing pressure); 78% of comp listings sitting > 30 days — soft ceiling on asking rent; 350 units permitted in Ingham County in 2024 (186 in 5+ unit buildings).
- This rent is only 16% of the median local income ($64k/yr) — well below the 30% rent-burden line; pricing power to push rent on renewal without tenant pushback.
Forward outlook
- Local home prices are declining (-3.0%/yr); year-one equity from $206 of loan paydown is wiped out by about $897 of value loss. Plan a longer hold.
- Ingham County population projected at +11% by 2050 — modest demand growth; plan on rents tracking national, not racing it.
- At projected returns (-3.0% appreciation + 8.0% rent growth), your $8k cash investment doubles in ~2 years — after that, you're playing with house money.
Negotiation context
- It's been on market 56 days — a 3% lower offer ($29k) is reasonable based on typical stale-listing flexibility.
- 2 sale attempts; this cycle's ask has dropped $10k (25%) from the opening price — seller is motivated, your offer sets the floor, not the list.
Risks & watch-outs
- Watch-outs: built in 1925 — expect roof / HVAC / electrical / plumbing capex.
Questions for the listing agent
- It's been on market 56 days. Have you received any prior offers? Is the seller open to a 3% concession, seller financing, or rate buy-down credit?
- Built in 1925 — when were the roof, HVAC, electrical panel, plumbing, and water heater last replaced?
- Is there a deadline driving the sale (1031 exchange, divorce, estate, relocation)? That informs how much negotiation room exists.
- Schools are F-rated, which usually means shorter tenancies and higher turnover. Who's the typical renter profile here, and what's been the actual vacancy rate?
- Crime grade is F in this area — have there been break-ins, vandalism, or insurance claims at this property in the last 3 years? What carrier currently insures it and at what premium?
- What's the average days-on-market for RENTAL listings here right now (not sales)? A rising rental-DOM trend means longer vacancies and softer asking-rent achievability than the comps imply.
- What's the recent tenant-quality profile in this submarket — average credit score on applications, eviction rate, late-payment / NSF rate, and stable-employment percentage? A property-management company in the area should have these aggregated.
- How much new for-sale + rental construction is in the pipeline within 1–3 miles? Heavy new supply typically softens prices + rents 12–24 months out; constrained supply supports both.
Investment metrics
- 1% rule
- 2.95% ✓
- Cap rate
- 26.00%
- Cash-on-cash
- 70.37%
- DSCR
- 4.13
- GRM
- 2.8
CMA / ARV
- ARV (median comp)
- $91,273
- List price
- $29,903
- Delta
- -67.24%
- Verdict
- UNDERPRICED
- Comps
- 20 within 1.0 mi
Show comp detail 3 sales within ~0.75 mi
| Address | Dist | Beds/Ba | Sqft | Sold | Price | $/sf | Match |
|---|---|---|---|---|---|---|---|
| 1523 Downey St | 0.14mi | 2/1.0 (+1) | 639 (+15%) | 9mo | $97,000 | $152 | 56 |
| 816 Cypress St | 0.74mi | 2/1.0 (+1) | 600 (+8%) | 15mo | $58,000 | $97 | 35 |
| 1510 Roseneath Ave | 0.72mi | 2/1.0 (+1) | 616 (+11%) | 23mo | $72,500 | $118 | 25 |
Match score weights: distance 35% · size 25% · config 20% · recency 20%. Top-matched comps best support the ARV.
Projected returns pro-forma
-3.0% appreciation · 8.0% rent growth · sell at horizon
- IRR
- 75.5%
- Equity multiple
- 4.72×
- Total profit
- $31,106
- Equity at exit
- $4,459
- IRR
- 80.6%
- Equity multiple
- 11.59×
- Total profit
- $88,649
- Equity at exit
- $2,585
Cash invested: $8,373 (down + closing). Projections, not guarantees.
Landlord ↔ Tenant lean methodology
- Overall (STATE)
- 62 Landlord-Friendly
- State Michigan
- 62 Landlord-Friendly · EVEN
- County
- — inherits STATE
- City
- — inherits STATE
ZIP-level market 48906
- Rents YoY
- 10.5%
- Active inventory
- 138
- Price-to-rent
- 2.8×
Monthly cashflow live
- Estimated rent
- $883 high interval (Pro) →
- Mortgage (P&I)
- −$157
- Tax est. 1.5%
- −$37 /mo · $449/yr
- Insurance
- −$12
- HOA
- −$0
- Vacancy / Maint / Mgmt
- −$185
- Net cashflow
- $491
Break-even live
UW: 25.0% down · 7.5% · 30yr · 1.5% tax · 5.0% vac · 8.0% maint · 8.0% mgmt
Financing live
Cash to close
- Down payment
- $7,476
- Closing costs
- $897
- Reserves months
- —
- Total cash needed
- —
Loan-product check · same deal, 3 products live
Conventional
25% down · 7.5% · 30yr
- Down + closing
- —
- Monthly P&I
- —
- Monthly cashflow
- —
- DSCR
- —
- Eligible?
- —
Personal DTI + credit; lowest rate.
DSCR
20% down · 8.5% · 30yr
- Down + closing
- —
- Monthly P&I
- —
- Monthly cashflow
- —
- DSCR
- —
- Eligible?
- —
No personal income docs; deal must DSCR.
Hard money
10% down · 12.0% · 12mo
- Down + closing
- —
- Monthly P&I
- —
- Monthly cashflow
- —
- DSCR
- —
- Eligible?
- —
Short-term bridge; refi at stabilization.
Rent comps 9 comps
| Address | Beds | Baths | Sqft | Rent | $/sqft | DOM | Units | Dist |
|---|---|---|---|---|---|---|---|---|
| 1443 Roselawn Ave Lansing, MI | 2.0 | 1.0 | 656 | $750 | $1.14 | 43d | 1 | 0.73mi |
| 1216 N Chestnut St Lansing, MI | 1.0 | 1.0 | 562 | $900 | $1.60 | 13d | 1 | 1.15mi |
| 4515 N Grand River Ave Lansing, MI | 1.0–2.0 | 1.0 | 712 | $725 | $1.02 | 13d | 1 | 1.16mi |
| 1010 N Pine St Unit B Lansing, MI | 2.0 | 1.0 | 750 | $1,100 | $1.47 | 43d | 1 | 1.27mi |
| 1016 N Capitol Ave Unit 1 Lansing, MI | 1.0 | 1.0 | 700 | $850 | $1.21 | 43d | 1 | 1.42mi |
| 1016 N Capitol Ave Unit 3 Lansing, MI | 1.0 | 1.0 | 500 | $800 | $1.60 | 43d | 1 | 1.42mi |
| 917 Seymour Ave Unit 3 Lansing, MI | 1.0 | 1.0 | 475 | $800 | $1.68 | 43d | 1 | 1.44mi |
| 1025 N Washington Ave Unit 9 Lansing, MI | 1.0 | 1.0 | 670 | $1,000 | $1.49 | 43d | 1 | 1.44mi |
| 826 N Walnut St Lansing, MI | 1.0 | 1.0 | 700 | $700 | $1.00 | 43d | 2 | 1.47mi |
Listing history 20 events
-
2026-06-18days on market $29,903 Active 56 DOM
-
2026-06-17days on market $29,903 Active 55 DOM
-
2026-06-16days on market $29,903 Active 54 DOM
-
2026-06-15days on market $29,903 Active 53 DOM
-
2026-06-14days on market $29,903 Active 51 DOM
-
2026-06-13days on market $29,903 Active 50 DOM
-
2026-06-10days on market $29,903 Active 48 DOM
-
2026-06-09days on market $29,903 Active 47 DOM
-
2026-06-08days on market $29,903 Active 46 DOM
-
2026-06-07days on market $29,903 Active 45 DOM
-
2026-06-05days on market $29,903 Active 42 DOM
-
2026-06-03days on market $29,903 Active 41 DOM
-
2026-06-02days on market $29,903 Active 40 DOM
-
2026-06-01days on market $29,903 Active 39 DOM
-
2026-05-31days on market $29,903 Active 38 DOM
-
2026-05-30days on market $29,903 Active 37 DOM
-
2026-05-07price $37,901 313-char remark
Show marketing remark (313 chars)
2bedroom ready for your rehab and creative thoughts. The home features a newer roof, 2bedrooms, 1 bath and a great yard! Location is easy to shopping, near bus route, short drive to downtown, old town or college campus. This would make a great investment property as a rental or flip. Schedule your viewing today!
-
2026-05-07price $37,901 314-char remark
Show marketing remark (313 chars)
2bedroom ready for your rehab and creative thoughts. The home features a newer roof, 2bedrooms, 1 bath and a great yard! Location is easy to shopping, near bus route, short drive to downtown, old town or college campus. This would make a great investment property as a rental or flip. Schedule your viewing today!
-
2026-04-21$39,900 Active 313-char remark
Show marketing remark (313 chars)
2bedroom ready for your rehab and creative thoughts. The home features a newer roof, 2bedrooms, 1 bath and a great yard! Location is easy to shopping, near bus route, short drive to downtown, old town or college campus. This would make a great investment property as a rental or flip. Schedule your viewing today!
-
2026-04-21$39,900 Active 314-char remark
Show marketing remark (313 chars)
2bedroom ready for your rehab and creative thoughts. The home features a newer roof, 2bedrooms, 1 bath and a great yard! Location is easy to shopping, near bus route, short drive to downtown, old town or college campus. This would make a great investment property as a rental or flip. Schedule your viewing today!
ⓘ Source: listings_history table (triggers on properties + properties_extension) + one-shot
backfill from property_details.listing_events for pre-trigger history.
Climate risk First Street
- Flood 1/10 Low FEMA zone X (unshaded) · 0% chance over 30 yrs
- Wildfire 1/10 Low
- Heat 3/10 Moderate 7 d/yr ≥97°F today · 16 d/yr by 30 yrs out
- Wind 2/10 Low
- Air quality 2/10 Low 1 unhealthy d/yr today · 2 by 30 yrs out
Nearby sold comps map
Loading sold comps map…
Walkable amenities ~0.75 mi
Loading nearby amenities…
Taxation est. · year 1
- Rental income
- $10,597
- − Mortgage interest
- −$1,675
- − Property taxes
- −$449
- − Insurance
- −$150
- − Repairs & maintenance
- −$848
- − Management
- −$848
- − Depreciation
- −$870
- Taxable income
- $5,759
- Est. tax owed @ 24.0%
- −$1,382
- After-tax cash flow
- $4,510/yr
For passive investors: Depreciation is non-cash, so a rental often shows a tax loss while cash-flowing — sheltering income. Rental losses are passive: they offset passive income freely, and up to $25,000/yr can offset ordinary (W-2) income if you actively participate and your MAGI is under $100k (phasing out to $0 by $150k); unused losses carry forward. On sale, claimed depreciation is recaptured at up to 25%, and gains may owe capital-gains tax (a 1031 exchange can defer both). Figures are a year-1 estimate at your 24.0% rate — not tax advice; consult a CPA.
Schools (NCES district)
- District
- Lansing Public School District
- NCES district ID
- 2621150
- Math proficiency
- 14% ▲ 1.00%
- Reading proficiency
- 23% ▲ 3.00%
- Median HH income
- $37,453
- Composite
- 18.76/100
- National rank
- #14002
- State rank
- #650 of 760 in MI
Livability — Lansing
- Score
- 79/100
- State rank
- #94
- US rank
- #2182
Category grades
Schools grade is shown separately in the Schools card above.
Census & demographics
- Census place
- Lansing, MI
- County
- Ingham County · 237,052 people
- City population
- 161,269
- Metro
- Lansing-East Lansing, MI
- Population (ZIP)
- 25,901
- Household income
- $64,315
- Rent vs Own
- Severe rent burden
- 851.0
Population outlook (Ingham County) Hauer SSP2
- Today (2025)
- 300,362 people
- By 2030
- 307,808 · +2.5%
- By 2040
- 320,492 · +6.7%
- By 2050
- 333,223 · +10.9%
- By 2075
- 373,693 · +24.4%
- By 2100
- 392,021 · +30.5%
Race, ethnicity, and origin ACS 2023
- Neighborhood character
- Diverse neighborhood (Simpson 0.56)
- Race & ethnicity
- White 64% Black 15% Two or more races 12% Hispanic / Latino 12% Asian 2%
- Hispanic origin (detail)
- Mexican 9%
- Common ancestry
- Romanian 3% Lithuanian 2% Iranian 2%
- Foreign-born
- 6% · Canada, China
- Languages at home
- 88% English-only · Spanish 5% Other Asian/Pacific 1% French/Haitian/Cajun 1%
Political lean MEDSL · Ingham
- 2024 margin
- Strong D (+29.7) · D 63.9% · R 34.2% · Other 2.0%
- 2008→2024 swing
- -3.6pp toward R · 2008: 33.3pp · 2024: 29.7pp
- All cycles
- 2024: D+29.7 2020: D+32.2 2016: D+27.6 2012: D+27.9 2008: D+33.3
Not yet ingested
- Civics
- —
Market trends
- HPI YoY
- ▼ -135.54%
- Current HPI
- 228.7023
- Rent YoY
- ▲ 10.50%
- Metro
- Lansing-East Lansing, MI
- State GDP YoY
- ▲ 1.37%
- F500 in state
- 28
Industry mix (Fortune 500 HQ in MI)
| Industry | F500 HQs | Revenue |
|---|---|---|
| Automotive Parts | 3 | $48B |
|
||
| Automotive | 2 | $372B |
|
||
| Chemicals | 1 | $45B |
|
||
| Automotive Retail | 1 | $29B |
|
||
| Healthcare / Medical Devices | 1 | $23B |
|
||
| Automotive Technology | 1 | $20B |
|
||
Price history
-25.1% since first listed8 events — show timeline
- 2026-05-26 Price Changed $29,903 REALCOMP
- 2026-05-26 Price Changed $29,903 Greater Lansing AoR
- 2026-05-19 Price Changed $35,000 REALCOMP
- 2026-05-19 Price Changed $35,000 Greater Lansing AoR
- 2026-05-07 Price Changed $37,901 REALCOMP
- 2026-05-07 Price Changed $37,901 Greater Lansing AoR
- 2026-04-21 Listed $39,900 Greater Lansing AoR
- 2026-04-21 Listed $39,900 REALCOMP
Property tax history
+16.3%/yrLatest (2025): $3,657 · +165.3% YoY. Source: county tax records.
Cash-flow waterfall
monthlySold comps — $/sqft
last 12 mo · ≤1 miLoading sold comps…