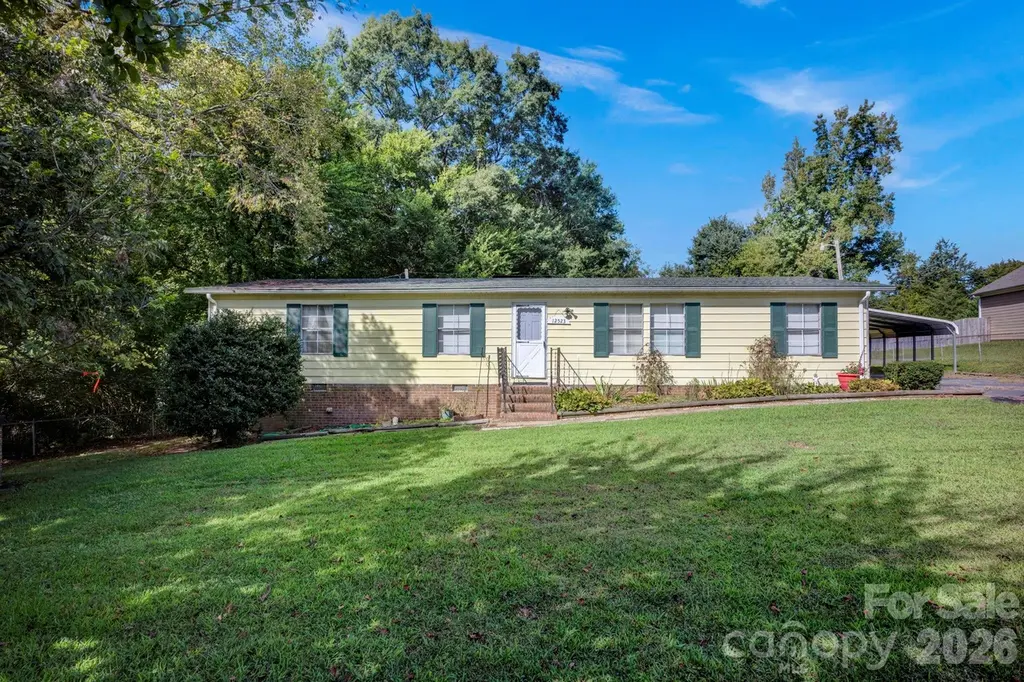
12523 Asbury Chapel Rd · Huntersville, NC
Flood risk 1/10 · Minimal
- FEMA flood zone
- X (unshaded)
- Chance of flooding over 30 yrs
- 0.0%
- Est. flood insurance / yr
- $507 – $1,088
Fire risk 1/10 · Minimal
- Est. fire insurance / yr
- $906 – $1,684
Heat risk 6/10 · Moderate
- Hot days now (above 104°F)
- 7 days/yr
- Hot days in 30 yrs
- 17 days/yr
Wind risk 4/10 · Minor
- Chance of severe wind over 30 yrs
- 16.0%
Air-quality risk 3/10 · Minor
- Unhealthy air days now
- 3 days/yr
- Unhealthy air days in 30 yrs
- 5 days/yr
Risk factors via First Street. Map © Google.
Why this score? — see what drove the F grade
The composite is a weighted blend of 9 inputs, each scored 0–100. Each bar is that input's sub-score; the figure is the points it added to the 100-point composite (weight × sub-score).
- Cash flow +8.5/30.0
- ARV discount +7.5/15.0
- Schools +3.8/10.0
- Livability +3.8/5.0
- 1% rule +2.6/10.0
- Rent growth +2.5/5.0
- Condition / age +2.5/5.0
- DSCR +2.3/10.0
- Appreciation +0.0/10.0
$275,000
🖨 Deal sheet (PDF) 📄 Offer letter ✓ Due diligence
Listing remarks
Great opportunity to own over half an acre on the east side of Huntersville, a popular, growing area that is convenient to Huntersville Town Center, Birkdale Village, and only 8 miles to Concord Mills and 4 miles to I-485. This property offers a 3 bedroom, 2 bathroom doublewide manufactured home, with a metal 2-car carport. Bring the pets to the fenced-in yard; ready to move in. Great opportunity for investors as well. Property being sold as is; seller will make no repairs.
Key facts
- 0.55 acre lot
- 2 parking spots
- Built 1978
Property features AI
Finance
- HOA & community: No HOA
Exterior
- Parking: Detached carport with 2 carport spaces
- Utilities: City water; Public sewer; Electricity connected; Cable available
- Home design: Manufactured doublewide single-family residence; One level; Completed development
- Construction: Manufactured construction; Aluminum and vinyl exterior materials; Composition roof; Crawl space foundation; Built as a single-unit manufactured home
- Exterior features: Enclosed patio/porch; Chain link fencing; Cleared lot; Shed(s) on the property; Asphalt/paved public road access
Interior
- Kitchen: Electric oven; Electric range
- Bedrooms: 3 bedrooms (all on the main level)
- Flooring: Carpet; Vinyl
- Bathrooms: 2 full bathrooms (main level)
- Heating & cooling: Heat pump; Central air
- Interior features: 10 total rooms; Ceiling fans in multiple rooms; Walk-in closets in several rooms
- Laundry & utility: Electric dryer hookup; Laundry located in hall; Electric water heater
Neighborhood map
What this means for you Summary
Snapshot
- This is a 3-bed/2.0-bath land listed at $275k.
Deal economics
- At list price, monthly cash flow is $-242 ($-3k/yr) — negative.
- To cash-flow at today's rent, offer at most $240k (12.8% below list).
- To meet the 1% rule (rent ≥ 1% of price), the offer needs to be $210k (23.7% below list).
- Recommended offer: $210k (23.7% below list) — sets the bar for 1% rule.
- Cap rate 5.2% vs local median 2.6% in Huntersville — top-decile yield for the area; either an underpriced asset or a hidden risk that comps aren't pricing in. Stress-test before assuming the spread holds.
Location & tenants
- Location reads 75/100 on livability (#47 in NC, #4,079 nationally) — a middle-class / working-renter tenant base. Strengths: employment A+, housing A+, crime A-; Watch: cost of living C-, health & safety D+, amenities F.
- Charlotte-Mecklenburg Schools (urban): math 42% / reading 46% proficiency, ranked #85 of 178 in NC (top 48%) — families likely to look elsewhere, expect single-tenant / working-renter base with shorter leases.
- Zoned schools: Blythe Elementary (math 39% / reading 45%, grade F, #633 of 1,410 statewide, top 48%, 915 students, 45% FRL); J. M. Alexander Middle (math 25% / reading 41%, grade F, #305 of 475 statewide, top 65%, 783 students, 52% FRL); North Mecklenburg High School (math 61% / reading 56%, grade C, #235 of 535 statewide, top 45%, 2,186 students, 45% FRL) — zoned schools at 47% FRL track the district average.
- Market conditions: Rents flat; 768 active listings in the ZIP; 11 comparable units currently listed for rent nearby; rentals leasing fast (median 10d on market — plan ~1-2 weeks tenant-placement turnaround); high-income renter base; 11,969 units permitted in Mecklenburg County in 2024 (5,377 in 5+ unit buildings).
Forward outlook
- Local home prices are declining (-3.0%/yr); year-one equity from $2k of loan paydown is wiped out by about $8k of value loss. Plan a longer hold.
- Mecklenburg County population projected at +53% by 2050 — long-run rental-demand tailwind backs the buy-and-hold thesis.
Negotiation context
- It's been on market 87 days — a 6% lower offer ($258k) is reasonable based on typical stale-listing flexibility.
Risks & watch-outs
- Climate carrying-cost: extreme-heat days projected 7→17/yr by 2055 (HVAC capex compounding) — expect insurance premiums to compound above CPI over the hold.
Questions for the listing agent
- What do current leases actually rent for vs. the listed asking? Can we see a recent rent roll and the last 12 months of T-12 income?
- It's been on market 87 days. Have you received any prior offers? Is the seller open to a 24% concession, seller financing, or rate buy-down credit?
- Built in 1978 — when were the roof, HVAC, electrical panel, plumbing, and water heater last replaced?
- Why hasn't it sold? Are there any deal-killer items the seller is aware of (foundation, flood, title, zoning, code violations)?
- Is there a deadline driving the sale (1031 exchange, divorce, estate, relocation)? That informs how much negotiation room exists.
- Schools are B-rated — typically a magnet for longer-tenancy family renters. What's the average tenant stay here, and is there a school-zone premium baked into asking?
- The area grade is low — what's the realistic commute time and amenity access for the typical tenant pool here? Any planned neighborhood developments (good or bad) we should know about?
- What's the average days-on-market for RENTAL listings here right now (not sales)? A rising rental-DOM trend means longer vacancies and softer asking-rent achievability than the comps imply.
- What's the recent tenant-quality profile in this submarket — average credit score on applications, eviction rate, late-payment / NSF rate, and stable-employment percentage? A property-management company in the area should have these aggregated.
- How much new for-sale + rental construction is in the pipeline within 1–3 miles? Heavy new supply typically softens prices + rents 12–24 months out; constrained supply supports both.
Investment metrics
- 1% rule
- 0.76% ✗
- Cap rate
- 5.24%
- Cash-on-cash
- -3.78%
- DSCR
- 0.83
- GRM
- 10.9
CMA / ARV
No comps found within radius.
Projected returns pro-forma
-3.0% appreciation · 0.16% rent growth · sell at horizon
- IRR
- -25.9%
- Equity multiple
- 0.15×
- Total profit
- $-65,797
- Equity at exit
- $41,003
- IRR
- -35.1%
- Equity multiple
- -0.29×
- Total profit
- $-99,651
- Equity at exit
- $23,777
Cash invested: $77,000 (down + closing). Projections, not guarantees.
Landlord ↔ Tenant lean methodology
- Overall (STATE)
- 85 Strongly Landlord-Friendly
- State North Carolina
- 85 Strongly Landlord-Friendly · R+3
- County
- — inherits STATE
- City
- — inherits STATE
ZIP-level market 28078
- Home prices YoY
- -31.4%
- Rents YoY
- 0.2%
- Active inventory
- 768
- Price-to-rent
- 10.9×
Monthly cashflow live
- Estimated rent
- $2,099 high interval (Pro) →
- Mortgage (P&I)
- −$1,442
- Tax est. 1.5%
- −$344 /mo · $4,125/yr
- Insurance
- −$115
- HOA
- −$0
- Vacancy / Maint / Mgmt
- −$441
- Net cashflow
- $-242
Break-even live
Sensitivity live
| Price | -10% $-52 | -5% $-147 | +0% $-242 | +5% $-337 | +10% $-432 |
|---|---|---|---|---|---|
| Rent | -10% $-408 | -5% $-325 | +0% $-242 | +5% $-159 | +10% $-77 |
| Rate | -1.0pp $-104 | -0.5pp $-172 | base $-242 | +0.5pp $-314 | +1.0pp $-386 |
UW: 25.0% down · 7.5% · 30yr · 1.5% tax · 5.0% vac · 8.0% maint · 8.0% mgmt
Financing live
Cash to close
- Down payment
- $68,750
- Closing costs
- $8,250
- Reserves months
- —
- Total cash needed
- —
Loan-product check · same deal, 3 products live
Conventional
25% down · 7.5% · 30yr
- Down + closing
- —
- Monthly P&I
- —
- Monthly cashflow
- —
- DSCR
- —
- Eligible?
- —
Personal DTI + credit; lowest rate.
DSCR
20% down · 8.5% · 30yr
- Down + closing
- —
- Monthly P&I
- —
- Monthly cashflow
- —
- DSCR
- —
- Eligible?
- —
No personal income docs; deal must DSCR.
Hard money
10% down · 12.0% · 12mo
- Down + closing
- —
- Monthly P&I
- —
- Monthly cashflow
- —
- DSCR
- —
- Eligible?
- —
Short-term bridge; refi at stabilization.
Rent comps 11 comps
| Address | Beds | Baths | Sqft | Rent | $/sqft | DOM | Units | Dist |
|---|---|---|---|---|---|---|---|---|
| 6930 Prosperity Church Rd Huntersville, NC | 1.0–2.0 | 1.0–2.5 | 1088 | $2,874 | $2.64 | 5d | 26 | 1.14mi |
| 6503 Ziegler Ln Charlotte, NC | 2.0 | 2.0 | 1068 | $1,800 | $1.69 | 26d | 1 | 1.22mi |
| 8829 Arbor Creek Dr Charlotte, NC | 2.0 | 2.5 | 1200 | $1,645 | $1.37 | 4d | 1 | 1.35mi |
| 12640 Cardinal Point Rd Charlotte, NC | 3.0 | 2.5 | 1608 | $1,455 | $0.90 | 15d | 1 | 1.38mi |
| 5030 Cardinal Spring Rd Charlotte, NC | 1.0–3.0 | 1.0–2.0 | 1115 | $3,039 | $2.73 | 0d | 54 | 1.41mi |
| 8643 Beaver Creek Dr Charlotte, NC | 2.0 | 2.5 | 1152 | $1,750 | $1.52 | 16d | 1 | 1.43mi |
| 8606 Beaver Creek Dr Charlotte, NC | 2.0 | 2.5 | 1134 | $1,749 | $1.54 | 4d | 1 | 1.43mi |
| 8606 Beaver Creek Dr Charlotte, NC | 2.0 | 2.5 | 1134 | $1,749 | $1.54 | 9d | 1 | 1.43mi |
| 8409 Summerford Dr Charlotte, NC | 2.0 | 2.5 | 1569 | $1,995 | $1.27 | 0d | 1 | 1.44mi |
| 4708 Pepperstone Ln Charlotte, NC | 2.0 | 2.5 | 1500 | $1,999 | $1.33 | 18d | 1 | 1.47mi |
| 4602 Quinton Ln Charlotte, NC | 3.0 | 2.5 | 1365 | $1,845 | $1.35 | 20d | 1 | 1.49mi |
Listing history 17 events
-
2026-06-21days on market $275,000 Active 87 DOM
-
2026-06-18days on market $275,000 Active 84 DOM
-
2026-06-17days on market $275,000 Active 83 DOM
-
2026-06-16days on market $275,000 Active 82 DOM
-
2026-06-15days on market $275,000 Active 81 DOM
-
2026-06-13days on market $275,000 Active 79 DOM
-
2026-06-10days on market $275,000 Active 75 DOM
-
2026-06-08days on market $275,000 Active 74 DOM
-
2026-06-07days on market $275,000 Active 73 DOM
-
2026-06-04days on market $275,000 Active 70 DOM
-
2026-06-03days on market $275,000 Active 69 DOM
-
2026-06-02days on market $275,000 Active 68 DOM
-
2026-06-02days on market $275,000 Active 67 DOM
-
2026-05-31days on market $275,000 Active 66 DOM
-
2026-05-19price $275,000
-
2026-04-20price $295,000
-
2026-03-26$319,000 Active
ⓘ Source: listings_history table (triggers on properties + properties_extension) + one-shot
backfill from property_details.listing_events for pre-trigger history.
Climate risk First Street
- Flood 1/10 Low FEMA zone X (unshaded) · 0% chance over 30 yrs
- Wildfire 1/10 Low
- Heat 6/10 Major 7 d/yr ≥104°F today · 17 d/yr by 30 yrs out
- Wind 4/10 Moderate 16% chance of damaging wind over 30 yrs
- Air quality 3/10 Moderate 3 unhealthy d/yr today · 5 by 30 yrs out
Nearby sold comps map
Loading sold comps map…
Walkable amenities ~0.75 mi
Loading nearby amenities…
Taxation est. · year 1
- Rental income
- $25,187
- − Mortgage interest
- −$15,404
- − Property taxes
- −$4,125
- − Insurance
- −$1,375
- − Repairs & maintenance
- −$2,015
- − Management
- −$2,015
- − Depreciation
- −$8,000
- Taxable loss
- −$7,747
- Est. tax savings @ 24.0%
- +$1,859
- After-tax cash flow
- $-1,049/yr
For passive investors: Depreciation is non-cash, so a rental often shows a tax loss while cash-flowing — sheltering income. Rental losses are passive: they offset passive income freely, and up to $25,000/yr can offset ordinary (W-2) income if you actively participate and your MAGI is under $100k (phasing out to $0 by $150k); unused losses carry forward. On sale, claimed depreciation is recaptured at up to 25%, and gains may owe capital-gains tax (a 1031 exchange can defer both). Figures are a year-1 estimate at your 24.0% rate — not tax advice; consult a CPA.
Schools (NCES district)
- District
- Charlotte-Mecklenburg Schools
- NCES district ID
- 3702970
- Math proficiency
- 42% ▼ -6.00%
- Reading proficiency
- 46% ▲ 1.00%
- Median HH income
- $57,175
- Composite
- 38.49/100
- National rank
- #4183
- State rank
- #85 of 178 in NC
Livability — Huntersville
- Score
- 75/100
- State rank
- #47
- US rank
- #4079
Category grades
Schools grade is shown separately in the Schools card above.
Census & demographics
- County
- Mecklenburg County · 1,167,319 people
- City population
- 71,657
- Metro
- Charlotte-Concord-Gastonia, NC-SC
- Population (ZIP)
- 71,657
- Household income
- $120,831
- Rent vs Own
- Severe rent burden
- 1275.0
Population outlook (Mecklenburg County) Hauer SSP2
- Today (2025)
- 1,305,740 people
- By 2030
- 1,442,752 · +10.5%
- By 2040
- 1,722,441 · +31.9%
- By 2050
- 1,999,450 · +53.1%
- By 2075
- 2,642,495 · +102.4%
- By 2100
- 3,106,755 · +137.9%
Race, ethnicity, and origin ACS 2023
- Neighborhood character
- Predominantly White (70%)
- Race & ethnicity
- White 70% Black 13% Hispanic / Latino 7% Two or more races 7% Asian 5%
- Hispanic origin (detail)
- Mexican 2% Puerto Rican 1%
- Common ancestry
- Slovak 4% Romanian 3% Serbian 3%
- Foreign-born
- 10% · Canada, South Korea, Jamaica
- Languages at home
- 89% English-only · Spanish 5% Other Indo-European 2% Other Asian/Pacific 1%
Political lean MEDSL · Mecklenburg
- 2024 margin
- Solid D (+32.9) · D 65.6% · R 32.7% · Other 1.6%
- 2008→2024 swing
- +8.5pp toward D · 2008: 24.4pp · 2024: 32.9pp
- All cycles
- 2024: D+32.9 2020: D+35.1 2016: D+29.9 2012: D+22.5 2008: D+24.4
Not yet ingested
- Civics
- —
Market trends
- HPI YoY
- ▼ -122.16%
- Current HPI
- 266.4459
- Rent YoY
- ▲ 0.16%
- Metro
- Charlotte-Concord-Gastonia, NC-SC
- State GDP YoY
- ▲ 3.28%
- F500 in state
- 26
Industry mix (Fortune 500 HQ in NC)
| Industry | F500 HQs | Revenue |
|---|---|---|
| Financial Services | 2 | $213B |
|
||
| Retail | 2 | $95B |
|
||
| Industrial Conglomerate | 1 | $38B |
|
||
| Metals / Steel | 1 | $35B |
|
||
| Utilities | 1 | $30B |
|
||
| Industrial Machinery | 1 | $19B |
|
||
Price history
-13.8% since first listed3 events — show timeline
- 2026-05-19 Price Changed $275,000 CANOPYMLS as Distributed by MLS Grid
- 2026-04-20 Price Changed $295,000 CANOPYMLS as Distributed by MLS Grid
- 2026-03-26 Listed $319,000 CANOPYMLS as Distributed by MLS Grid
Property tax history
-1.7%/yrLatest (2025): $530 · +2.6% YoY. Source: county tax records.
Cash-flow waterfall
monthlySold comps — $/sqft
last 12 mo · ≤1 miLoading sold comps…