 🏗️ New Construction
Daisy Plan · Pearland, TX
Flood risk 1/10 · Minimal
- FEMA flood zone
- X (unshaded)
- Chance of flooding over 30 yrs
- 0.0%
- Est. flood insurance / yr
- $507 – $1,088
Fire risk 4/10 · Minor
- Est. fire insurance / yr
- $1,222 – $2,270
Heat risk 9/10 · Severe
- Hot days now (above 107°F)
- 7 days/yr
- Hot days in 30 yrs
- 24 days/yr
Wind risk 9/10 · Severe
- Chance of severe wind over 30 yrs
- 99.0%
Air-quality risk 2/10 · Minimal
- Unhealthy air days now
- 1 days/yr
- Unhealthy air days in 30 yrs
- 1 days/yr
Risk factors via First Street. Map © Google.
Why this score? — see what drove the D- grade
The composite is a weighted blend of 9 inputs, each scored 0–100. Each bar is that input's sub-score; the figure is the points it added to the 100-point composite (weight × sub-score).
- 1% rule +8.5/10.0
- ARV discount +7.5/15.0
- Cash flow +6.0/30.0
- Schools +5.4/10.0
- Condition / age +4.8/5.0
- Livability +4.0/5.0
- Rent growth +3.2/5.0
- DSCR +0.3/10.0
- Appreciation +0.0/10.0
$110,900
🖨 Deal sheet 📄 Offer letter ✓ Due diligence
Listing remarks MLS
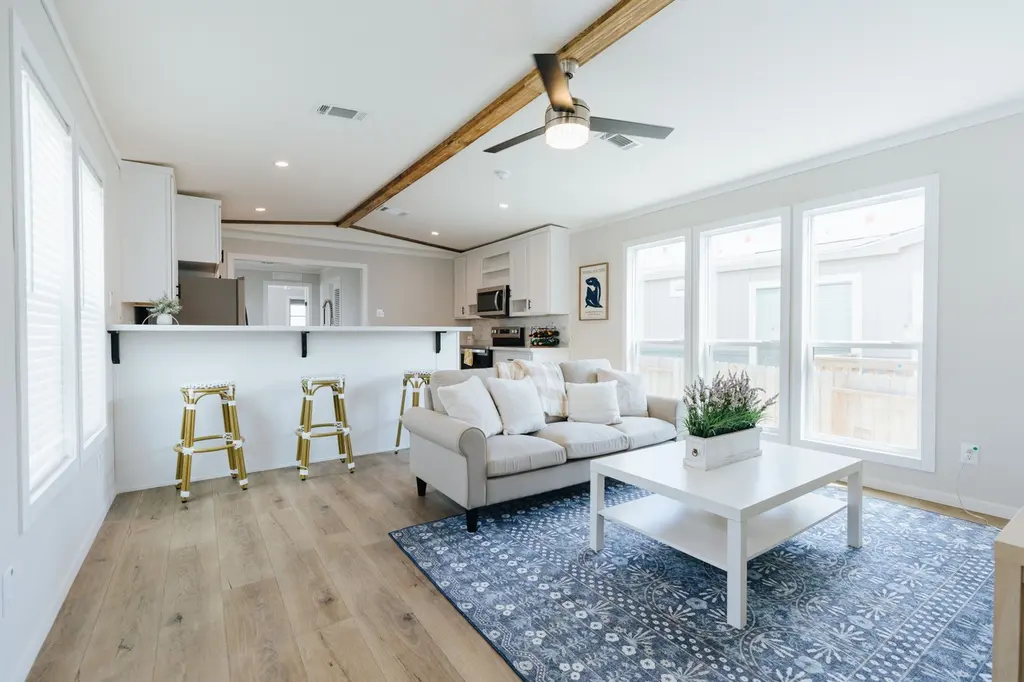
Welcome to the Daisy Model - Your Future Home Awaits! Discover modern comfort in the brand new 2025 Daisy manufactured home, located in the desirable community of The Landing at Pearland. Home Features: -Spacious open-concept living room perfect for relaxing or entertaining -Stylish kitchen with ample counter space and a separate dining area -Convenient walk-in laundry room -Split floor plan for added privacy -Large primary bedroom suite with both a bathtub and separate shower Whether you're a first-time buyer or looking to downsize in style, the Daisy has everything you need to feel right at home. Schedule a tour today and learn how you can make the Daisy model your very own!
Key facts
- Listed 331 days
Neighborhood map
What this means for you Summary
Snapshot
- This is a 3-bed/2.0-bath manufactured listed at $111k. Condition is rated excellent.
Deal economics
- At list price, monthly cash flow is $-289 ($-3k/yr) — negative.
- To cash-flow at today's rent, offer at most $108k (2.5% below list).
- Meets the 1% rule at list price ($2k rent vs $111k).
- Recommended offer: $98k (12.0% below list) — sets the bar for market timing.
- Cap rate 4.0% vs local median 3.0% in Pearland — top-decile yield for the area; either an underpriced asset or a hidden risk that comps aren't pricing in. Stress-test before assuming the spread holds.
Location & tenants
- Location reads 81/100 on livability (#32 in TX, #1,539 nationally) — a professional / high-income tenant draw. Strengths: schools A+, employment A+, housing A+; Watch: amenities D-, commute F.
- Pearland ISD (suburban): math 58% / reading 59% proficiency, ranked #47 of 826 in TX (top 6%) — acceptable for families but not a draw, mixed tenant base, ~2y average lease.
- Market conditions: Rents rising (+2.9%/yr); 316 active listings in the ZIP; 1 comparable units currently listed for rent nearby; high-income renter base; 3,960 units permitted in Brazoria County in 2024 (593 in 5+ unit buildings).
Forward outlook
- Local home prices are declining (-3.0%/yr); year-one equity from $1k of loan paydown is wiped out by about $4k of value loss. Plan a longer hold.
- Brazoria County population projected at +44% by 2050 — long-run rental-demand tailwind backs the buy-and-hold thesis.
Negotiation context
- It's been on market 332 days — a 12% lower offer ($98k) is reasonable based on typical stale-listing flexibility.
Risks & watch-outs
- Watch-outs: HOA is 42% of rent.
- Climate carrying-cost: severe wind risk, 99% chance of damaging wind over 30y; extreme-heat days projected 7→24/yr by 2055 (HVAC capex compounding) — expect insurance premiums to compound above CPI over the hold.
Questions for the listing agent
- What do current leases actually rent for vs. the listed asking? Can we see a recent rent roll and the last 12 months of T-12 income?
- It's been on market 332 days. Have you received any prior offers? Is the seller open to a 12% concession, seller financing, or rate buy-down credit?
- What does the HOA fee cover, when was the last increase, and are there any pending special assessments or reserve-fund shortfalls?
- Why hasn't it sold? Are there any deal-killer items the seller is aware of (foundation, flood, title, zoning, code violations)?
- Is there a deadline driving the sale (1031 exchange, divorce, estate, relocation)? That informs how much negotiation room exists.
- Schools are A-rated — typically a magnet for longer-tenancy family renters. What's the average tenant stay here, and is there a school-zone premium baked into asking?
- The area grade is low — what's the realistic commute time and amenity access for the typical tenant pool here? Any planned neighborhood developments (good or bad) we should know about?
- What's the average days-on-market for RENTAL listings here right now (not sales)? A rising rental-DOM trend means longer vacancies and softer asking-rent achievability than the comps imply.
- What's the recent tenant-quality profile in this submarket — average credit score on applications, eviction rate, late-payment / NSF rate, and stable-employment percentage? A property-management company in the area should have these aggregated.
- How much new for-sale + rental construction is in the pipeline within 1–3 miles? Heavy new supply typically softens prices + rents 12–24 months out; constrained supply supports both.
Investment metrics
- 1% rule
- 1.35% ✓
- Cap rate
- 3.98%
- Cash-on-cash
- -8.26%
- DSCR
- 0.63
- GRM
- 6.2
CMA / ARV
- ARV (median comp)
- $150,000
- List price
- $110,900
- Delta
- -26.07%
- Verdict
- UNDERPRICED
- Comps
- 1 within 2.0 mi
Projected returns pro-forma
-3.0% appreciation · 2.94% rent growth · sell at horizon
- IRR
- -30.4%
- Equity multiple
- -0.01×
- Total profit
- $-42,293
- Equity at exit
- $22,365
- IRR
- -30.4%
- Equity multiple
- -0.40×
- Total profit
- $-58,798
- Equity at exit
- $12,969
Cash invested: $42,000 (down + closing). Projections, not guarantees.
Landlord ↔ Tenant lean methodology
- Overall (STATE)
- 87 Strongly Landlord-Friendly
- State Texas
- 87 Strongly Landlord-Friendly · R+5
- County
- — inherits STATE
- City
- — inherits STATE
ZIP-level market 77581
- Home prices YoY
- -29.1%
- Rents YoY
- 2.9%
- Active inventory
- 316
- Price-to-rent
- 4.6×
Monthly cashflow live
- Estimated rent
- $2,022 medium interval (Pro) →
- Mortgage (P&I)
- −$787
- Tax est. 1.5%
- −$188 /mo · $2,250/yr
- Insurance
- −$62
- HOA
- −$850
- Vacancy / Maint / Mgmt
- −$425
- Net cashflow
- $-289
Break-even live
UW: 25.0% down · 7.5% · 30yr · 1.5% tax · 5.0% vac · 8.0% maint · 8.0% mgmt
Financing live
Cash to close
- Down payment
- $37,500
- Closing costs
- $4,500
- Reserves months
- —
- Total cash needed
- —
Loan-product check · same deal, 3 products live
Conventional
25% down · 7.5% · 30yr
- Down + closing
- —
- Monthly P&I
- —
- Monthly cashflow
- —
- DSCR
- —
- Eligible?
- —
Personal DTI + credit; lowest rate.
DSCR
20% down · 8.5% · 30yr
- Down + closing
- —
- Monthly P&I
- —
- Monthly cashflow
- —
- DSCR
- —
- Eligible?
- —
No personal income docs; deal must DSCR.
Hard money
10% down · 12.0% · 12mo
- Down + closing
- —
- Monthly P&I
- —
- Monthly cashflow
- —
- DSCR
- —
- Eligible?
- —
Short-term bridge; refi at stabilization.
Rent comps 1 comps
| Address | Beds | Baths | Sqft | Rent | $/sqft | DOM | Units | Dist |
|---|---|---|---|---|---|---|---|---|
| 500 Stoneledge Dr Friendswood, TX | 3.0 | 2.0 | 1268 | $1,995 | $1.57 | 24d | 1 | 1.34mi |
HOA detail
- Monthly dues
- $850 · $10,200/yr
Listing history 14 events
-
2026-06-18days on market $110,900 Active 332 DOM
-
2026-06-17days on market $110,900 Active 331 DOM
-
2026-06-16days on market $110,900 Active 330 DOM
-
2026-06-15days on market $110,900 Active 329 DOM
-
2026-06-13days on market $110,900 Active 327 DOM
-
2026-06-09days on market $110,900 Active 323 DOM
-
2026-06-08days on market $110,900 Active 322 DOM
-
2026-06-07days on market $110,900 Active 321 DOM
-
2026-06-04days on market $110,900 Active 318 DOM
-
2026-06-03days on market $110,900 Active 317 DOM
-
2026-06-02days on market $110,900 Active 316 DOM
-
2026-06-01days on market $110,900 Active 315 DOM
-
2026-05-31days on market $110,900 Active 314 DOM
-
2025-07-21$110,900 Active 686-char remark
Show marketing remark (686 chars)
Welcome to the Daisy Model - Your Future Home Awaits! Discover modern comfort in the brand new 2025 Daisy manufactured home, located in the desirable community of The Landing at Pearland. Home Features: -Spacious open-concept living room perfect for relaxing or entertaining -Stylish kitchen with ample counter space and a separate dining area -Convenient walk-in laundry room -Split floor plan for added privacy -Large primary bedroom suite with both a bathtub and separate shower Whether you're a first-time buyer or looking to downsize in style, the Daisy has everything you need to feel right at home. Schedule a tour today and learn how you can make the Daisy model your very own!
ⓘ Source: listings_history table (triggers on properties + properties_extension) + one-shot
backfill from property_details.listing_events for pre-trigger history.
Climate risk First Street
- Flood 1/10 Low FEMA zone X (unshaded) · 0% chance over 30 yrs
- Wildfire 4/10 Moderate
- Heat 9/10 Extreme 7 d/yr ≥107°F today · 24 d/yr by 30 yrs out
- Wind 9/10 Extreme 99% chance of damaging wind over 30 yrs
- Air quality 2/10 Low 1 unhealthy d/yr today · 1 by 30 yrs out
Nearby sold comps map
Loading sold comps map…
Walkable amenities ~0.75 mi
Loading nearby amenities…
Taxation est. · year 1
- Rental income
- $24,265
- − Mortgage interest
- −$8,402
- − Property taxes
- −$2,250
- − Insurance
- −$750
- − Repairs & maintenance
- −$1,941
- − Management
- −$1,941
- − HOA
- −$10,200
- − Depreciation
- −$4,364
- Taxable loss
- −$5,583
- Est. tax savings @ 24.0%
- +$1,340
- After-tax cash flow
- $-2,130/yr
For passive investors: Depreciation is non-cash, so a rental often shows a tax loss while cash-flowing — sheltering income. Rental losses are passive: they offset passive income freely, and up to $25,000/yr can offset ordinary (W-2) income if you actively participate and your MAGI is under $100k (phasing out to $0 by $150k); unused losses carry forward. On sale, claimed depreciation is recaptured at up to 25%, and gains may owe capital-gains tax (a 1031 exchange can defer both). Figures are a year-1 estimate at your 24.0% rate — not tax advice; consult a CPA.
Condition & rehab AI · 12 photos
This modern manufactured home is in excellent condition with a spacious open-concept living area, modern kitchen, and well-maintained exterior amenities. It is move-in ready and ideal for both resale and rental.
Value-add opportunities
- Both Landscaping and outdoor amenities — Enhances both resale and rental value by providing a desirable living environment.
Renovation cost estimate screening
Value-add ROI direction
- Both Landscaping and outdoor amenities — Enhances both resale and rental value by providing a desirable living environment. ↑
ⓘ Cost ranges are severity-bucket heuristics (US national rule-of-thumb). Get contractor quotes + a written scope before underwriting a rehab budget.
Schools (NCES district)
- District
- Pearland ISD
- NCES district ID
- 4834440
- Math proficiency
- 58% ▼ -13.00%
- Reading proficiency
- 59% ▼ -6.00%
- Median HH income
- $90,091
- Composite
- 53.67/100
- National rank
- #1430
- State rank
- #47 of 826 in TX
Livability — Pearland
- Score
- 81/100
- State rank
- #32
- US rank
- #1539
Category grades
Schools grade is shown separately in the Schools card above.
Census & demographics
- County
- Brazoria County · 374,982 people
- City population
- 142,397
- Metro
- Houston-The Woodlands-Sugar Land, TX
- Population (ZIP)
- 51,332
- Household income
- $111,139
- Rent vs Own
- Severe rent burden
- 826.0
Population outlook (Brazoria County) Hauer SSP2
- Today (2025)
- 420,414 people
- By 2030
- 457,585 · +8.8%
- By 2040
- 532,232 · +26.6%
- By 2050
- 605,399 · +44.0%
- By 2075
- 779,358 · +85.4%
- By 2100
- 883,759 · +110.2%
Race, ethnicity, and origin ACS 2023
- Neighborhood character
- Diverse neighborhood (Simpson 0.66)
- Race & ethnicity
- White 47% Hispanic / Latino 33% Two or more races 20% Black 10% Asian 7%
- Hispanic origin (detail)
- Mexican 26% Puerto Rican 2%
- Common ancestry
- Lithuanian 2% Slovak 2% Romanian 2%
- Foreign-born
- 12% · Canada, Vietnam, Guatemala
- Languages at home
- 77% English-only · Spanish 16% Other Indo-European 3% Vietnamese 2%
Political lean MEDSL · Brazoria
- 2024 margin
- R (+19.7) · D 39.5% · R 59.2% · Other 1.3%
- 2008→2024 swing
- +9.9pp toward D · 2008: -29.6pp · 2024: -19.7pp
- All cycles
- 2024: R+19.7 2020: R+18.2 2016: R+24.6 2012: R+34.2 2008: R+29.6
Not yet ingested
- Civics
- —
Market trends
- HPI YoY
- ▼ -100.56%
- Current HPI
- 244.7942
- Rent YoY
- ▲ 2.94%
- Metro
- Houston-The Woodlands-Sugar Land, TX
- State GDP YoY
- ▲ 3.95%
- F500 in state
- 110
Industry mix (Fortune 500 HQ in TX)
| Industry | F500 HQs | Revenue |
|---|---|---|
| Energy | 16 | $1,198B |
|
||
| Technology | 5 | $198B |
|
||
| Engineering / Construction | 4 | $72B |
|
||
| Energy Services | 3 | $60B |
|
||
| Utilities | 3 | $41B |
|
||
| Healthcare | 2 | $330B |
|
||
Price history
1 event — show timeline
- 2025-07-21 Listed $110,900 Zillow
Cash-flow waterfall
monthlySold comps — $/sqft
last 12 mo · ≤1 miLoading sold comps…