840 Bluffview Dr · Cleburne, TX
Flood risk No data
- FEMA flood zone
- —
- Chance of flooding over 30 yrs
- —
- Est. flood insurance / yr
- —
Fire risk No data
- Est. fire insurance / yr
- —
Heat risk No data
- Hot days now (above threshold)
- —
- Hot days in 30 yrs
- —
Wind risk No data
- Chance of severe wind over 30 yrs
- —
Air-quality risk No data
- Unhealthy air days now
- —
- Unhealthy air days in 30 yrs
- —
Risk factors via First Street. Map © Google.
Why this score? — see what drove the C- grade
The composite is a weighted blend of 9 inputs, each scored 0–100. Each bar is that input's sub-score; the figure is the points it added to the 100-point composite (weight × sub-score).
- Cash flow +20.6/30.0
- ARV discount +7.5/15.0
- DSCR +6.5/10.0
- 1% rule +4.7/10.0
- Livability +3.4/5.0
- Schools +2.9/10.0
- Rent growth +2.5/5.0
- Condition / age +2.5/5.0
- Appreciation +0.0/10.0
$238,990
🖨 Deal sheet 📄 Offer letter ✓ Due diligence
Listing remarks
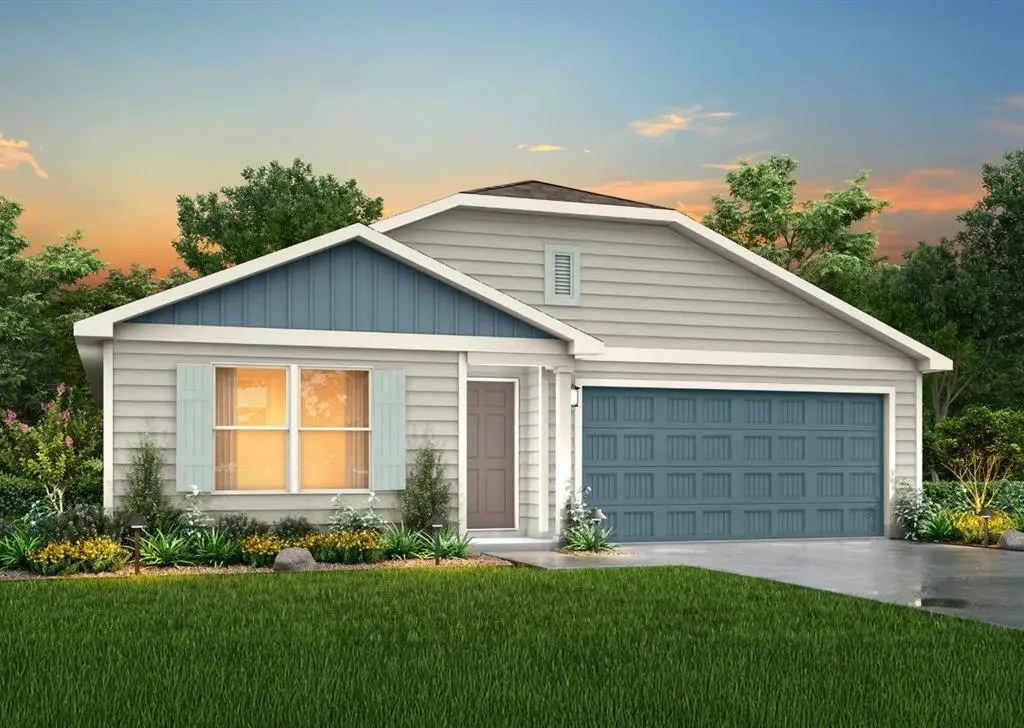
MLS# 21277549 - Built by NHC - Oct 2026 completion! ~ Model 1804-1 A1 - Monroe The Monroe Plan from our Liberty Series combines thoughtful design and everyday functionality, offering 4 bedrooms, 2 bathrooms, a 2-car garage, and 1,804 square feet of well-planned living space. This single-story home features a split-bedroom layout for added privacy. At the front of the home, you’ll find three secondary bedrooms, a full bathroom, and a conveniently located laundry room. A versatile flex room near the main living area offers the perfect space for a home office, playroom, or sitting area. The bright and open kitchen is the heart of the Monroe Plan, complete with an island and a clear view
Key facts
- 5,663 sq ft lot
- 2 garage spots
- Built 2025
Property features AI
Finance
- Other: Builder special listing conditions; Possession at closing/funding
- Financial info: Acceptable financing: Cash, Conventional, FHA, VA; Treat as clear loan type; No second mortgage
- HOA & community: Mandatory HOA; HOA dues $480 annually; HOA covers grounds maintenance and management fees
Exterior
- Parking: Attached 2-car garage; 2 covered parking spaces; Garage faces front
- Utilities: City water; City sewer; Electricity available; Not in a municipal utility district
- Home design: Single family residence; One story; New construction (incomplete)
- Construction: Frame construction; Slab foundation; Composition/Shingle roof; Year built 2025 (new construction - incomplete)
- Exterior features: Lot approximately 58' x 100' (less than 0.5 acre); Subdivision: Villages of Mayfield
Interior
- Kitchen: Dishwasher; Electric range; Microwave; Pantry
- Bedrooms: 4 bedrooms (all on main level); Primary bedroom on main level
- Flooring: Carpet; Laminate
- Bathrooms: 2 full bathrooms
- Heating & cooling: Central heating; Central air conditioning
- Interior features: Loft; Pantry; One living area; One dining area; 8 total rooms
- Laundry & utility: Utility room
Neighborhood map
What this means for you Summary
Snapshot
- This is a 4-bed/2.0-bath land listed at $239k.
Deal economics
- At list price, monthly cash flow is $319 ($4k/yr) — positive.
- The deal already cash-flows at list — no discount required.
- To meet the 1% rule (rent ≥ 1% of price), the offer needs to be $231k (3.4% below list).
- Recommended offer: $231k (3.4% below list) — sets the bar for 1% rule.
- Cap rate 7.9% vs local median 3.6% in Cleburne — top-decile yield for the area; either an underpriced asset or a hidden risk that comps aren't pricing in. Stress-test before assuming the spread holds.
Location & tenants
- Location reads 68/100 on livability (#460 in TX) — a middle-class / working-renter tenant base. Strengths: cost of living A+, housing A+, health & safety A+; Watch: employment C-, amenities F, commute F.
- Cleburne ISD (town): math 34% / reading 33% proficiency, ranked #537 of 826 in TX (top 65%) — families likely to look elsewhere, expect single-tenant / working-renter base with shorter leases.
- Zoned schools: Adams El (math 37% / reading 32%, grade F, #1,995 of 4,322 statewide, top 50%, 431 students, 76% FRL) — zoned schools average 76% FRL vs 56% district-wide (21 pts higher); higher-poverty schools than district average — tighter screening recommended.
- Market conditions: 335 active listings in the ZIP; 12 comparable units currently listed for rent nearby; rentals lingering (median 44d on market — plan ~5-8 weeks vacancy on turnover, expect pricing pressure); 50% of comp listings sitting > 30 days — soft ceiling on asking rent; 2,152 units permitted in Johnson County in 2024 (76 in 5+ unit buildings).
Forward outlook
- Local home prices are declining (-3.0%/yr); year-one equity from $2k of loan paydown is wiped out by about $7k of value loss. Plan a longer hold.
- Johnson County population projected at +24% by 2050 — long-run rental-demand tailwind backs the buy-and-hold thesis.
Negotiation context
- It's been on market 28 days — a 2% lower offer ($235k) is reasonable based on typical stale-listing flexibility.
Questions for the listing agent
- What does the HOA fee cover, when was the last increase, and are there any pending special assessments or reserve-fund shortfalls?
- Is there a deadline driving the sale (1031 exchange, divorce, estate, relocation)? That informs how much negotiation room exists.
- Schools are F-rated, which usually means shorter tenancies and higher turnover. Who's the typical renter profile here, and what's been the actual vacancy rate?
- What's the average days-on-market for RENTAL listings here right now (not sales)? A rising rental-DOM trend means longer vacancies and softer asking-rent achievability than the comps imply.
- What's the recent tenant-quality profile in this submarket — average credit score on applications, eviction rate, late-payment / NSF rate, and stable-employment percentage? A property-management company in the area should have these aggregated.
- How much new for-sale + rental construction is in the pipeline within 1–3 miles? Heavy new supply typically softens prices + rents 12–24 months out; constrained supply supports both.
Investment metrics
- 1% rule
- 0.97% ✗
- Cap rate
- 7.90%
- Cash-on-cash
- 5.73%
- DSCR
- 1.25
- GRM
- 8.6
CMA / ARV
No comps found within radius.
Projected returns pro-forma
-3.0% appreciation · 3.0% rent growth · sell at horizon
- IRR
- -7.5%
- Equity multiple
- 0.72×
- Total profit
- $-18,439
- Equity at exit
- $35,634
- IRR
- 2.1%
- Equity multiple
- 1.15×
- Total profit
- $9,912
- Equity at exit
- $20,663
Cash invested: $66,917 (down + closing). Projections, not guarantees.
Landlord ↔ Tenant lean methodology
- Overall (STATE)
- 87 Strongly Landlord-Friendly
- State Texas
- 87 Strongly Landlord-Friendly · R+5
- County
- — inherits STATE
- City
- — inherits STATE
ZIP-level market 76031
- Home prices YoY
- -17.6%
- Active inventory
- 335
- Price-to-rent
- 8.6×
Monthly cashflow live
- Estimated rent
- $2,308 high interval (Pro) →
- Mortgage (P&I)
- −$1,253
- Tax from tax record
- −$111 /mo · $1,336/yr
- Insurance
- −$100
- HOA
- −$40
- Vacancy / Maint / Mgmt
- −$485
- Net cashflow
- $319
Break-even live
UW: 25.0% down · 7.5% · 30yr · 1.5% tax · 5.0% vac · 8.0% maint · 8.0% mgmt
Financing live
Cash to close
- Down payment
- $59,748
- Closing costs
- $7,170
- Reserves months
- —
- Total cash needed
- —
Loan-product check · same deal, 3 products live
Conventional
25% down · 7.5% · 30yr
- Down + closing
- —
- Monthly P&I
- —
- Monthly cashflow
- —
- DSCR
- —
- Eligible?
- —
Personal DTI + credit; lowest rate.
DSCR
20% down · 8.5% · 30yr
- Down + closing
- —
- Monthly P&I
- —
- Monthly cashflow
- —
- DSCR
- —
- Eligible?
- —
No personal income docs; deal must DSCR.
Hard money
10% down · 12.0% · 12mo
- Down + closing
- —
- Monthly P&I
- —
- Monthly cashflow
- —
- DSCR
- —
- Eligible?
- —
Short-term bridge; refi at stabilization.
Rent comps 12 comps
| Address | Beds | Baths | Sqft | Rent | $/sqft | DOM | Units | Dist |
|---|---|---|---|---|---|---|---|---|
| 853 Eagles Nest Dr Cleburne, TX | 5.0 | 3.0 | 2600 | $2,490 | $0.96 | 2d | 1 | 0.03mi |
| 853 Eagles Nest Dr Cleburne, TX | 5.0 | 3.0 | 2600 | $2,695 | $1.04 | 24d | 1 | 0.03mi |
| 872 Eagles Nest Dr Cleburne, TX | 4.0 | 2.5 | 2203 | $2,200 | $1.00 | 43d | 1 | 0.06mi |
| 516 Quail Meadows Dr Cleburne, TX | 5.0 | 3.0 | 1804 | $2,400 | $1.33 | 4d | 1 | 0.08mi |
| 544 Quail Meadows Dr Cleburne, TX | 4.0 | 2.0 | 1804 | $2,100 | $1.16 | 24d | 1 | 0.10mi |
| 805 Bluffview Dr Cleburne, TX | 4.0 | 2.5 | 2203 | $2,245 | $1.02 | 43d | 1 | 0.11mi |
| 605 Mayfield Dr Cleburne, TX | 3.0 | 3.0 | 2140 | $2,340 | $1.09 | 43d | 1 | 0.15mi |
| 303 Eastland St Cleburne, TX | 3.0 | 3.0 | 1254 | $1,950 | $1.56 | 43d | 1 | 0.77mi |
| 438 Sabine Ave Cleburne, TX | 3.0 | 2.0 | 1230 | $1,650 | $1.34 | 12d | 1 | 0.95mi |
| 1218 E James St Cleburne, TX | 3.0 | 2.0 | 1335 | $1,695 | $1.27 | 43d | 1 | 0.96mi |
| 301 Pearl St Cleburne, TX | 3.0 | 2.0 | 1405 | $1,900 | $1.35 | 24d | 1 | 1.10mi |
| 612 N Robinson St Cleburne, TX | 3.0 | 2.5 | 1311 | $2,200 | $1.68 | 43d | 1 | 1.48mi |
HOA detail
- Monthly dues
- $40 · $480/yr
Listing history 14 events
-
2026-06-18days on market $238,990 Active 28 DOM
-
2026-06-17days on market $238,990 Active 27 DOM
-
2026-06-16days on market $238,990 Active 26 DOM
-
2026-06-15days on market $238,990 Active 25 DOM
-
2026-06-13days on market $238,990 Active 23 DOM
-
2026-06-09days on market $238,990 Active 19 DOM
-
2026-06-08days on market $238,990 Active 18 DOM
-
2026-06-07days on market $238,990 Active 17 DOM
-
2026-06-04days on market $238,990 Active 14 DOM
-
2026-06-03days on market $238,990 Active 13 DOM
-
2026-06-02days on market $238,990 Active 12 DOM
-
2026-06-01days on market $238,990 Active 11 DOM
-
2026-05-31days on market $238,990 Active 10 DOM
-
2026-05-21$238,990 Active
ⓘ Source: listings_history table (triggers on properties + properties_extension) + one-shot
backfill from property_details.listing_events for pre-trigger history.
Tax reassessment forecast TX · Resets to sale price
- Current annual tax
- $1,336 · $111/mo
- Projected year-2 tax
- $4,374 · $364/mo
- Expected delta
- +$3,038/yr (+$253/mo · 227.5%)
ⓘ Screening estimate from a state-policy table — verify with the county assessor before closing.
Nearby sold comps map
Loading sold comps map…
Walkable amenities ~0.75 mi
Loading nearby amenities…
Taxation est. · year 1
- Rental income
- $27,700
- − Mortgage interest
- −$13,387
- − Property taxes
- −$1,336
- − Insurance
- −$1,195
- − Repairs & maintenance
- −$2,216
- − Management
- −$2,216
- − HOA
- −$480
- − Depreciation
- −$6,952
- Taxable loss
- −$82
- Est. tax savings @ 24.0%
- +$20
- After-tax cash flow
- $3,853/yr
For passive investors: Depreciation is non-cash, so a rental often shows a tax loss while cash-flowing — sheltering income. Rental losses are passive: they offset passive income freely, and up to $25,000/yr can offset ordinary (W-2) income if you actively participate and your MAGI is under $100k (phasing out to $0 by $150k); unused losses carry forward. On sale, claimed depreciation is recaptured at up to 25%, and gains may owe capital-gains tax (a 1031 exchange can defer both). Figures are a year-1 estimate at your 24.0% rate — not tax advice; consult a CPA.
Schools (NCES district)
- District
- Cleburne ISD
- NCES district ID
- 4814310
- Math proficiency
- 34% ▼ -2.00%
- Reading proficiency
- 33% ▼ -2.00%
- Median HH income
- $48,788
- Composite
- 29.0/100
- National rank
- #6618
- State rank
- #537 of 826 in TX
Livability — Cleburne
- Score
- 68/100
- State rank
- #460
- US rank
- #9292
Category grades
Schools grade is shown separately in the Schools card above.
Census & demographics
- Census place
- Cleburne, TX
- City population
- 29,538
- Population (ZIP)
- 18,697
Population outlook (Johnson County) Hauer SSP2
- Today (2025)
- 179,678 people
- By 2030
- 189,208 · +5.3%
- By 2040
- 207,261 · +15.4%
- By 2050
- 223,064 · +24.1%
- By 2075
- 259,979 · +44.7%
- By 2100
- 275,395 · +53.3%
Race, ethnicity, and origin ACS 2023
- Neighborhood character
- Predominantly White (66%)
- Race & ethnicity
- White 66% Hispanic / Latino 28% Two or more races 12% Black 3%
- Hispanic origin (detail)
- Mexican 23% Puerto Rican 3%
- Common ancestry
- Italian 1% Lithuanian 1% Slovak 1%
- Foreign-born
- 5% · Canada, Vietnam
- Languages at home
- 77% English-only · Spanish 22% Vietnamese 0%
Political lean MEDSL · Johnson
- 2024 margin
- Solid R (+51.4) · D 23.9% · R 75.3%
- 2008→2024 swing
- -3.9pp toward R · 2008: -47.5pp · 2024: -51.4pp
- All cycles
- 2024: R+51.4 2020: R+53.0 2016: R+58.3 2012: R+55.6 2008: R+47.5
Not yet ingested
- Civics
- —
Market trends
- HPI YoY
- ▼ -59.43%
- Current HPI
- 277.598
- Rent YoY
- —
- Metro
- —
- State GDP YoY
- ▲ 3.95%
- F500 in state
- 110
Industry mix (Fortune 500 HQ in TX)
| Industry | F500 HQs | Revenue |
|---|---|---|
| Energy | 16 | $1,198B |
|
||
| Technology | 5 | $198B |
|
||
| Engineering / Construction | 4 | $72B |
|
||
| Energy Services | 3 | $60B |
|
||
| Utilities | 3 | $41B |
|
||
| Healthcare | 2 | $330B |
|
||
Price history
1 event — show timeline
- 2026-05-21 Listed $238,990 NTREIS
Property tax history
+1.5%/yrLatest (2025): $1,336 · +1.5% YoY. Source: county tax records.
Cash-flow waterfall
monthlySold comps — $/sqft
last 12 mo · ≤1 miLoading sold comps…