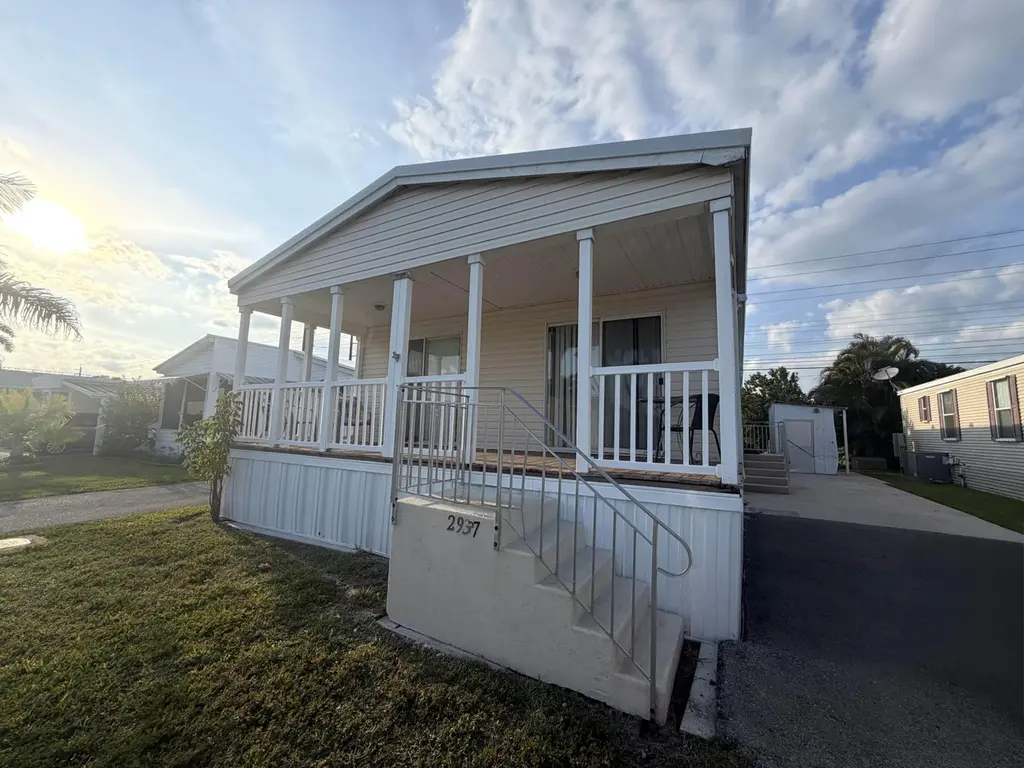
2937 SW 54th St · Dania Beach, FL
Flood risk 4/10 · Minor
- FEMA flood zone
- X (shaded)
- Chance of flooding over 30 yrs
- 0.2%
- Est. flood insurance / yr
- $507 – $1,088
Fire risk 1/10 · Minimal
- Est. fire insurance / yr
- $947 – $1,759
Heat risk 10/10 · Severe
- Hot days now (above 105°F)
- 6 days/yr
- Hot days in 30 yrs
- 21 days/yr
Wind risk 10/10 · Severe
- Chance of severe wind over 30 yrs
- 99.0%
Air-quality risk 2/10 · Minimal
- Unhealthy air days now
- 2 days/yr
- Unhealthy air days in 30 yrs
- 2 days/yr
Risk factors via First Street. Map © Google.
Why this score? — see what drove the D- grade
The composite is a weighted blend of 9 inputs, each scored 0–100. Each bar is that input's sub-score; the figure is the points it added to the 100-point composite (weight × sub-score).
- Cash flow +15.0/30.0
- 1% rule +4.6/10.0
- DSCR +4.6/10.0
- Schools +4.1/10.0
- Livability +3.9/5.0
- Rent growth +2.8/5.0
- Condition / age +2.5/5.0
- ARV discount +0.0/15.0
- Appreciation +0.0/10.0
$300,000
🖨 Deal sheet 📄 Offer letter ✓ Due diligence
Listing remarks
Welcome to this beautifully maintained 2007-built home. This charming 2-bedroom, 2-bath residence offers the perfect blend of comfort, style, and convenience. Step inside to a bright, open-concept layout featuring a spacious kitchen with ample cabinetry, and seamless flow into the living and dining areas- perfect for both everyday living and entertaining. Ideally located just steps from the community clubhouse, you'll enjoy easy access to neighborhood amenities. Outside, a welcoming front porch provides the perfect spot to relax and soak up the Florida sunshine.
Key facts
- Ample cabinetry
- Community clubhouse
- Spacious kitchen
Tags
Property features AI
Finance
- Other: Pets allowed with breed restrictions
- HOA & community: Monthly association dues; Community amenities include clubhouse, fitness center, pool, shuffleboard, spa/hot tub, cafe/restaurant, and pickleball courts; Association dues include internet
Exterior
- Parking: Asphalt driveway; 2 parking spaces
- Utilities: Public water; Public sewer; Cable available; Electricity available; Sewer connected; Water available
- Home design: Mobile home; One story; South-facing
- Construction: Frame construction; Vinyl siding; Aluminum roof
- Exterior features: Open porch; Porch
Interior
- Kitchen: Electric range; Microwave; Refrigerator
- Bedrooms: 2 bedrooms on the main level
- Flooring: Laminate; Tile; Wood
- Bathrooms: 2 full bathrooms (main level)
- Heating & cooling: Central heating; Central air; Ceiling fans
- Interior features: Electric fireplace; Blinds
Neighborhood map
What this means for you Summary
Snapshot
- This is a 2-bed/2.0-bath manufactured listed at $300k.
Deal economics
- At list price, monthly cash flow is $92 ($1k/yr) — positive.
- The deal already cash-flows at list — no discount required.
- To meet the 1% rule (rent ≥ 1% of price), the offer needs to be $289k (3.6% below list).
- Recommended offer: $289k (3.6% below list) — sets the bar for 1% rule.
- Cap rate 6.7% vs local median 3.9% in Dania Beach — top-decile yield for the area; either an underpriced asset or a hidden risk that comps aren't pricing in. Stress-test before assuming the spread holds.
Location & tenants
- Location reads 77/100 on livability (#180 in FL, #2,806 nationally) — a middle-class / working-renter tenant base. Strengths: commute A+, cost of living A, housing A; Watch: employment D, amenities F.
- Broward (suburban): math 42% / reading 53% proficiency, ranked #46 of 73 in FL (top 63%) — families likely to look elsewhere, expect single-tenant / working-renter base with shorter leases.
- Zoned schools: Mary M Bethune Elementary School (math 27% / reading 27%, grade F, #1,969 of 2,144 statewide, top 94%, 413 students, 90% FRL); Attucks Middle School (math 35% / reading 46%, grade F, #360 of 571 statewide, top 64%, 738 students, 75% FRL); Hollywood Hills High School (math 14% / reading 31%, grade F, #539 of 667 statewide, top 81%, 1,718 students, 68% FRL) — zoned schools average 78% FRL vs 51% district-wide (27 pts higher); higher-poverty schools than district average — tighter screening recommended.
- Zoned-school proficiency averages 30% at this address vs 48% district-wide (-18 pts) — the specific schools serving this property underperform the Broward average; the district grade overstates school quality for this exact location.
- Market conditions: Rents rising (+1.3%/yr); 412 active listings in the ZIP; 40 comparable units currently listed for rent nearby; rentals at typical pace (median 24d on market — plan ~3-4 weeks tenant-placement turnaround); solid renter incomes; 2,111 units permitted in Broward County in 2024 (1,265 in 5+ unit buildings).
- At $2,893/mo this rent would consume 46% of the median local household income ($76k/yr) (locally 1903% of renters already pay >50% of income on rent) — very limited rent-growth headroom before tenants either downsize or default.
Forward outlook
- Local home prices are declining (-3.0%/yr); year-one equity from $2k of loan paydown is wiped out by about $9k of value loss. Plan a longer hold.
- Broward County population projected at +34% by 2050 — long-run rental-demand tailwind backs the buy-and-hold thesis.
Negotiation context
- It's been on market 47 days — a 3% lower offer ($291k) is reasonable based on typical stale-listing flexibility.
- Current owner paid $160k; list at $300k implies a 88% gain — meaningful room to come down on a strong offer.
Risks & watch-outs
- Climate carrying-cost: severe wind risk, 99% chance of damaging wind over 30y; extreme-heat days projected 6→21/yr by 2055 (HVAC capex compounding) — expect insurance premiums to compound above CPI over the hold.
Questions for the listing agent
- It's been on market 47 days. Have you received any prior offers? Is the seller open to a 4% concession, seller financing, or rate buy-down credit?
- What does the HOA fee cover, when was the last increase, and are there any pending special assessments or reserve-fund shortfalls?
- Is there a deadline driving the sale (1031 exchange, divorce, estate, relocation)? That informs how much negotiation room exists.
- Schools are D-rated, which usually means shorter tenancies and higher turnover. Who's the typical renter profile here, and what's been the actual vacancy rate?
- The area grade is low — what's the realistic commute time and amenity access for the typical tenant pool here? Any planned neighborhood developments (good or bad) we should know about?
- What's the average days-on-market for RENTAL listings here right now (not sales)? A rising rental-DOM trend means longer vacancies and softer asking-rent achievability than the comps imply.
- What's the recent tenant-quality profile in this submarket — average credit score on applications, eviction rate, late-payment / NSF rate, and stable-employment percentage? A property-management company in the area should have these aggregated.
- How much new for-sale + rental construction is in the pipeline within 1–3 miles? Heavy new supply typically softens prices + rents 12–24 months out; constrained supply supports both.
Investment metrics
- 1% rule
- 0.96% ✗
- Cap rate
- 6.66%
- Cash-on-cash
- 1.31%
- DSCR
- 1.06
- GRM
- 8.6
CMA / ARV
- ARV (on-the-fly)
- $251,738
- Comps found
- 3
Show comp detail 3 sales within ~0.75 mi
| Address | Dist | Beds/Ba | Sqft | Sold | Price | $/sf | Match |
|---|---|---|---|---|---|---|---|
| 3220 Teakwood Ln | 0.33mi | 3/2.0 (+1) | 1,268 (-4%) | 3mo | $279,000 | $220 | 71 |
| 2840 SW Cypress Dr | 0.32mi | 3/2.0 (+1) | 1,176 (-11%) | 2mo | $135,999 | $116 | 60 |
| 5608 Lagoon Dr | 0.33mi | 2/2.0 | 1,467 (+11%) | 15mo | $280,000 | $191 | 53 |
Match score weights: distance 35% · size 25% · config 20% · recency 20%. Top-matched comps best support the ARV.
Projected returns pro-forma
-3.0% appreciation · 1.3% rent growth · sell at horizon
- IRR
- -16.2%
- Equity multiple
- 0.43×
- Total profit
- $-47,526
- Equity at exit
- $44,731
- IRR
- -11.3%
- Equity multiple
- 0.37×
- Total profit
- $-52,689
- Equity at exit
- $25,939
Cash invested: $84,000 (down + closing). Projections, not guarantees.
Landlord ↔ Tenant lean methodology
- Overall (STATE)
- 87 Strongly Landlord-Friendly
- State Florida
- 87 Strongly Landlord-Friendly · R+3
- County
- — inherits STATE
- City
- — inherits STATE
ZIP-level market 33312
- Rents YoY
- 1.3%
- Active inventory
- 412
- Price-to-rent
- 8.6×
Monthly cashflow live
- Estimated rent
- $2,893 high interval (Pro) →
- Mortgage (P&I)
- −$1,573
- Tax from tax record
- −$381 /mo · $4,568/yr
- Insurance
- −$125
- HOA
- −$115
- Vacancy / Maint / Mgmt
- −$608
- Net cashflow
- $92
Break-even live
UW: 25.0% down · 7.5% · 30yr · 1.5% tax · 5.0% vac · 8.0% maint · 8.0% mgmt
Financing live
Cash to close
- Down payment
- $75,000
- Closing costs
- $9,000
- Reserves months
- —
- Total cash needed
- —
Loan-product check · same deal, 3 products live
Conventional
25% down · 7.5% · 30yr
- Down + closing
- —
- Monthly P&I
- —
- Monthly cashflow
- —
- DSCR
- —
- Eligible?
- —
Personal DTI + credit; lowest rate.
DSCR
20% down · 8.5% · 30yr
- Down + closing
- —
- Monthly P&I
- —
- Monthly cashflow
- —
- DSCR
- —
- Eligible?
- —
No personal income docs; deal must DSCR.
Hard money
10% down · 12.0% · 12mo
- Down + closing
- —
- Monthly P&I
- —
- Monthly cashflow
- —
- DSCR
- —
- Eligible?
- —
Short-term bridge; refi at stabilization.
Rent comps 40 comps
| Address | Beds | Baths | Sqft | Rent | $/sqft | DOM | Units | Dist |
|---|---|---|---|---|---|---|---|---|
| 3028 Lakeshore Dr Fort Lauderdale, FL | 3.0 | 2.0 | 1472 | $2,350 | $1.60 | 24d | 1 | 0.20mi |
| 5201 SW 31st Ave #183 Fort Lauderdale, FL | 3.0 | 2.0 | 1412 | $2,500 | $1.77 | 24d | 1 | 0.23mi |
| 2915 W Marina Dr Unit 2915 Fort Lauderdale, FL | 1.0 | 1.0 | 1080 | $1,800 | $1.67 | 17d | 1 | 0.23mi |
| 3050 Park Pl #5838 Fort Lauderdale, FL | 3.0 | 2.5 | 1854 | $3,950 | $2.13 | 24d | 1 | 0.26mi |
| 5201 SW 31st Ave #195 Fort Lauderdale, FL | 2.0 | 2.0 | 1348 | $2,699 | $2.00 | 24d | 1 | 0.26mi |
| 5201 SW 31st Ave #195 Fort Lauderdale, FL | 2.0 | 2.0 | 1348 | $2,600 | $1.93 | 7d | 1 | 0.26mi |
| 5201 SW 31st Ave #195 Fort Lauderdale, FL | 2.0 | 2.0 | 1348 | $2,649 | $1.97 | 11d | 1 | 0.26mi |
| 3100 SW 50th St Fort Lauderdale, FL | 2.0 | 1.5 | 1110 | $2,600 | $2.34 | 2d | 1 | 0.30mi |
| 4963 SW 31st Ter Unit 4963 Fort Lauderdale, FL | 2.0 | 2.5 | 1110 | $2,700 | $2.43 | 21d | 1 | 0.37mi |
| 2680 SW 54th St Fort Lauderdale, FL | 3.0 | 2.0 | 1592 | $2,000 | $1.26 | 24d | 1 | 0.37mi |
| 5840 Lakeshore Dr Fort Lauderdale, FL | 1.0–3.0 | 1.0–2.0 | 1056 | $3,034 | $2.87 | 1d | 31 | 0.38mi |
| 5597 Park Rd Fort Lauderdale, FL | 3.0 | 2.0 | 1038 | $3,000 | $2.89 | 24d | 1 | 0.39mi |
| 5180 SW 27th Ter Fort Lauderdale, FL | 3.0 | 2.0 | 1495 | $3,000 | $2.01 | 20d | 1 | 0.39mi |
| 3070 Red Mangrove Ln S Unit 202-2 Fort Lauderdale, FL | 3.0 | 3.0 | 1410 | $2,550 | $1.81 | 16d | 1 | 0.40mi |
| 4991 SW 32nd Ave Unit 4991 Fort Lauderdale, FL | 2.0 | 2.0 | 971 | $2,650 | $2.73 | 7d | 1 | 0.40mi |
| 5643 Park Rd Fort Lauderdale, FL | 3.0 | 2.0 | 1284 | $3,200 | $2.49 | 24d | 1 | 0.42mi |
| 5374 SW 33rd Ave Fort Lauderdale, FL | 3.0 | 2.0 | 1814 | $6,500 | $3.58 | 24d | 1 | 0.42mi |
| 4924 SW 30th Ter Fort Lauderdale, FL | 3.0 | 2.5 | 1820 | $2,950 | $1.62 | 15d | 1 | 0.43mi |
| 4905 SW 31st Ter #115 Fort Lauderdale, FL | 2.0 | 1.5 | 1110 | $2,500 | $2.25 | 24d | 1 | 0.43mi |
| 4904 SW 31st Ter Fort Lauderdale, FL | 2.0 | 1.5 | 1110 | $2,400 | $2.16 | 24d | 1 | 0.44mi |
| 5880 SW 32nd Ter Fort Lauderdale, FL | 1.0 | 1.0 | 900 | $1,800 | $2.00 | 24d | 1 | 0.48mi |
| 4962 SW 32nd Way Fort Lauderdale, FL | 3.0 | 2.0 | 1852 | $4,500 | $2.43 | 21d | 1 | 0.48mi |
| 4923 SW 32nd Ave Fort Lauderdale, FL | 2.0 | 2.0 | 971 | $2,650 | $2.73 | 2d | 1 | 0.48mi |
| 4923 SW 32nd Ave Fort Lauderdale, FL | 2.0 | 2.0 | 971 | $2,800 | $2.88 | 16d | 1 | 0.48mi |
| 5420 SW 25th Ave Fort Lauderdale, FL | 3.0 | 2.0 | 1135 | $2,975 | $2.62 | 24d | 1 | 0.49mi |
| 2701 SW 58th Mnr Unit B Fort Lauderdale, FL | 2.0 | 2.0 | 1292 | $2,750 | $2.13 | 20d | 1 | 0.49mi |
| 5434 SW 25th Ave Fort Lauderdale, FL | 3.0 | 2.0 | 1318 | $3,750 | $2.85 | 24d | 1 | 0.50mi |
| 5221 SW 25th Ave Fort Lauderdale, FL | 3.0 | 2.0 | 1084 | $2,700 | $2.49 | 5d | 1 | 0.50mi |
| 4878 SW 32nd Ter Fort Lauderdale, FL | 3.0 | 2.5 | 1520 | $3,300 | $2.17 | 18d | 1 | 0.51mi |
| 5120 SW 26th Ave Unit 1-2 Fort Lauderdale, FL | 2.0 | 1.0 | 1612 | $2,100 | $1.30 | 2d | 1 | 0.51mi |
| 5120 SW 26th Ave Unit 1-2 Fort Lauderdale, FL | 2.0 | 1.0 | 1612 | $2,100 | $1.30 | 3d | 1 | 0.51mi |
| 2630 SW 49th Ct Fort Lauderdale, FL | 3.0 | 3.0 | 1404 | $3,195 | $2.28 | 24d | 1 | 0.53mi |
| 4920 SW 27th Ave Unit 4920 Fort Lauderdale, FL | 3.0 | 2.0 | 1140 | $3,500 | $3.07 | 3d | 1 | 0.55mi |
| 4920 SW 27th Ave Fort Lauderdale, FL | 3.0 | 2.0 | 1140 | $3,500 | $3.07 | 24d | 1 | 0.55mi |
| 3330 SW 50th St Fort Lauderdale, FL | 3.0 | 2.0 | 1648 | $8,000 | $4.85 | 24d | 1 | 0.56mi |
| 2461 SW 50th St Fort Lauderdale, FL | 2.0 | 2.0 | 1008 | $2,300 | $2.28 | 24d | 1 | 0.57mi |
| 5605 SW 24th Ave Fort Lauderdale, FL | 3.0 | 2.0 | 1333 | $3,500 | $2.63 | 24d | 1 | 0.61mi |
| 4938 SW 33rd Way Fort Lauderdale, FL | 3.0 | 2.0 | 1852 | $4,500 | $2.43 | 24d | 1 | 0.61mi |
| 4936 Whispering Way Fort Lauderdale, FL | 3.0 | 2.5 | 1508 | $4,150 | $2.75 | 7d | 1 | 0.62mi |
| 4936 Whispering Way Unit 4936 Fort Lauderdale, FL | 3.0 | 2.5 | 1508 | $4,250 | $2.82 | 24d | 1 | 0.62mi |
HOA detail
- Monthly dues
- $115 · $1,380/yr
Listing history 17 events
-
2026-06-18days on market $300,000 Active 47 DOM
-
2026-06-17days on market $300,000 Active 46 DOM
-
2026-06-16days on market $300,000 Active 45 DOM
-
2026-06-15days on market $300,000 Active 44 DOM
-
2026-06-13days on market $300,000 Active 42 DOM
-
2026-06-09days on market $300,000 Active 38 DOM
-
2026-06-08days on market $300,000 Active 37 DOM
-
2026-06-07days on market $300,000 Active 36 DOM
-
2026-06-04days on market $300,000 Active 33 DOM
-
2026-06-03days on market $300,000 Active 32 DOM
-
2026-06-02days on market $300,000 Active 31 DOM
-
2026-06-01days on market $300,000 Active 30 DOM
-
2026-05-31days on market $300,000 Active 29 DOM
-
2026-05-02$300,000 Active
-
2019-07-29soldstatus $160,000
-
1987-10-14soldstatus $37,000
-
1980-08-01soldstatus $24,000
ⓘ Source: listings_history table (triggers on properties + properties_extension) + one-shot
backfill from property_details.listing_events for pre-trigger history.
Tax reassessment forecast FL · Resets to sale price
- Current annual tax
- $4,568 · $381/mo
- Projected year-2 tax
- $4,568 · $381/mo
- Expected delta
- $0/yr ($0/mo · 0.0%)
ⓘ Screening estimate from a state-policy table — verify with the county assessor before closing.
Climate risk First Street
- Flood 4/10 Moderate FEMA zone X (shaded) · 20% chance over 30 yrs
- Wildfire 1/10 Low
- Heat 10/10 Extreme 6 d/yr ≥105°F today · 21 d/yr by 30 yrs out
- Wind 10/10 Extreme 99% chance of damaging wind over 30 yrs
- Air quality 2/10 Low 2 unhealthy d/yr today · 2 by 30 yrs out
Nearby sold comps map
Loading sold comps map…
Walkable amenities ~0.75 mi
Loading nearby amenities…
Taxation est. · year 1
- Rental income
- $34,717
- − Mortgage interest
- −$16,805
- − Property taxes
- −$4,568
- − Insurance
- −$1,500
- − Repairs & maintenance
- −$2,777
- − Management
- −$2,777
- − HOA
- −$1,380
- − Depreciation
- −$8,727
- Taxable loss
- −$3,818
- Est. tax savings @ 24.0%
- +$916
- After-tax cash flow
- $2,016/yr
For passive investors: Depreciation is non-cash, so a rental often shows a tax loss while cash-flowing — sheltering income. Rental losses are passive: they offset passive income freely, and up to $25,000/yr can offset ordinary (W-2) income if you actively participate and your MAGI is under $100k (phasing out to $0 by $150k); unused losses carry forward. On sale, claimed depreciation is recaptured at up to 25%, and gains may owe capital-gains tax (a 1031 exchange can defer both). Figures are a year-1 estimate at your 24.0% rate — not tax advice; consult a CPA.
Schools (NCES district)
- District
- Broward
- NCES district ID
- 1200180
- Math proficiency
- 42% ▼ -18.00%
- Reading proficiency
- 53% ▼ -5.00%
- Median HH income
- $52,139
- Composite
- 40.88/100
- National rank
- #3621
- State rank
- #46 of 73 in FL
Livability — Dania Beach
- Score
- 77/100
- State rank
- #180
- US rank
- #2806
Category grades
Schools grade is shown separately in the Schools card above.
Census & demographics
- Census place
- Dania Beach, FL
- County
- Broward County · 1,963,430 people
- City population
- 17,094
- Metro
- Miami-Fort Lauderdale-Pompano Beach, FL
- Population (ZIP)
- 52,798
- Household income
- $75,952
- Rent vs Own
- Severe rent burden
- 1903.0
Population outlook (Broward County) Hauer SSP2
- Today (2025)
- 2,207,033 people
- By 2030
- 2,360,704 · +7.0%
- By 2040
- 2,661,208 · +20.6%
- By 2050
- 2,946,698 · +33.5%
- By 2075
- 3,602,273 · +63.2%
- By 2100
- 3,970,984 · +79.9%
Race, ethnicity, and origin ACS 2023
- Neighborhood character
- Highly diverse neighborhood (Simpson 0.70)
- Race & ethnicity
- White 34% Hispanic / Latino 32% Black 29% Two or more races 20% Asian 2%
- Hispanic origin (detail)
- Mexican 2% Puerto Rican 5% Cuban 6% Salvadoran 1%
- Common ancestry
- Hispanic 6% Romanian 3% Italian 1%
- Foreign-born
- 33% · Canada, Jamaica, Dominican Republic
- Languages at home
- 59% English-only · Spanish 29% French/Haitian/Cajun 7% Other Indo-European 2%
Political lean MEDSL · Broward
- 2024 margin
- D (+17.0) · D 58.0% · R 41.0%
- 2008→2024 swing
- -17.8pp toward R · 2008: 34.7pp · 2024: 17.0pp
- All cycles
- 2024: D+17.0 2020: D+29.8 2016: D+35.0 2012: D+34.9 2008: D+34.7
Not yet ingested
- Civics
- —
Market trends
- HPI YoY
- ▼ -323.99%
- Current HPI
- 382.6298
- Rent YoY
- ▲ 1.30%
- Metro
- Miami-Fort Lauderdale-Pompano Beach, FL
- State GDP YoY
- ▲ 3.28%
- F500 in state
- 36
Industry mix (Fortune 500 HQ in FL)
| Industry | F500 HQs | Revenue |
|---|---|---|
| Industrial Technology | 2 | $29B |
|
||
| Insurance | 2 | $17B |
|
||
| Retail | 1 | $60B |
|
||
| Technology Distribution | 1 | $58B |
|
||
| Homebuilding | 1 | $35B |
|
||
| Technology Manufacturing | 1 | $35B |
|
||
Price history
+1150.0% since first listed4 events — show timeline
- 2026-05-02 Listed $300,000 Beaches MLS
- 2019-07-29 Sold (Public Records) $160,000 Public Records
- 1987-10-14 Sold (Public Records) $37,000 Public Records
- 1980-08-01 Sold (Public Records) $24,000 Public Records
Property tax history
+8.7%/yrLatest (2025): $4,568 · +10.3% YoY. Source: county tax records.
Cash-flow waterfall
monthlySold comps — $/sqft
last 12 mo · ≤1 miLoading sold comps…