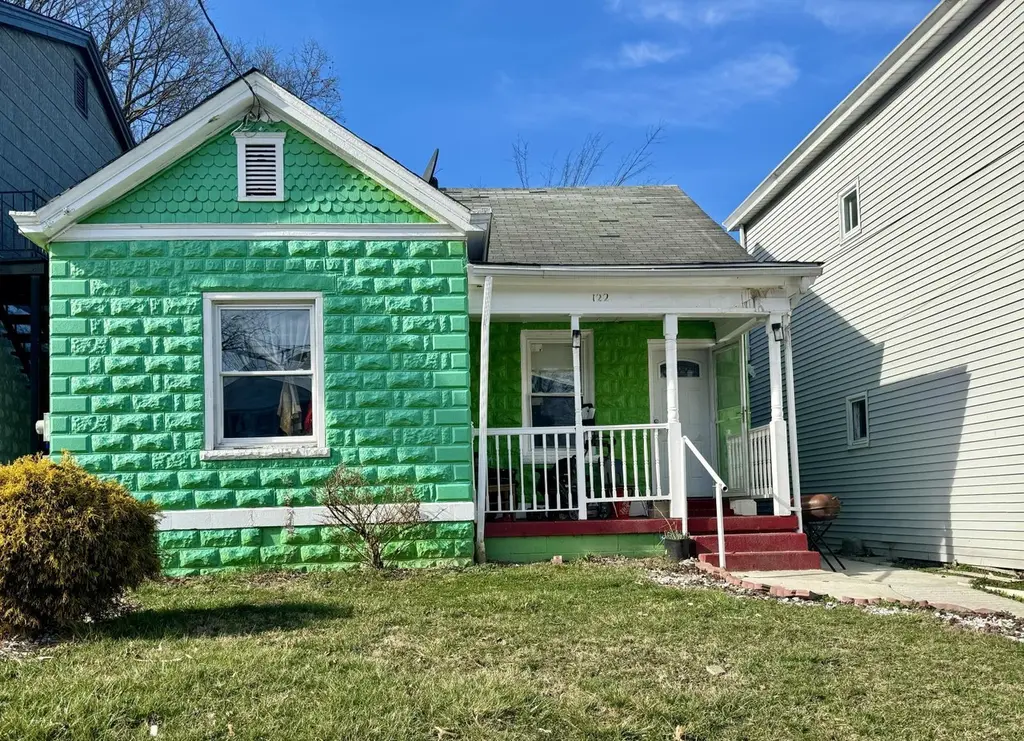
122 W 32nd St W · Covington, KY
Flood risk 1/10 · Minimal
- FEMA flood zone
- X (unshaded)
- Chance of flooding over 30 yrs
- 0.0%
- Est. flood insurance / yr
- $507 – $1,088
Fire risk 3/10 · Minor
- Est. fire insurance / yr
- $839 – $1,559
Heat risk 5/10 · Moderate
- Hot days now (above 102°F)
- 7 days/yr
- Hot days in 30 yrs
- 20 days/yr
Wind risk 2/10 · Minimal
- Chance of severe wind over 30 yrs
- 1.0%
Air-quality risk 3/10 · Minor
- Unhealthy air days now
- 2 days/yr
- Unhealthy air days in 30 yrs
- 3 days/yr
Risk factors via First Street. Map © Google.
Why this score? — see what drove the C grade
The composite is a weighted blend of 9 inputs, each scored 0–100. Each bar is that input's sub-score; the figure is the points it added to the 100-point composite (weight × sub-score).
- Cash flow +25.4/30.0
- DSCR +8.4/10.0
- ARV discount +7.5/15.0
- 1% rule +6.4/10.0
- Livability +4.3/5.0
- Rent growth +2.5/5.0
- Condition / age +2.5/5.0
- Schools +1.5/10.0
- Appreciation +0.0/10.0
$149,900
🖨 Deal sheet 📄 Offer letter ✓ Due diligence
Listing remarks
Great Investment Opportunity - Duplex with Strong Rental Income! Don't miss your chance to grow your investment portfolio with this income-producing property! This duplex features two separate units that generates a combined monthly income of $2095. Each unit offers functional living space and reliable rental history, making it ideal for both seasoned investors and those just starting out. Please note: photos were taken prior to tenants move-in. Buyer/Buyer's Agent to verify all information
Key facts
- Two separate units
- Duplex
- Strong rental income
Tags
Property features AI
Exterior
- Parking: On-street parking
- Utilities: Public water; Private sewer; Cable available
- Home design: Multi Family property; Two levels
- Construction: Block and concrete construction; Block foundation; Built as multi-unit (2 total units)
- Exterior features: Shingle roof; Existing structure
Interior
- Kitchen: Electric range
- Bathrooms: Three full bathrooms
- Heating & cooling: Forced air heating; Central air; Wall unit(s)
- Interior features: Electric range; Central air and wall unit(s) for cooling; Forced air heating
Neighborhood map
What this means for you Summary
Snapshot
- This is a 6-bed/1.0-bath single-family listed at $150k.
Deal economics
- At list price, monthly cash flow is $346 ($4k/yr) — positive.
- The deal already cash-flows at list — no discount required.
- Meets the 1% rule at list price ($2k rent vs $150k).
- Recommended offer: $145k (3.0% below list) — sets the bar for market timing.
- Cap rate 9.1% vs local median 5.3% in Covington — top-decile yield for the area; either an underpriced asset or a hidden risk that comps aren't pricing in. Stress-test before assuming the spread holds.
Location & tenants
- Location reads 86/100 on livability (#40 in KY, #376 nationally) — a professional / high-income tenant draw. Strengths: amenities A+, commute A+, cost of living A+; Watch: employment D+.
- Covington Independent (suburban): math 10% / reading 27% proficiency, ranked #162 of 165 in KY (top 98%) — low school quality limits family demand, transient renter base, plan for 1-2y turnover; 78% free/reduced lunch — lower-income household profile, screen leases tightly.
- Zoned schools: Ninth District Elementary (math 2% / reading 17%, grade F, #648 of 676 statewide, top 98%, 341 students, 87% FRL); Holmes Middle School (math 8% / reading 26%, grade F, #211 of 217 statewide, top 97%, 656 students, 84% FRL); Covington Adult High School (10 students, 80% FRL).
- Market conditions: 158 active listings in the ZIP; 699 units permitted in Kenton County in 2024 (287 in 5+ unit buildings).
Forward outlook
- Local home prices are declining (-3.0%/yr); year-one equity from $1k of loan paydown is wiped out by about $4k of value loss. Plan a longer hold.
- Kenton County population projected at +5% by 2050 — modest demand growth; plan on rents tracking national, not racing it.
Negotiation context
- It's been on market 56 days — a 3% lower offer ($145k) is reasonable based on typical stale-listing flexibility.
- 7 sale attempts since 10y ago with the ask held roughly flat each time — persistent listings suggest the price (not the market) is what's stuck; bring a comps-based counter.
Risks & watch-outs
- Climate carrying-cost: extreme-heat days projected 7→20/yr by 2055 (HVAC capex compounding) — expect insurance premiums to compound above CPI over the hold.
Questions for the listing agent
- It's been on market 56 days. Have you received any prior offers? Is the seller open to a 3% concession, seller financing, or rate buy-down credit?
- Is there a deadline driving the sale (1031 exchange, divorce, estate, relocation)? That informs how much negotiation room exists.
- What's the average days-on-market for RENTAL listings here right now (not sales)? A rising rental-DOM trend means longer vacancies and softer asking-rent achievability than the comps imply.
- What's the recent tenant-quality profile in this submarket — average credit score on applications, eviction rate, late-payment / NSF rate, and stable-employment percentage? A property-management company in the area should have these aggregated.
- How much new for-sale + rental construction is in the pipeline within 1–3 miles? Heavy new supply typically softens prices + rents 12–24 months out; constrained supply supports both.
Investment metrics
- 1% rule
- 1.14% ✓
- Cap rate
- 9.06%
- Cash-on-cash
- 9.88%
- DSCR
- 1.44
- GRM
- 7.3
CMA / ARV
No comps found within radius.
Projected returns pro-forma
-3.0% appreciation · 3.0% rent growth · sell at horizon
- IRR
- -1.4%
- Equity multiple
- 0.95×
- Total profit
- $-2,271
- Equity at exit
- $22,351
- IRR
- 8.3%
- Equity multiple
- 1.63×
- Total profit
- $26,390
- Equity at exit
- $12,961
Cash invested: $41,972 (down + closing). Projections, not guarantees.
Landlord ↔ Tenant lean methodology
- Overall (STATE)
- 83 Strongly Landlord-Friendly
- State Kentucky
- 83 Strongly Landlord-Friendly · R+16
- County
- — inherits STATE
- City
- — inherits STATE
ZIP-level market 41015
- Active inventory
- 158
- Price-to-rent
- 7.3×
Monthly cashflow live
- Estimated rent
- $1,706 medium interval (Pro) →
- Mortgage (P&I)
- −$786
- Tax from tax record
- −$153 /mo · $1,839/yr
- Insurance
- −$62
- HOA
- −$0
- Vacancy / Maint / Mgmt
- −$358
- Net cashflow
- $346
Break-even live
UW: 25.0% down · 7.5% · 30yr · 1.5% tax · 5.0% vac · 8.0% maint · 8.0% mgmt
Financing live
Cash to close
- Down payment
- $37,475
- Closing costs
- $4,497
- Reserves months
- —
- Total cash needed
- —
Loan-product check · same deal, 3 products live
Conventional
25% down · 7.5% · 30yr
- Down + closing
- —
- Monthly P&I
- —
- Monthly cashflow
- —
- DSCR
- —
- Eligible?
- —
Personal DTI + credit; lowest rate.
DSCR
20% down · 8.5% · 30yr
- Down + closing
- —
- Monthly P&I
- —
- Monthly cashflow
- —
- DSCR
- —
- Eligible?
- —
No personal income docs; deal must DSCR.
Hard money
10% down · 12.0% · 12mo
- Down + closing
- —
- Monthly P&I
- —
- Monthly cashflow
- —
- DSCR
- —
- Eligible?
- —
Short-term bridge; refi at stabilization.
Listing history 23 events
-
2026-05-15status Pending
-
2026-03-16$149,900 Active
-
2026-01-01historical
-
2025-05-25price $159,900
-
2025-02-25price $169,900
-
2025-02-10price $173,900
-
2025-01-01$174,900 Active
-
2024-12-28historical
-
2024-11-07price $179,900
-
2024-10-10price $183,000
-
2024-09-25$187,900 Active
-
2024-02-01soldstatus $136,200
-
2024-01-31soldstatus $136,200 Sold
-
2024-01-30status Pending
-
2023-12-08$150,000 Active
-
2022-06-04status Active
-
2022-05-29status Pending
-
2022-05-29historical
-
2022-05-27price $110,000
-
2022-05-10$120,000 Active
-
2017-01-04soldstatus $18,000
-
2016-10-31$18,000
-
2001-05-14soldstatus $37,000
ⓘ Source: listings_history table (triggers on properties + properties_extension) + one-shot
backfill from property_details.listing_events for pre-trigger history.
Tax reassessment forecast KY · Resets to sale price
- Current annual tax
- $1,839 · $153/mo
- Projected year-2 tax
- $1,839 · $153/mo
- Expected delta
- $0/yr ($0/mo · 0.0%)
ⓘ Screening estimate from a state-policy table — verify with the county assessor before closing.
Climate risk First Street
- Flood 1/10 Low FEMA zone X (unshaded) · 0% chance over 30 yrs
- Wildfire 3/10 Moderate
- Heat 5/10 Major 7 d/yr ≥102°F today · 20 d/yr by 30 yrs out
- Wind 2/10 Low 100% chance of damaging wind over 30 yrs
- Air quality 3/10 Moderate 2 unhealthy d/yr today · 3 by 30 yrs out
Nearby sold comps map
Loading sold comps map…
Walkable amenities ~0.75 mi
Loading nearby amenities…
Taxation est. · year 1
- Rental income
- $20,467
- − Mortgage interest
- −$8,397
- − Property taxes
- −$1,839
- − Insurance
- −$750
- − Repairs & maintenance
- −$1,637
- − Management
- −$1,637
- − Depreciation
- −$4,361
- Taxable income
- $1,847
- Est. tax owed @ 24.0%
- −$443
- After-tax cash flow
- $3,705/yr
For passive investors: Depreciation is non-cash, so a rental often shows a tax loss while cash-flowing — sheltering income. Rental losses are passive: they offset passive income freely, and up to $25,000/yr can offset ordinary (W-2) income if you actively participate and your MAGI is under $100k (phasing out to $0 by $150k); unused losses carry forward. On sale, claimed depreciation is recaptured at up to 25%, and gains may owe capital-gains tax (a 1031 exchange can defer both). Figures are a year-1 estimate at your 24.0% rate — not tax advice; consult a CPA.
Schools (NCES district)
- District
- Covington Independent
- NCES district ID
- 2101350
- Math proficiency
- 10% ▼ -20.00%
- Reading proficiency
- 27% ▼ -14.00%
- Median HH income
- $33,681
- Composite
- 15.04/100
- National rank
- #9353
- State rank
- #162 of 165 in KY
Livability — Covington
- Score
- 86/100
- State rank
- #40
- US rank
- #376
Category grades
Schools grade is shown separately in the Schools card above.
Census & demographics
- Census place
- Covington, KY
- City population
- 34,373
- Population (ZIP)
- 20,396
Population outlook (Kenton County) Hauer SSP2
- Today (2025)
- 174,205 people
- By 2030
- 177,897 · +2.1%
- By 2040
- 182,671 · +4.9%
- By 2050
- 183,543 · +5.4%
- By 2075
- 178,977 · +2.7%
- By 2100
- 159,920 · -8.2%
Race, ethnicity, and origin ACS 2023
- Neighborhood character
- Predominantly White (90%)
- Race & ethnicity
- White 90% Two or more races 6% Black 3% Hispanic / Latino 2%
- Common ancestry
- Lithuanian 2% Romanian 2% Slovak 2%
- Foreign-born
- 2% · Canada
- Languages at home
- 97% English-only · Arabic 1% French/Haitian/Cajun 1%
Political lean MEDSL · Kenton
- 2024 margin
- Strong R (+21.7) · D 38.2% · R 59.9% · Other 1.9%
- 2008→2024 swing
- -0.9pp no change · 2008: -20.9pp · 2024: -21.7pp
- All cycles
- 2024: R+21.7 2020: R+19.3 2016: R+26.1 2012: R+24.3 2008: R+20.9
Not yet ingested
- Civics
- —
Market trends
- HPI YoY
- ▼ -110.37%
- Current HPI
- 203.7263
- Rent YoY
- —
- Metro
- —
- State GDP YoY
- ▲ 1.81%
- F500 in state
- 4
Industry mix (Fortune 500 HQ in KY)
| Industry | F500 HQs | Revenue |
|---|---|---|
| Healthcare | 1 | $118B |
|
||
| Food / Beverage | 1 | $7B |
|
||
Price history
+305.1% since first listed23 events — show timeline
- 2026-05-15 Pending — NKMLS
- 2026-03-16 Listed $149,900 NKMLS
- 2026-01-01 Listing Removed — NKMLS
- 2025-05-25 Price Changed $159,900 NKMLS
- 2025-02-25 Price Changed $169,900 NKMLS
- 2025-02-10 Price Changed $173,900 NKMLS
- 2025-01-01 Listed $174,900 NKMLS
- 2024-12-28 Listing Removed — NKMLS
- 2024-11-07 Price Changed $179,900 NKMLS
- 2024-10-10 Price Changed $183,000 NKMLS
- 2024-09-25 Listed $187,900 NKMLS
- 2024-02-01 Sold (Public Records) $136,200 Public Records
- 2024-01-31 Sold (MLS) $136,200 NKMLS
- 2024-01-30 Pending — NKMLS
- 2023-12-08 Listed $150,000 NKMLS
- 2022-06-04 Relisted — NKMLS
- 2022-05-29 Pending — NKMLS
- 2022-05-29 Listing Removed — NKMLS
- 2022-05-27 Price Changed $110,000 NKMLS
- 2022-05-10 Listed $120,000 NKMLS
- 2017-01-04 Sold (MLS) $18,000 NKMLS
- 2016-10-31 Listed $18,000 NKMLS
- 2001-05-14 Sold (Public Records) $37,000 Public Records
Property tax history
+4.9%/yrLatest (2025): $1,839 · +6.8% YoY. Source: county tax records.
Cash-flow waterfall
monthlySold comps — $/sqft
last 12 mo · ≤1 miLoading sold comps…