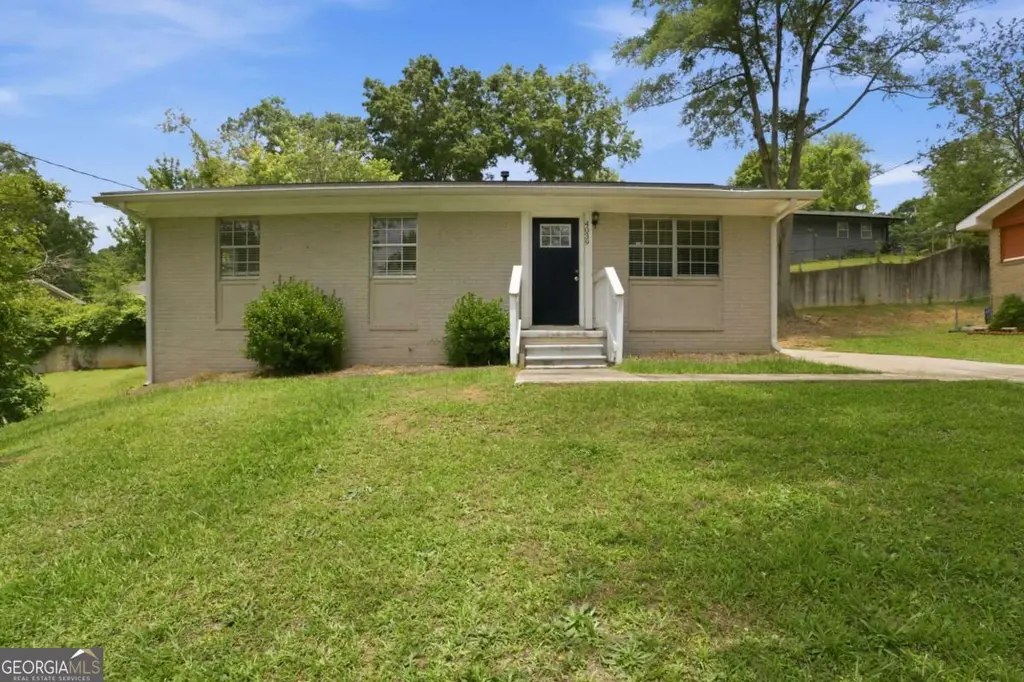
4039 Codel St SW · Atlanta, GA
Flood risk 1/10 · Minimal
- FEMA flood zone
- X (unshaded)
- Chance of flooding over 30 yrs
- 0.0%
- Est. flood insurance / yr
- $473 – $860
Fire risk 2/10 · Minimal
- Est. fire insurance / yr
- $963 – $1,789
Heat risk 5/10 · Moderate
- Hot days now (above 103°F)
- 7 days/yr
- Hot days in 30 yrs
- 17 days/yr
Wind risk 6/10 · Moderate
- Chance of severe wind over 30 yrs
- 27.0%
Air-quality risk 4/10 · Minor
- Unhealthy air days now
- 3 days/yr
- Unhealthy air days in 30 yrs
- 5 days/yr
Risk factors via First Street. Map © Google.
Why this score? — see what drove the D+ grade
The composite is a weighted blend of 9 inputs, each scored 0–100. Each bar is that input's sub-score; the figure is the points it added to the 100-point composite (weight × sub-score).
- Cash flow +19.7/30.0
- ARV discount +6.4/15.0
- DSCR +6.2/10.0
- 1% rule +4.6/10.0
- Livability +4.2/5.0
- Rent growth +3.2/5.0
- Schools +2.7/10.0
- Condition / age +2.5/5.0
- Appreciation +0.0/10.0
$179,220
🖨 Deal sheet 📄 Offer letter ✓ Due diligence
Listing remarks MLS
Discover the potential of this inviting Atlanta home situated in an established southwest Atlanta neighborhood. The floor plan offers comfortable living spaces with a natural flow between the main gathering areas, creating an ideal setting for both everyday living and entertaining. The kitchen provides ample workspace and storage, while the bedrooms offer flexibility for family, guests, or a home office. Outside, the yard presents opportunities for outdoor enjoyment, gardening, or creating your own private retreat. Conveniently located near shopping, dining, parks, and major commuter routes, this property offers easy access to everything Atlanta has to offer. Whether you're looking for a place to call home or your next investment opportunity, this property is ready for its next chapter.
Key facts
- 7,819 sq ft lot
- Built 1973
- Listed 12 days
Tags
Property features AI
Exterior
- Parking: Driveway with open parking
- Utilities: Water: other; Sewer: other; Electric: other; Other utilities: other
- Home design: One-level home; Resale property
- Construction: Brick on all sides; Composition roof; Slab foundation; Built/finished above grade area approximately 1,000
- Exterior features: Asphalt road frontage on a city street
Interior
- Kitchen: White cabinets; Eat-in kitchen; Solid surface counters; Dishwasher; Gas range; Microwave; Refrigerator
- Bedrooms: Three main-level bedrooms
- Flooring: Vinyl
- Bathrooms: One full bathroom (main level)
- Heating & cooling: Central heating; Central air conditioning
- Interior features: Open floor plan with view from the kitchen to the family room; No shared/common walls; Crawl space foundation
- Laundry & utility: Laundry area (details not specified)
Neighborhood map
What this means for you Summary
Snapshot
- This is a 3-bed/1.0-bath single-family listed at $179k.
Deal economics
- At list price, monthly cash flow is $209 ($3k/yr) — positive.
- The deal already cash-flows at list — no discount required.
- To meet the 1% rule (rent ≥ 1% of price), the offer needs to be $173k (3.6% below list).
- Recommended offer: $173k (3.6% below list) — sets the bar for 1% rule.
- Cap rate 7.7% vs local median 3.1% in Atlanta — top-decile yield for the area; either an underpriced asset or a hidden risk that comps aren't pricing in. Stress-test before assuming the spread holds.
Location & tenants
- Location reads 83/100 on livability (#6 in GA, #919 nationally) — a professional / high-income tenant draw. Strengths: amenities A+, commute A+, housing A+; Watch: cost of living C-.
- Atlanta Public Schools (urban): math 28% / reading 35% proficiency, ranked #80 of 174 in GA (top 46%) — families likely to look elsewhere, expect single-tenant / working-renter base with shorter leases; 71% free/reduced lunch — lower-income household profile, screen leases tightly.
- Zoned schools: Jean Childs Young Middle School (math 2% / reading 12%, grade F, #449 of 470 statewide, top 97%, 747 students, 100% FRL); Benjamin E. Mays High School (math 22% / reading 15%, grade F, #254 of 424 statewide, top 61%, 1,337 students, 100% FRL) — zoned schools average 100% FRL vs 71% district-wide (29 pts higher); higher-poverty schools than district average — tighter screening recommended.
- Zoned-school proficiency averages 13% at this address vs 32% district-wide (-19 pts) — the specific schools serving this property underperform the Atlanta Public Schools average; the district grade overstates school quality for this exact location.
- Market conditions: Rents rising (+2.6%/yr); 483 active listings in the ZIP; 37 comparable units currently listed for rent nearby; rentals at typical pace (median 25d on market — plan ~3-4 weeks tenant-placement turnaround); 11,565 units permitted in Fulton County in 2024 (8,159 in 5+ unit buildings).
- This rent runs 33% of the median local income ($63k/yr) — at the standard rent-burdened threshold; future hikes will face affordability resistance.
Forward outlook
- Local home prices are declining (-3.0%/yr); year-one equity from $1k of loan paydown is wiped out by about $5k of value loss. Plan a longer hold.
- Fulton County population projected at +38% by 2050 — long-run rental-demand tailwind backs the buy-and-hold thesis.
Negotiation context
- Only 13 days on market — expect competitive offers; lowballing is unlikely to land.
- 5 sale attempts since 7y ago with the ask held roughly flat each time — persistent listings suggest the price (not the market) is what's stuck; bring a comps-based counter.
- Current owner paid $86k; list at $179k implies a 109% gain — meaningful room to come down on a strong offer.
Risks & watch-outs
- Climate carrying-cost: major wind risk, 27% chance of damaging wind over 30y; extreme-heat days projected 7→17/yr by 2055 (HVAC capex compounding) — expect insurance premiums to compound above CPI over the hold.
Questions for the listing agent
- Built in 1973 — when were the roof, HVAC, electrical panel, plumbing, and water heater last replaced?
- Is there a deadline driving the sale (1031 exchange, divorce, estate, relocation)? That informs how much negotiation room exists.
- The area grade is low — what's the realistic commute time and amenity access for the typical tenant pool here? Any planned neighborhood developments (good or bad) we should know about?
- What's the average days-on-market for RENTAL listings here right now (not sales)? A rising rental-DOM trend means longer vacancies and softer asking-rent achievability than the comps imply.
- What's the recent tenant-quality profile in this submarket — average credit score on applications, eviction rate, late-payment / NSF rate, and stable-employment percentage? A property-management company in the area should have these aggregated.
- How much new for-sale + rental construction is in the pipeline within 1–3 miles? Heavy new supply typically softens prices + rents 12–24 months out; constrained supply supports both.
Investment metrics
- 1% rule
- 0.96% ✗
- Cap rate
- 7.69%
- Cash-on-cash
- 4.99%
- DSCR
- 1.22
- GRM
- 8.6
CMA / ARV
- ARV (on-the-fly)
- $175,000
- Comps found
- 12
Show comp detail 12 sales within ~0.75 mi
| Address | Dist | Beds/Ba | Sqft | Sold | Price | $/sf | Match |
|---|---|---|---|---|---|---|---|
| 4062 Doster Dr SW | 0.05mi | 3/1.0 | 1,000 (0%) | 10mo | $192,000 | $192 | 90 |
| 4077 Codel St SW | 0.07mi | 3/1.0 | 1,050 (+5%) | 9mo | $183,500 | $175 | 81 |
| 4009 Ester Dr SW | 0.08mi | 3/1.0 | 1,056 (+6%) | 11mo | $130,000 | $123 | 78 |
| 445 Wilson Mill Rd SW | 0.24mi | 3/1.5 | 1,053 (+5%) | 4mo | $193,500 | $184 | 75 |
| 4063 Cornell Blvd SW | 0.48mi | 3/2.0 | 1,000 (0%) | 4mo | $125,000 | $125 | 70 |
| 4245 Utoy Ct SW | 0.62mi | 3/1.5 | 1,000 (0%) | 0mo | $98,000 | $98 | 69 |
| 3785 Boulder Park Dr SW | 0.54mi | 3/1.0 | 1,032 (+3%) | 1mo | $110,000 | $107 | 68 |
| 4225 Bakers Ferry Rd | 0.33mi | 2/1.5 (-1) | 1,056 (+6%) | 0mo | $77,500 | $73 | 68 |
| 3991 Adamsville Dr SW | 0.61mi | 3/2.0 | 1,016 (+2%) | 8mo | $190,000 | $187 | 58 |
| 4310 Bakers Ferry Rd SW | 0.51mi | 4/2.0 (+1) | 1,084 (+8%) | 8mo | $213,000 | $196 | 47 |
| 232 Whitworth Dr SW | 0.53mi | 4/2.0 (+1) | 1,075 (+8%) | 11mo | $270,000 | $251 | 45 |
| 673 Utoy Cir SW | 0.71mi | 3/1.5 | 1,125 (+12%) | 2mo | $185,000 | $164 | 42 |
Match score weights: distance 35% · size 25% · config 20% · recency 20%. Top-matched comps best support the ARV.
Projected returns pro-forma
-3.0% appreciation · 2.63% rent growth · sell at horizon
- IRR
- -8.9%
- Equity multiple
- 0.67×
- Total profit
- $-16,410
- Equity at exit
- $26,722
- IRR
- 0.0%
- Equity multiple
- 1.00×
- Total profit
- $122
- Equity at exit
- $15,496
Cash invested: $50,182 (down + closing). Projections, not guarantees.
Landlord ↔ Tenant lean methodology
- Overall (STATE)
- 90 Strongly Landlord-Friendly
- State Georgia
- 90 Strongly Landlord-Friendly · R+3
- County
- — inherits STATE
- City
- — inherits STATE
ZIP-level market 30331
- Home prices YoY
- -34.2%
- Rents YoY
- 2.6%
- Active inventory
- 483
- Price-to-rent
- 8.6×
Monthly cashflow live
- Estimated rent
- $1,728 high interval (Pro) →
- Mortgage (P&I)
- −$940
- Tax from tax record
- −$142 /mo · $1,705/yr
- Insurance
- −$75
- HOA
- −$0
- Vacancy / Maint / Mgmt
- −$363
- Net cashflow
- $209
Break-even live
UW: 25.0% down · 7.5% · 30yr · 1.5% tax · 5.0% vac · 8.0% maint · 8.0% mgmt
Financing live
Cash to close
- Down payment
- $44,805
- Closing costs
- $5,377
- Reserves months
- —
- Total cash needed
- —
Loan-product check · same deal, 3 products live
Conventional
25% down · 7.5% · 30yr
- Down + closing
- —
- Monthly P&I
- —
- Monthly cashflow
- —
- DSCR
- —
- Eligible?
- —
Personal DTI + credit; lowest rate.
DSCR
20% down · 8.5% · 30yr
- Down + closing
- —
- Monthly P&I
- —
- Monthly cashflow
- —
- DSCR
- —
- Eligible?
- —
No personal income docs; deal must DSCR.
Hard money
10% down · 12.0% · 12mo
- Down + closing
- —
- Monthly P&I
- —
- Monthly cashflow
- —
- DSCR
- —
- Eligible?
- —
Short-term bridge; refi at stabilization.
Rent comps 37 comps
| Address | Beds | Baths | Sqft | Rent | $/sqft | DOM | Units | Dist |
|---|---|---|---|---|---|---|---|---|
| 350 Fennel Way SW Atlanta, GA | 4.0 | 2.0 | 1450 | $1,500 | $1.03 | 20d | 1 | 0.13mi |
| 4172 Renfrew Ct SW Atlanta, GA | 4.0 | 2.0 | 1136 | $1,200 | $1.06 | 7d | 1 | 0.16mi |
| 3915 Basil Way SW Atlanta, GA | 3.0 | 2.0 | 1287 | $2,600 | $2.02 | 24d | 1 | 0.18mi |
| 40 Candlelight Ln SW Unit A Atlanta, GA | 2.0 | 2.0 | 1098 | $1,500 | $1.37 | 24d | 1 | 0.20mi |
| 40 Candlelight Ln SW Apt B Atlanta, GA | 3.0 | 3.0 | 1274 | $1,800 | $1.41 | 24d | 1 | 0.20mi |
| 586 Oakside Dr SW Unit A Atlanta, GA | 3.0 | 1.0 | 1075 | $1,325 | $1.23 | 15d | 1 | 0.47mi |
| 586 Oakside Dr SW Unit B Atlanta, GA | 2.0 | 1.0 | 1075 | $1,065 | $0.99 | 15d | 1 | 0.47mi |
| 440 Dartmouth Dr SW Atlanta, GA | 4.0 | 3.0 | 1148 | $1,795 | $1.56 | 20d | 1 | 0.48mi |
| 3919 Wisteria Ln SW Atlanta, GA | 4.0 | 2.0 | 1126 | $1,730 | $1.54 | 14d | 1 | 0.63mi |
| 415 Fairburn Rd SW Atlanta, GA | 1.0–3.0 | 1.0–2.0 | 890 | $1,490 | $1.67 | 2d | 31 | 0.80mi |
| 3669 Martin Luther King Jr Dr SW Atlanta, GA | 2.0 | 1.5 | 800 | $1,300 | $1.62 | 5d | 2 | 1.01mi |
| 841 Ambient Way SW Atlanta, GA | 2.0 | 2.5 | 1344 | $1,895 | $1.41 | 17d | 1 | 1.05mi |
| 832 Ambient Way SW Atlanta, GA | 2.0 | 2.5 | 1500 | $2,250 | $1.50 | 24d | 1 | 1.08mi |
| 722 Crestwell Cir #722 Atlanta, GA | 2.0 | 3.0 | 1440 | $2,279 | $1.58 | 20d | 1 | 1.09mi |
| 887 Ambient Way SW Atlanta, GA | 2.0 | 2.5 | 1344 | $2,250 | $1.67 | 24d | 1 | 1.10mi |
| 897 Ambient Way SW Atlanta, GA | 2.0 | 2.5 | 1500 | $2,155 | $1.44 | 24d | 1 | 1.12mi |
| 708 Crestwell Cir SW Atlanta, GA | 2.0 | 2.5 | 1236 | $1,645 | $1.33 | 24d | 1 | 1.12mi |
| 3440 Boulder Park Dr SW Atlanta, GA | 2.0 | 1.0 | 800 | $1,050 | $1.31 | 10d | 3 | 1.14mi |
| 470 Bolton Rd NW Unit D1 Atlanta, GA | 2.0 | 1.5 | 1100 | $1,395 | $1.27 | 24d | 1 | 1.14mi |
| 648 Providence Pl SW #37 Atlanta, GA | 3.0 | 3.5 | 1416 | $2,195 | $1.55 | 24d | 1 | 1.14mi |
| 451 Fairlock Ln NW Atlanta, GA | 3.0 | 1.0 | 1141 | $1,450 | $1.27 | 24d | 1 | 1.23mi |
| 3456 Thompson Dr NW Atlanta, GA | 3.0 | 1.0 | 975 | $1,750 | $1.79 | 24d | 1 | 1.24mi |
| 513 Constellation Overlook SW Atlanta, GA | 3.0 | 2.5 | 1446 | $2,300 | $1.59 | 24d | 1 | 1.25mi |
| 3616 Utoy Dr SW Atlanta, GA | 3.0 | 3.5 | 1496 | $1,950 | $1.30 | 43d | 1 | 1.26mi |
| 3354 Delmar Ln NW Atlanta, GA | 3.0 | 2.0 | 1170 | $1,700 | $1.45 | 24d | 1 | 1.31mi |
| 4341 Cascade Rd SW Atlanta, GA | 1.0–3.0 | 1.0–2.0 | 959 | $1,535 | $1.60 | 43d | 1 | 1.32mi |
| 4355 Cascade Rd SW Atlanta, GA | 2.0 | 2.0 | 1152 | $1,190 | $1.03 | 2d | 7 | 1.34mi |
| 3590 Collier Dr NW Atlanta, GA | 4.0 | 4.0 | 1110 | $1,100 | $0.99 | 11d | 1 | 1.34mi |
| 751 Fairburn Rd SW Atlanta, GA | 1.0–3.0 | 1.0–2.0 | 1162 | $2,170 | $1.87 | 3d | 32 | 1.35mi |
| 4375 Cascade Rd Apt N181 Atlanta, GA | 2.0 | 1.0 | 805 | $1,100 | $1.37 | 5d | 1 | 1.38mi |
| 4375 Cascade Rd Unit n186 Atlanta, GA | 2.0 | 1.0 | 805 | $1,100 | $1.37 | 15d | 1 | 1.38mi |
| 4375 Cascade Rd Unit n184 Atlanta, GA | 2.0 | 1.0 | 805 | $1,150 | $1.43 | 24d | 1 | 1.38mi |
| 4375 Cascade Rd Unit r239 Atlanta, GA | 3.0 | 2.0 | 1017 | $1,395 | $1.37 | 24d | 1 | 1.38mi |
| 4375 Cascade Rd Apt B12 Atlanta, GA | 3.0 | 2.0 | 1017 | $1,295 | $1.27 | 24d | 1 | 1.38mi |
| 4375 Cascade Rd Unit l155 Atlanta, GA | 2.0 | 1.0 | 805 | $1,025 | $1.27 | 17d | 1 | 1.38mi |
| 294 Brownlee Rd SW Atlanta, GA | 2.0 | 1.5 | 950 | $1,050 | $1.11 | 16d | 2 | 1.40mi |
| 3466 Fairlane Dr NW Atlanta, GA | 3.0 | 1.0 | 950 | $1,495 | $1.57 | 24d | 1 | 1.46mi |
Listing history 11 events
-
2026-06-18price $179,220 Active 13 DOM
-
2026-06-18days on market $188,650 Active 13 DOM
-
2026-06-17days on market $188,650 Active 12 DOM
-
2026-06-16days on market $188,650 Active 11 DOM
-
2026-06-15days on market $188,650 Active 10 DOM
-
2026-06-13days on market $188,650 Active 8 DOM
-
2026-06-13days on market $188,650 Active 7 DOM
-
2026-06-09days on market $188,650 Active 4 DOM
-
2026-06-08days on market $188,650 Active 3 DOM
-
2026-06-07remarks 693-char remark
-
2026-06-07$188,650 Active 2 DOM
ⓘ Source: listings_history table (triggers on properties + properties_extension) + one-shot
backfill from property_details.listing_events for pre-trigger history.
Tax reassessment forecast GA · Resets to sale price
- Current annual tax
- $1,705 · $142/mo
- Projected year-2 tax
- $1,705 · $142/mo
- Expected delta
- $0/yr ($0/mo · 0.0%)
ⓘ Screening estimate from a state-policy table — verify with the county assessor before closing.
Climate risk First Street
- Flood 1/10 Low FEMA zone X (unshaded) · 0% chance over 30 yrs
- Wildfire 2/10 Low
- Heat 5/10 Major 7 d/yr ≥103°F today · 17 d/yr by 30 yrs out
- Wind 6/10 Major 27% chance of damaging wind over 30 yrs
- Air quality 4/10 Moderate 3 unhealthy d/yr today · 5 by 30 yrs out
Nearby sold comps map
Loading sold comps map…
Walkable amenities ~0.75 mi
Loading nearby amenities…
Taxation est. · year 1
- Rental income
- $20,740
- − Mortgage interest
- −$10,039
- − Property taxes
- −$1,705
- − Insurance
- −$896
- − Repairs & maintenance
- −$1,659
- − Management
- −$1,659
- − Depreciation
- −$5,214
- Taxable loss
- −$432
- Est. tax savings @ 24.0%
- +$104
- After-tax cash flow
- $2,609/yr
For passive investors: Depreciation is non-cash, so a rental often shows a tax loss while cash-flowing — sheltering income. Rental losses are passive: they offset passive income freely, and up to $25,000/yr can offset ordinary (W-2) income if you actively participate and your MAGI is under $100k (phasing out to $0 by $150k); unused losses carry forward. On sale, claimed depreciation is recaptured at up to 25%, and gains may owe capital-gains tax (a 1031 exchange can defer both). Figures are a year-1 estimate at your 24.0% rate — not tax advice; consult a CPA.
Schools (NCES district)
- District
- Atlanta Public Schools
- NCES district ID
- 1300120
- Math proficiency
- 28% ▼ -6.00%
- Reading proficiency
- 35% ▼ -2.00%
- Median HH income
- $48,306
- Composite
- 27.27/100
- National rank
- #7006
- State rank
- #80 of 174 in GA
Livability — Atlanta
- Score
- 83/100
- State rank
- #6
- US rank
- #919
Category grades
Schools grade is shown separately in the Schools card above.
Census & demographics
- Census place
- Atlanta, GA
- County
- Fulton County · 1,094,430 people
- City population
- 629,525
- Metro
- Atlanta-Sandy Springs-Alpharetta, GA
- Population (ZIP)
- 62,567
- Household income
- $62,623
- Rent vs Own
- Severe rent burden
- 3748.0
Population outlook (Fulton County) Hauer SSP2
- Today (2025)
- 1,203,707 people
- By 2030
- 1,299,706 · +8.0%
- By 2040
- 1,488,256 · +23.6%
- By 2050
- 1,664,580 · +38.3%
- By 2075
- 2,036,072 · +69.2%
- By 2100
- 2,222,402 · +84.6%
Race, ethnicity, and origin ACS 2023
- Neighborhood character
- Predominantly Black (94%)
- Race & ethnicity
- Black 94% Two or more races 3% Hispanic / Latino 2%
- Common ancestry
- Hispanic 1%
- Foreign-born
- 4% · Canada
- Languages at home
- 95% English-only · Spanish 1% French/Haitian/Cajun 1%
Political lean MEDSL · Fulton
- 2024 margin
- Solid D (+44.9) · D 71.9% · R 27.0% · Other 1.1%
- 2008→2024 swing
- +9.8pp toward D · 2008: 35.0pp · 2024: 44.9pp
- All cycles
- 2024: D+44.9 2020: D+46.4 2016: D+42.1 2012: D+29.6 2008: D+35.0
Not yet ingested
- Civics
- —
Market trends
- HPI YoY
- ▼ -106.38%
- Current HPI
- 204.5402
- Rent YoY
- ▲ 2.63%
- Metro
- Atlanta-Sandy Springs-Alpharetta, GA
- State GDP YoY
- ▲ 2.66%
- F500 in state
- 28
Industry mix (Fortune 500 HQ in GA)
| Industry | F500 HQs | Revenue |
|---|---|---|
| Paper / Packaging | 2 | $29B |
|
||
| Retail | 1 | $160B |
|
||
| Transportation / Logistics | 1 | $91B |
|
||
| Airlines | 1 | $62B |
|
||
| Consumer Goods | 1 | $47B |
|
||
| Utilities | 1 | $25B |
|
||
Price history
+679.5% since first listed13 events — show timeline
- 2026-06-05 Listed $188,650 FMLS
- 2026-06-05 Listed $188,650 GAMLS
- 2026-05-04 Listing Removed — GAMLS
- 2026-04-10 Price Changed $170,000 GAMLS
- 2025-05-28 Listed $174,000 GAMLS
- 2019-04-15 Sold (Public Records) $85,900 Public Records
- 2019-03-31 Sold (MLS) $85,900 GAMLS
- 2019-03-12 Pending — GAMLS
- 2019-03-08 Relisted — GAMLS
- 2019-03-04 Pending — GAMLS
- 2019-02-14 Listed $85,800 GAMLS
- 2017-03-01 Sold (Public Records) $62,900 Public Records
- 1983-08-24 Sold (Public Records) $24,200 Public Records
Property tax history
+3.0%/yrLatest (2025): $1,705 · -9.0% YoY. Source: county tax records.
Cash-flow waterfall
monthlySold comps — $/sqft
last 12 mo · ≤1 miLoading sold comps…