7621 N 166 St · Omaha, NE
Flood risk 1/10 · Minimal
- FEMA flood zone
- X (unshaded)
- Chance of flooding over 30 yrs
- 0.0%
- Est. flood insurance / yr
- $507 – $1,088
Fire risk 2/10 · Minimal
- Est. fire insurance / yr
- $1,161 – $2,155
Heat risk 3/10 · Minor
- Hot days now (above 104°F)
- 7 days/yr
- Hot days in 30 yrs
- 16 days/yr
Wind risk 2/10 · Minimal
- Chance of severe wind over 30 yrs
- —
Air-quality risk 1/10 · Minimal
- Unhealthy air days now
- 0 days/yr
- Unhealthy air days in 30 yrs
- 0 days/yr
Risk factors via First Street. Map © Google.
Why this score? — see what drove the D grade
The composite is a weighted blend of 9 inputs, each scored 0–100. Each bar is that input's sub-score; the figure is the points it added to the 100-point composite (weight × sub-score).
- ARV discount +11.0/15.0
- Cash flow +8.5/30.0
- Schools +6.1/10.0
- Livability +4.2/5.0
- Rent growth +4.0/5.0
- Condition / age +2.5/5.0
- DSCR +2.3/10.0
- 1% rule +1.4/10.0
- Appreciation +0.0/10.0
$425,850
🖨 Deal sheet (PDF) 📄 Offer letter ✓ Due diligence
Listing remarks MLS
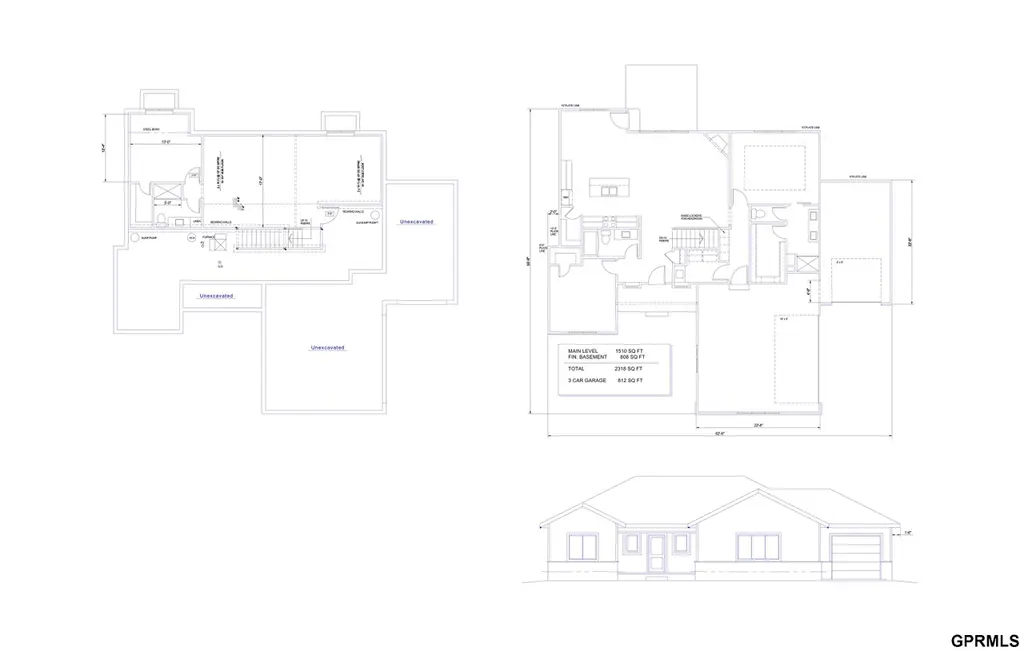
Step inside this 3-bedroom, 3-bath home, which features custom cabinets, granite or quartz countertops in the kitchen, granite countertops in the bathrooms, tile flooring in the primary bath, LVT in the kitchen, dinette, and remaining bathrooms. The open-concept layout seamlessly integrates the living, dining, and kitchen areas, offering a versatile space for entertaining or relaxing. Let's not forget the electric fireplace, perfect for cozy evenings. Call today to discuss the selection process!
Key facts
- Custom cabinets
- Tile flooring
- Electric fireplace
Tags
Neighborhood map
What this means for you Summary
Snapshot
- This is a 3-bed/2.5-bath other listed at $426k.
Deal economics
- At list price, monthly cash flow is $-372 ($-4k/yr) — negative.
- To cash-flow at today's rent, offer at most $360k (15.4% below list).
- To meet the 1% rule (rent ≥ 1% of price), the offer needs to be $273k (35.9% below list).
- Recommended offer: $273k (35.9% below list) — sets the bar for 1% rule.
- Cap rate 5.2% vs local median 3.6% in Omaha — top-decile yield for the area; either an underpriced asset or a hidden risk that comps aren't pricing in. Stress-test before assuming the spread holds.
Location & tenants
- Location reads 84/100 on livability (#7 in NE, #663 nationally) — a professional / high-income tenant draw. Strengths: amenities A+, commute A+, cost of living A+; Watch: crime F.
- Bennington Public Schools (rural): math 67% / reading 67% proficiency, ranked #3 of 111 in NE (top 3%) — acceptable for families but not a draw, mixed tenant base, ~2y average lease; only 6% free/reduced lunch — higher-income household profile.
- Zoned schools: Pine Creek Elementary (math 77% / reading 74%, grade A, #18 of 502 statewide, top 3%, 578 students, 8% FRL); Bennington High School (math 66% / reading 70%, grade B, #21 of 261 statewide, top 8%, 1,002 students, 14% FRL) — zoned schools at 11% FRL track the district average.
- Market conditions: Rents rising fast (+5.9%/yr); 464 active listings in the ZIP; 4 comparable units currently listed for rent nearby; rentals leasing fast (median 4d on market — plan ~1-2 weeks tenant-placement turnaround); high-income renter base; 4,539 units permitted in Douglas County in 2024 (2,583 in 5+ unit buildings).
Forward outlook
- Local home prices are declining (-3.0%/yr); year-one equity from $3k of loan paydown is wiped out by about $13k of value loss. Plan a longer hold.
- Douglas County population projected at +28% by 2050 — long-run rental-demand tailwind backs the buy-and-hold thesis.
Negotiation context
- It's been on market 487 days — a 12% lower offer ($375k) is reasonable based on typical stale-listing flexibility.
- 5 sale attempts since 5y ago with the ask held roughly flat each time — persistent listings suggest the price (not the market) is what's stuck; bring a comps-based counter.
- Current owner paid $54k; list at $426k implies a 689% gain — meaningful room to come down on a strong offer.
Questions for the listing agent
- What do current leases actually rent for vs. the listed asking? Can we see a recent rent roll and the last 12 months of T-12 income?
- It's been on market 487 days. Have you received any prior offers? Is the seller open to a 36% concession, seller financing, or rate buy-down credit?
- What does the HOA fee cover, when was the last increase, and are there any pending special assessments or reserve-fund shortfalls?
- Why hasn't it sold? Are there any deal-killer items the seller is aware of (foundation, flood, title, zoning, code violations)?
- Is there a deadline driving the sale (1031 exchange, divorce, estate, relocation)? That informs how much negotiation room exists.
- Crime grade is F in this area — have there been break-ins, vandalism, or insurance claims at this property in the last 3 years? What carrier currently insures it and at what premium?
- The area grade is low — what's the realistic commute time and amenity access for the typical tenant pool here? Any planned neighborhood developments (good or bad) we should know about?
- What's the average days-on-market for RENTAL listings here right now (not sales)? A rising rental-DOM trend means longer vacancies and softer asking-rent achievability than the comps imply.
- What's the recent tenant-quality profile in this submarket — average credit score on applications, eviction rate, late-payment / NSF rate, and stable-employment percentage? A property-management company in the area should have these aggregated.
- How much new for-sale + rental construction is in the pipeline within 1–3 miles? Heavy new supply typically softens prices + rents 12–24 months out; constrained supply supports both.
Investment metrics
- 1% rule
- 0.64% ✗
- Cap rate
- 5.25%
- Cash-on-cash
- -3.74%
- DSCR
- 0.83
- GRM
- 13.0
CMA / ARV
- ARV (median comp)
- $462,275
- List price
- $425,850
- Delta
- -7.88%
- Verdict
- FAIR
- Comps
- 20 within 1.0 mi
Projected returns pro-forma
-3.0% appreciation · 5.88% rent growth · sell at horizon
- IRR
- -20.0%
- Equity multiple
- 0.29×
- Total profit
- $-84,762
- Equity at exit
- $63,496
- IRR
- -8.5%
- Equity multiple
- 0.42×
- Total profit
- $-69,748
- Equity at exit
- $36,820
Cash invested: $119,238 (down + closing). Projections, not guarantees.
Landlord ↔ Tenant lean methodology
- Overall (STATE)
- 83 Strongly Landlord-Friendly
- State Nebraska
- 83 Strongly Landlord-Friendly · R+13
- County
- — inherits STATE
- City
- — inherits STATE
ZIP-level market 68007
- Home prices YoY
- -19.4%
- Rents YoY
- 5.9%
- Active inventory
- 464
- Price-to-rent
- 13.0×
Monthly cashflow live
- Estimated rent
- $2,729 medium interval (Pro) →
- Mortgage (P&I)
- −$2,233
- Tax from tax record
- −$96 /mo · $1,153/yr
- Insurance
- −$177
- HOA
- −$21
- Vacancy / Maint / Mgmt
- −$573
- Net cashflow
- $-372
Break-even live
Sensitivity live
| Price | -10% $-131 | -5% $-251 | +0% $-372 | +5% $-492 | +10% $-613 |
|---|---|---|---|---|---|
| Rent | -10% $-587 | -5% $-480 | +0% $-372 | +5% $-264 | +10% $-156 |
| Rate | -1.0pp $-157 | -0.5pp $-263 | base $-372 | +0.5pp $-482 | +1.0pp $-594 |
UW: 25.0% down · 7.5% · 30yr · 1.5% tax · 5.0% vac · 8.0% maint · 8.0% mgmt
Financing live
Cash to close
- Down payment
- $106,462
- Closing costs
- $12,776
- Reserves months
- —
- Total cash needed
- —
Loan-product check · same deal, 3 products live
Conventional
25% down · 7.5% · 30yr
- Down + closing
- —
- Monthly P&I
- —
- Monthly cashflow
- —
- DSCR
- —
- Eligible?
- —
Personal DTI + credit; lowest rate.
DSCR
20% down · 8.5% · 30yr
- Down + closing
- —
- Monthly P&I
- —
- Monthly cashflow
- —
- DSCR
- —
- Eligible?
- —
No personal income docs; deal must DSCR.
Hard money
10% down · 12.0% · 12mo
- Down + closing
- —
- Monthly P&I
- —
- Monthly cashflow
- —
- DSCR
- —
- Eligible?
- —
Short-term bridge; refi at stabilization.
Rent comps 4 comps
| Address | Beds | Baths | Sqft | Rent | $/sqft | DOM | Units | Dist |
|---|---|---|---|---|---|---|---|---|
| 16333 Potter St Bennington, NE | 3.0 | 2.0 | 1618 | $3,200 | $1.98 | 3d | 1 | 0.19mi |
| 7308 N 167th Ave Bennington, NE | 4.0 | 3.0 | 2213 | $3,000 | $1.36 | 3d | 1 | 0.34mi |
| 17451 Tucker St Bennington, NE | 3.0 | 3.5 | 2442 | $3,100 | $1.27 | 25d | 1 | 0.95mi |
| 6220 N 160th Ave Omaha, NE | 1.0–3.0 | 1.0–2.5 | 1137 | $2,690 | $2.36 | 3d | 13 | 1.10mi |
HOA detail
- Monthly dues
- $21 · $252/yr
- Likely covers
- electric
Listing history 28 events
-
2026-06-22days on market $425,850 Active 487 DOM
-
2026-06-18days on market $425,850 Active 484 DOM
-
2026-06-17days on market $425,850 Active 483 DOM
-
2026-06-16days on market $425,850 Active 482 DOM
-
2026-06-15days on market $425,850 Active 481 DOM
-
2026-06-13days on market $425,850 Active 479 DOM
-
2026-06-13days on market $425,850 Active 478 DOM
-
2026-06-10days on market $425,850 Active 476 DOM
-
2026-06-09days on market $425,850 Active 475 DOM
-
2026-06-08days on market $425,850 Active 474 DOM
-
2026-06-07days on market $425,850 Active 473 DOM
-
2026-06-05days on market $425,850 Active 470 DOM
-
2026-06-03days on market $425,850 Active 469 DOM
-
2026-06-03days on market $425,850 Active 468 DOM
-
2026-06-01days on market $425,850 Active 467 DOM
-
2026-05-31days on market $425,850 Active 466 DOM
-
2025-02-17$425,850 New 500-char remark
Show marketing remark (500 chars)
Step inside this 3-bedroom, 3-bath home, which features custom cabinets, granite or quartz countertops in the kitchen, granite countertops in the bathrooms, tile flooring in the primary bath, LVT in the kitchen, dinette, and remaining bathrooms. The open-concept layout seamlessly integrates the living, dining, and kitchen areas, offering a versatile space for entertaining or relaxing. Let's not forget the electric fireplace, perfect for cozy evenings. Call today to discuss the selection process!
-
2025-02-17historical
Show marketing remark (500 chars)
Step inside this 3-bedroom, 3-bath home, which features custom cabinets, granite or quartz countertops in the kitchen, granite countertops in the bathrooms, tile flooring in the primary bath, LVT in the kitchen, dinette, and remaining bathrooms. The open-concept layout seamlessly integrates the living, dining, and kitchen areas, offering a versatile space for entertaining or relaxing. Let's not forget the electric fireplace, perfect for cozy evenings. Call today to discuss the selection process!
-
2024-03-29$399,950 New
-
2024-03-28historical
-
2024-01-17$399,950 New
-
2024-01-17historical
-
2023-10-02historical
-
2023-09-27$56,950 New
-
2023-08-30price $56,950
-
2022-08-30price $56,736
-
2021-03-08$55,950 Active - New
-
2020-02-13soldstatus $54,000
ⓘ Source: listings_history table (triggers on properties + properties_extension) + one-shot
backfill from property_details.listing_events for pre-trigger history.
Tax reassessment forecast NE · Resets to sale price
- Current annual tax
- $1,153 · $96/mo
- Projected year-2 tax
- $7,367 · $614/mo
- Expected delta
- +$6,214/yr (+$518/mo · 538.7%)
ⓘ Screening estimate from a state-policy table — verify with the county assessor before closing.
Climate risk First Street
- Flood 1/10 Low FEMA zone X (unshaded) · 0% chance over 30 yrs
- Wildfire 2/10 Low
- Heat 3/10 Moderate 7 d/yr ≥104°F today · 16 d/yr by 30 yrs out
- Wind 2/10 Low
- Air quality 1/10 Low 0 unhealthy d/yr today · 0 by 30 yrs out
Nearby sold comps map
Loading sold comps map…
Walkable amenities ~0.75 mi
Loading nearby amenities…
Taxation est. · year 1
- Rental income
- $32,749
- − Mortgage interest
- −$23,854
- − Property taxes
- −$1,153
- − Insurance
- −$2,129
- − Repairs & maintenance
- −$2,620
- − Management
- −$2,620
- − HOA
- −$252
- − Depreciation
- −$12,388
- Taxable loss
- −$12,268
- Est. tax savings @ 24.0%
- +$2,944
- After-tax cash flow
- $-1,517/yr
For passive investors: Depreciation is non-cash, so a rental often shows a tax loss while cash-flowing — sheltering income. Rental losses are passive: they offset passive income freely, and up to $25,000/yr can offset ordinary (W-2) income if you actively participate and your MAGI is under $100k (phasing out to $0 by $150k); unused losses carry forward. On sale, claimed depreciation is recaptured at up to 25%, and gains may owe capital-gains tax (a 1031 exchange can defer both). Figures are a year-1 estimate at your 24.0% rate — not tax advice; consult a CPA.
Schools (NCES district)
- District
- Bennington Public Schools
- NCES district ID
- 3103990
- Math proficiency
- 67% ▼ -6.00%
- Reading proficiency
- 67% ▼ -7.00%
- Median HH income
- $87,771
- Composite
- 60.5/100
- National rank
- #843
- State rank
- #3 of 111 in NE
Livability — Omaha
- Score
- 84/100
- State rank
- #7
- US rank
- #663
Category grades
Schools grade is shown separately in the Schools card above.
Census & demographics
- County
- Douglas County · 538,646 people
- City population
- 552,986
- Metro
- Omaha-Council Bluffs, NE-IA
- Population (ZIP)
- 19,536
- Household income
- $141,042
- Rent vs Own
- Severe rent burden
- 107.0
Population outlook (Douglas County) Hauer SSP2
- Today (2025)
- 625,245 people
- By 2030
- 661,613 · +5.8%
- By 2040
- 732,395 · +17.1%
- By 2050
- 801,988 · +28.3%
- By 2075
- 968,637 · +54.9%
- By 2100
- 1,101,871 · +76.2%
Race, ethnicity, and origin ACS 2023
- Neighborhood character
- Predominantly White (84%)
- Race & ethnicity
- White 84% Hispanic / Latino 6% Two or more races 5% Black 4% Asian 2%
- Hispanic origin (detail)
- Mexican 3%
- Common ancestry
- Iranian 4% Romanian 4% Italian 3%
- Foreign-born
- 3% · Canada
- Languages at home
- 94% English-only · Spanish 3% Other Indo-European 1% Russian/Polish/Slavic 1%
Political lean MEDSL · Douglas
- 2024 margin
- D (+10.2) · D 54.4% · R 44.2% · Other 1.4%
- 2008→2024 swing
- +5.5pp toward D · 2008: 4.6pp · 2024: 10.2pp
- All cycles
- 2024: D+10.2 2020: D+11.3 2016: D+1.4 2012: R+4.3 2008: D+4.6
Not yet ingested
- Civics
- —
Market trends
- HPI YoY
- ▼ -60.06%
- Current HPI
- 250.3443
- Rent YoY
- ▲ 5.88%
- Metro
- Omaha-Council Bluffs, NE-IA
- State GDP YoY
- ▲ 0.68%
- F500 in state
- 2
Industry mix (Fortune 500 HQ in NE)
| Industry | F500 HQs | Revenue |
|---|---|---|
| Conglomerate | 1 | $371B |
|
||
Price history
+688.6% since first listed12 events — show timeline
- 2025-02-17 Listing Removed — GPRMLS
- 2025-02-17 Listed $425,850 GPRMLS
- 2024-03-29 Listed $399,950 GPRMLS
- 2024-03-28 Listing Removed — GPRMLS
- 2024-01-17 Listing Removed — GPRMLS
- 2024-01-17 Listed $399,950 GPRMLS
- 2023-10-02 Listing Removed — GPRMLS
- 2023-09-27 Listed $56,950 GPRMLS
- 2023-08-30 Price Changed $56,950 GPRMLS
- 2022-08-30 Price Changed $56,736 GPRMLS
- 2021-03-08 Listed $55,950 GPRMLS
- 2020-02-13 Sold (Public Records) $54,000 Public Records
Property tax history
+40.0%/yrLatest (2025): $1,153 · -2.8% YoY. Source: county tax records.
Cash-flow waterfall
monthlySold comps — $/sqft
last 12 mo · ≤1 miLoading sold comps…