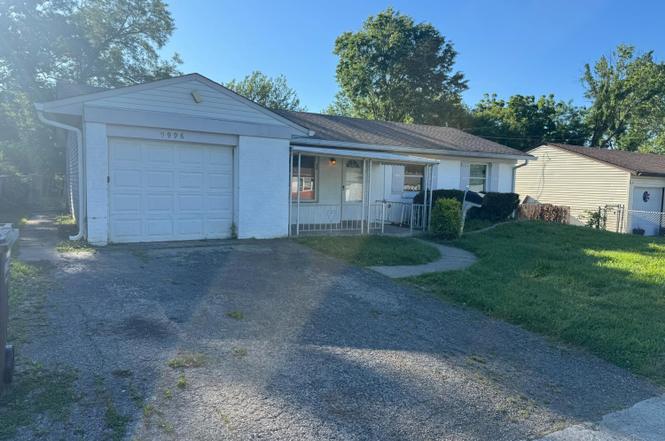
9998 Crusader Dr · Northbrook, OH
Flood risk 1/10 · Minimal
- FEMA flood zone
- X (unshaded)
- Chance of flooding over 30 yrs
- 0.0%
- Est. flood insurance / yr
- $507 – $1,088
Fire risk 1/10 · Minimal
- Est. fire insurance / yr
- $713 – $1,323
Heat risk 4/10 · Minor
- Hot days now (above 103°F)
- 7 days/yr
- Hot days in 30 yrs
- 19 days/yr
Wind risk 2/10 · Minimal
- Chance of severe wind over 30 yrs
- 1.0%
Air-quality risk 4/10 · Minor
- Unhealthy air days now
- 4 days/yr
- Unhealthy air days in 30 yrs
- 6 days/yr
Risk factors via First Street. Map © Google.
Why this score? — see what drove the C- grade
The composite is a weighted blend of 9 inputs, each scored 0–100. Each bar is that input's sub-score; the figure is the points it added to the 100-point composite (weight × sub-score).
- Cash flow +21.9/30.0
- DSCR +7.0/10.0
- ARV discount +6.4/15.0
- 1% rule +5.5/10.0
- Schools +3.7/10.0
- Livability +3.4/5.0
- Rent growth +2.5/5.0
- Condition / age +2.5/5.0
- Appreciation +0.0/10.0
$164,900
🖨 Deal sheet 📄 Offer letter ✓ Due diligence
Listing remarks MLS
Per Hamilton County Auditor, 1032 sq ft Ranch with a fenced rear yard, covered front porch, large level rear yard, convenient location. Buyer is responsible for $150.00 rekey fee @ time of closing.
Key facts
- 7,362 sq ft lot
- Garage
- Built 1961
Property features AI
Finance
- Other: Zoned residential
- HOA & community: No homeowners association
Exterior
- Parking: Attached garage (1 car); Driveway parking
- Utilities: Public water; Public sewer; Natural gas; Water heating: Other
- Home design: Traditional single-family home; One level
- Construction: Aluminum siding and brick exterior; Shingle roof; Slab foundation
- Exterior features: Front porch; Storm windows
Interior
- Kitchen: Eat-in kitchen with wood cabinets
- Bedrooms: Three bedrooms on level 1 (Primary bedroom approx. 12 x 10; Bedroom 2 approx. 11 x 10; Bedroom 3 approx. 9 x 10)
- Bathrooms: One full bathroom on level 1; One half bathroom
- Heating & cooling: Forced air heating (gas)
- Interior features: Six total rooms; Wall-to-wall carpet in living room
Neighborhood map
What this means for you Summary
Snapshot
- This is a 3-bed/1.5-bath single-family listed at $165k.
Deal economics
- At list price, monthly cash flow is $258 ($3k/yr) — positive.
- The deal already cash-flows at list — no discount required.
- Meets the 1% rule at list price ($2k rent vs $165k).
Location & tenants
- Location reads 68/100 on livability (#555 in OH) — a middle-class / working-renter tenant base. Strengths: cost of living A+, housing A+; Watch: crime C-, health & safety C-, employment D+.
- Northwest Local (suburban): math 38% / reading 46% proficiency, ranked #508 of 656 in OH (top 77%) — families likely to look elsewhere, expect single-tenant / working-renter base with shorter leases.
- Market conditions: 53 active listings in the ZIP; 8 comparable units currently listed for rent nearby; rentals at typical pace (median 21d on market — plan ~3-4 weeks tenant-placement turnaround); 801 units permitted in Hamilton County in 2024 (190 in 5+ unit buildings).
Forward outlook
- Local home prices are declining (-3.0%/yr); year-one equity from $1k of loan paydown is wiped out by about $5k of value loss. Plan a longer hold.
Negotiation context
- Only 1 days on market — expect competitive offers; lowballing is unlikely to land.
- 6 sale attempts since 29y ago with the ask held roughly flat each time — persistent listings suggest the price (not the market) is what's stuck; bring a comps-based counter.
Questions for the listing agent
- Built in 1961 — when were the roof, HVAC, electrical panel, plumbing, and water heater last replaced?
- Is there a deadline driving the sale (1031 exchange, divorce, estate, relocation)? That informs how much negotiation room exists.
- Schools are D-rated, which usually means shorter tenancies and higher turnover. Who's the typical renter profile here, and what's been the actual vacancy rate?
- What's the average days-on-market for RENTAL listings here right now (not sales)? A rising rental-DOM trend means longer vacancies and softer asking-rent achievability than the comps imply.
- What's the recent tenant-quality profile in this submarket — average credit score on applications, eviction rate, late-payment / NSF rate, and stable-employment percentage? A property-management company in the area should have these aggregated.
- How much new for-sale + rental construction is in the pipeline within 1–3 miles? Heavy new supply typically softens prices + rents 12–24 months out; constrained supply supports both.
Investment metrics
- 1% rule
- 1.05% ✓
- Cap rate
- 8.17%
- Cash-on-cash
- 6.71%
- DSCR
- 1.30
- GRM
- 7.9
CMA / ARV
- ARV (on-the-fly)
- $160,992
- Comps found
- 12
Show comp detail 12 sales within ~0.75 mi
| Address | Dist | Beds/Ba | Sqft | Sold | Price | $/sf | Match |
|---|---|---|---|---|---|---|---|
| 2473 Schon Dr | 0.48mi | 3/1.0 | 1,073 (+4%) | 0mo | $115,000 | $107 | 69 |
| 10366 Pippin Ln | 0.70mi | 3/1.5 | 1,028 (-0%) | 0mo | $247,000 | $240 | 66 |
| 9852 Wiscasset Way | 0.31mi | 3/1.0 | 925 (-10%) | 0mo | $108,000 | $117 | 66 |
| 2752 Mancelona Ct | 0.29mi | 3/1.0 | 1,175 (+14%) | 2mo | $200,000 | $170 | 60 |
| 9810 Norcrest Dr | 0.55mi | 3/1.0 | 1,073 (+4%) | 8mo | $166,000 | $155 | 59 |
| 2626 Ontario St | 0.56mi | 3/1.0 | 960 (-7%) | 2mo | $155,000 | $161 | 59 |
| 2697 Wenning Rd | 0.47mi | 3/1.0 | 960 (-7%) | 8mo | $164,000 | $171 | 58 |
| 9737 Dunraven Dr | 0.37mi | 3/1.0 | 925 (-10%) | 7mo | $182,000 | $197 | 58 |
| 9697 Dunraven Dr | 0.32mi | 3/1.0 | 1,175 (+14%) | 11mo | $137,500 | $117 | 51 |
| 2610 Niagara St | 0.70mi | 3/1.0 | 960 (-7%) | 4mo | $149,900 | $156 | 50 |
| 2542 Ontario St | 0.68mi | 3/1.0 | 960 (-7%) | 8mo | $121,000 | $126 | 48 |
| 2680 Topeka St | 0.73mi | 3/1.0 | 960 (-7%) | 9mo | $135,000 | $141 | 45 |
Match score weights: distance 35% · size 25% · config 20% · recency 20%. Top-matched comps best support the ARV.
Projected returns pro-forma
-3.0% appreciation · 3.0% rent growth · sell at horizon
- IRR
- -6.0%
- Equity multiple
- 0.78×
- Total profit
- $-10,268
- Equity at exit
- $24,587
- IRR
- 3.7%
- Equity multiple
- 1.27×
- Total profit
- $12,266
- Equity at exit
- $14,258
Cash invested: $46,172 (down + closing). Projections, not guarantees.
Landlord ↔ Tenant lean methodology
- Overall (STATE)
- 73 Landlord-Friendly
- State Ohio
- 73 Landlord-Friendly · R+6
- County
- — inherits STATE
- City
- — inherits STATE
ZIP-level market 45251
- Active inventory
- 53
- Price-to-rent
- 7.9×
Monthly cashflow live
- Estimated rent
- $1,731 high interval (Pro) →
- Mortgage (P&I)
- −$865
- Tax from tax record
- −$176 /mo · $2,108/yr
- Insurance
- −$69
- HOA
- −$0
- Vacancy / Maint / Mgmt
- −$363
- Net cashflow
- $258
Break-even live
UW: 25.0% down · 7.5% · 30yr · 1.5% tax · 5.0% vac · 8.0% maint · 8.0% mgmt
Financing live
Cash to close
- Down payment
- $41,225
- Closing costs
- $4,947
- Reserves months
- —
- Total cash needed
- —
Loan-product check · same deal, 3 products live
Conventional
25% down · 7.5% · 30yr
- Down + closing
- —
- Monthly P&I
- —
- Monthly cashflow
- —
- DSCR
- —
- Eligible?
- —
Personal DTI + credit; lowest rate.
DSCR
20% down · 8.5% · 30yr
- Down + closing
- —
- Monthly P&I
- —
- Monthly cashflow
- —
- DSCR
- —
- Eligible?
- —
No personal income docs; deal must DSCR.
Hard money
10% down · 12.0% · 12mo
- Down + closing
- —
- Monthly P&I
- —
- Monthly cashflow
- —
- DSCR
- —
- Eligible?
- —
Short-term bridge; refi at stabilization.
Rent comps 8 comps
| Address | Beds | Baths | Sqft | Rent | $/sqft | DOM | Units | Dist |
|---|---|---|---|---|---|---|---|---|
| 10101 Arborwood Dr Cincinnati, OH | 1.0–3.0 | 1.0–1.5 | 912 | $1,649 | $1.81 | 1d | 26 | 0.35mi |
| 10220 September Dr Cincinnati, OH | 4.0 | 1.0 | 1025 | $1,890 | $1.84 | 12d | 1 | 0.44mi |
| 2753 Town Terrace Dr Cincinnati, OH | 2.0–3.0 | 1.0–1.5 | 968 | $1,450 | $1.50 | 21d | 4 | 0.61mi |
| 9500 Ridgemoor Ave Cincinnati, OH | 3.0 | 1.0 | 1344 | $1,600 | $1.19 | 7d | 1 | 0.86mi |
| 9333 Round Top Cincinnati, OH | 1.0–3.0 | 1.0–2.0 | 979 | $1,623 | $1.66 | 2d | 3 | 1.11mi |
| 9128 Orangewood Dr Cincinnati, OH | 4.0 | 1.0 | 1359 | $1,495 | $1.10 | 23d | 1 | 1.36mi |
| 3683 Ripplegrove Dr Cincinnati, OH | 3.0 | 1.5 | 1395 | $1,931 | $1.38 | 20d | 1 | 1.38mi |
| 9939 Voyager Way Cincinnati, OH | 3.0 | 2.0 | 1400 | $2,300 | $1.64 | 43d | 1 | 1.39mi |
Listing history 2 events
-
2026-06-18remarks 642-char remark
-
2026-06-18$164,900 Active 1 DOM
ⓘ Source: listings_history table (triggers on properties + properties_extension) + one-shot
backfill from property_details.listing_events for pre-trigger history.
Tax reassessment forecast OH · Partial reset (capped growth)
- Current annual tax
- $2,108 · $176/mo
- Projected year-2 tax
- $2,340 · $195/mo
- Expected delta
- +$232/yr (+$19/mo · 11.0%)
ⓘ Screening estimate from a state-policy table — verify with the county assessor before closing.
Climate risk First Street
- Flood 1/10 Low FEMA zone X (unshaded) · 0% chance over 30 yrs
- Wildfire 1/10 Low
- Heat 4/10 Moderate 7 d/yr ≥103°F today · 19 d/yr by 30 yrs out
- Wind 2/10 Low 100% chance of damaging wind over 30 yrs
- Air quality 4/10 Moderate 4 unhealthy d/yr today · 6 by 30 yrs out
Nearby sold comps map
Loading sold comps map…
Walkable amenities ~0.75 mi
Loading nearby amenities…
Taxation est. · year 1
- Rental income
- $20,770
- − Mortgage interest
- −$9,237
- − Property taxes
- −$2,108
- − Insurance
- −$824
- − Repairs & maintenance
- −$1,662
- − Management
- −$1,662
- − Depreciation
- −$4,797
- Taxable income
- $480
- Est. tax owed @ 24.0%
- −$115
- After-tax cash flow
- $2,983/yr
For passive investors: Depreciation is non-cash, so a rental often shows a tax loss while cash-flowing — sheltering income. Rental losses are passive: they offset passive income freely, and up to $25,000/yr can offset ordinary (W-2) income if you actively participate and your MAGI is under $100k (phasing out to $0 by $150k); unused losses carry forward. On sale, claimed depreciation is recaptured at up to 25%, and gains may owe capital-gains tax (a 1031 exchange can defer both). Figures are a year-1 estimate at your 24.0% rate — not tax advice; consult a CPA.
Schools (NCES district)
- District
- Northwest Local
- NCES district ID
- 3904736
- Math proficiency
- 38% ▼ -18.00%
- Reading proficiency
- 46% ▼ -10.00%
- Median HH income
- $58,765
- Composite
- 36.97/100
- National rank
- #4528
- State rank
- #508 of 656 in OH
Livability — Northbrook
- Score
- 68/100
- State rank
- #555
- US rank
- #9479
Category grades
Schools grade is shown separately in the Schools card above.
Census & demographics
- Census place
- Northbrook, OH
- County
- Hamilton County · 701,295 people
- Metro
- Cincinnati, OH-KY-IN
- Population (ZIP)
- 20,254
- Household income
- $74,614
- Rent vs Own
- Severe rent burden
- 442.0
Population outlook (Hamilton County) Hauer SSP2
- Today (2025)
- 826,054 people
- By 2030
- 830,947 · +0.6%
- By 2040
- 832,319 · +0.8%
- By 2050
- 822,428 · -0.4%
- By 2075
- 788,688 · -4.5%
- By 2100
- 710,674 · -14.0%
Race, ethnicity, and origin ACS 2023
- Neighborhood character
- Diverse neighborhood (Simpson 0.57)
- Race & ethnicity
- White 56% Black 34% Two or more races 6% Hispanic / Latino 3% Asian 2%
- Common ancestry
- Iranian 1% Italian 1% Lithuanian 1%
- Foreign-born
- 4% · Canada, China
- Languages at home
- 94% English-only · Spanish 2% Other Asian/Pacific 1% Chinese 1%
Political lean MEDSL · Hamilton
- 2024 margin
- D (+14.9) · D 57.0% · R 42.1%
- 2008→2024 swing
- +7.9pp toward D · 2008: 7.0pp · 2024: 14.9pp
- All cycles
- 2024: D+14.9 2020: D+15.9 2016: D+9.5 2012: D+4.9 2008: D+7.0
Not yet ingested
- Civics
- —
Market trends
- HPI YoY
- ▼ -222.27%
- Current HPI
- 232.8505
- Rent YoY
- —
- Metro
- Cincinnati, OH-KY-IN
- State GDP YoY
- ▲ 1.98%
- F500 in state
- 48
Industry mix (Fortune 500 HQ in OH)
| Industry | F500 HQs | Revenue |
|---|---|---|
| Insurance | 3 | $145B |
|
||
| Industrial Machinery | 3 | $49B |
|
||
| Financial Services | 3 | $24B |
|
||
| Consumer Goods | 2 | $93B |
|
||
| Aerospace / Defense | 2 | $47B |
|
||
| Utilities | 2 | $33B |
|
||
Price history
+217.7% since first listed16 events — show timeline
- 2026-06-18 Listed $164,900 Cincy MLS
- 2024-09-10 Sold (Public Records) $1,625,000 Public Records
- 2022-08-25 Sold (Public Records) $483,150 Public Records
- 2013-12-13 Sold (MLS) $32,500 Cincy MLS
- 2013-09-11 Listed $31,900 Cincy MLS
- 2013-08-01 Sold (Public Records) $54,059 Public Records
- 2005-11-18 Sold (MLS) $52,500 Cincy MLS
- 2005-10-05 Listed $74,900 Cincy MLS
- 2005-10-01 Listing Removed — Cincy MLS
- 2005-08-10 Listed $74,900 Cincy MLS
- 2005-08-05 Listing Removed — Cincy MLS
- 2005-05-10 Listed $80,000 Cincy MLS
- 1997-10-01 Sold (Public Records) $68,900 Public Records
- 1997-09-25 Sold (MLS) $68,900 Cincy MLS
- 1997-07-01 Listed $69,900 Cincy MLS
- 1990-06-06 Sold (Public Records) $51,900 Public Records
Property tax history
+5.8%/yrLatest (2025): $2,108 · +4.2% YoY. Source: county tax records.
Cash-flow waterfall
monthlySold comps — $/sqft
last 12 mo · ≤1 miLoading sold comps…