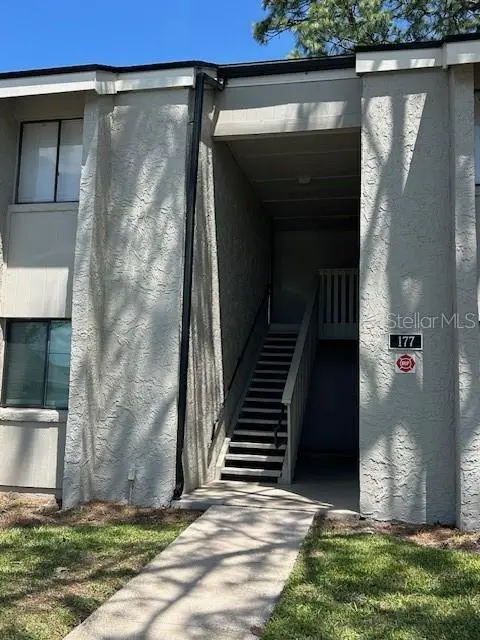
177 Springwood Cir Unit C · Wekiwa Springs, FL
Flood risk 1/10 · Minimal
- FEMA flood zone
- X (unshaded)
- Chance of flooding over 30 yrs
- 0.0%
- Est. flood insurance / yr
- $507 – $1,088
Fire risk 3/10 · Minor
- Est. fire insurance / yr
- $947 – $1,759
Heat risk 9/10 · Severe
- Hot days now (above 108°F)
- 7 days/yr
- Hot days in 30 yrs
- 24 days/yr
Wind risk 9/10 · Severe
- Chance of severe wind over 30 yrs
- 99.0%
Air-quality risk 2/10 · Minimal
- Unhealthy air days now
- 1 days/yr
- Unhealthy air days in 30 yrs
- 1 days/yr
Risk factors via First Street. Map © Google.
Why this score? — see what drove the D grade
The composite is a weighted blend of 9 inputs, each scored 0–100. Each bar is that input's sub-score; the figure is the points it added to the 100-point composite (weight × sub-score).
- Cash flow +10.9/30.0
- ARV discount +7.5/15.0
- 1% rule +6.1/10.0
- Schools +5.1/10.0
- Livability +3.8/5.0
- Rent growth +3.5/5.0
- DSCR +3.2/10.0
- Condition / age +2.5/5.0
- Appreciation +0.0/10.0
$150,000
🖨 Deal sheet (PDF) 📄 Offer letter ✓ Due diligence
Listing remarks MLS
NOT an REO or Shortsale - quick responses to offers! Check out this 2/2 block condo in lovely, wooded neighborhood near Wekiva Springs!!! Features separate dining area, all kitchen appliances and screened balcony! Completely remodeled with new laminatewood floor and tiles in the bathrooms.
Key facts
- Quartz counters
- Open concept
- Large storage closet
Tags
Property features AI
Finance
- Other: Lease restrictions apply
- HOA & community: Monthly HOA fee of $370 (includes pool and grounds maintenance); Association approval required; Association name: Edith Capellan; Community amenities: clubhouse, fitness center, tennis courts, community mailbox; Pets allowed with breed restrictions
Exterior
- Utilities: Public sewer; Cable available; Public utilities
- Home design: Condominium; Residential property; One story; Unit on 2nd floor; Unit faces south
- Construction: Stucco construction; Shingle roof; Slab foundation; Built-in building number 177
- Exterior features: Exterior lighting; Paved road access
Interior
- Kitchen: Dishwasher; Range; Refrigerator; Electric water heater
- Bedrooms: 2 bedrooms
- Bathrooms: 2 full bathrooms
- Heating & cooling: Electric heat; Central air conditioning
- Interior features: Open floorplan; Living room/dining room combo; Solid surface counters
- Laundry & utility: Common area laundry room
Neighborhood map
What this means for you Summary
Snapshot
- This is a 2-bed/2.0-bath condo listed at $150k.
Deal economics
- At list price, monthly cash flow is $-67 ($-800/yr) — negative.
- To cash-flow at today's rent, offer at most $138k (7.8% below list).
- Meets the 1% rule at list price ($2k rent vs $150k).
- Recommended offer: $138k (7.8% below list) — sets the bar for cash-flow.
- Cap rate 5.8% vs local median 2.9% in Wekiwa Springs — top-decile yield for the area; either an underpriced asset or a hidden risk that comps aren't pricing in. Stress-test before assuming the spread holds.
Location & tenants
- Location reads 75/100 on livability (#264 in FL, #4,232 nationally) — a middle-class / working-renter tenant base. Strengths: crime A+, employment A+, housing A+; Watch: cost of living D, amenities F, commute F.
- Seminole (suburban): math 57% / reading 61% proficiency, ranked #13 of 73 in FL (top 18%) — acceptable for families but not a draw, mixed tenant base, ~2y average lease.
- Zoned schools: Altamonte Elementary School (math 46% / reading 51%, grade D, #1,152 of 2,144 statewide, top 55%, 589 students, 78% FRL); Rock Lake Middle School (math 72% / reading 63%, grade A-, #77 of 571 statewide, top 14%, 933 students, 33% FRL); Lyman High School (math 36% / reading 50%, grade F, #255 of 667 statewide, top 39%, 2,084 students, 53% FRL) — zoned schools average 55% FRL vs 38% district-wide (16 pts higher); higher-poverty schools than district average — tighter screening recommended.
- Market conditions: Rents rising (+3.9%/yr); 152 active listings in the ZIP; 20 comparable units currently listed for rent nearby; rentals at typical pace (median 20d on market — plan ~3-4 weeks tenant-placement turnaround); solid renter incomes; 1,979 units permitted in Seminole County in 2024 (1,191 in 5+ unit buildings).
Forward outlook
- Local home prices are declining (-3.0%/yr); year-one equity from $1k of loan paydown is wiped out by about $4k of value loss. Plan a longer hold.
- Seminole County population projected at +24% by 2050 — long-run rental-demand tailwind backs the buy-and-hold thesis.
Negotiation context
- It's been on market 40 days — a 3% lower offer ($146k) is reasonable based on typical stale-listing flexibility.
- 4 sale attempts since 15y ago; this cycle's ask has dropped $10k (6%) from the opening price — seller is motivated, your offer sets the floor, not the list.
- Current owner paid $60k; list at $150k implies a 150% gain — meaningful room to come down on a strong offer.
Risks & watch-outs
- Watch-outs: HOA is 22% of rent.
- Climate carrying-cost: severe wind risk, 99% chance of damaging wind over 30y; extreme-heat days projected 7→24/yr by 2055 (HVAC capex compounding) — expect insurance premiums to compound above CPI over the hold.
Questions for the listing agent
- What do current leases actually rent for vs. the listed asking? Can we see a recent rent roll and the last 12 months of T-12 income?
- It's been on market 40 days. Have you received any prior offers? Is the seller open to a 8% concession, seller financing, or rate buy-down credit?
- Built in 1973 — when were the roof, HVAC, electrical panel, plumbing, and water heater last replaced?
- What does the HOA fee cover, when was the last increase, and are there any pending special assessments or reserve-fund shortfalls?
- Any open or pending special assessments — roof, HVAC, plumbing, elevator, façade? What's the per-unit balance and payoff schedule, and is the seller paying it off at close or rolling it to the buyer?
- Is there a deadline driving the sale (1031 exchange, divorce, estate, relocation)? That informs how much negotiation room exists.
- The area grade is low — what's the realistic commute time and amenity access for the typical tenant pool here? Any planned neighborhood developments (good or bad) we should know about?
- What's the average days-on-market for RENTAL listings here right now (not sales)? A rising rental-DOM trend means longer vacancies and softer asking-rent achievability than the comps imply.
- What's the recent tenant-quality profile in this submarket — average credit score on applications, eviction rate, late-payment / NSF rate, and stable-employment percentage? A property-management company in the area should have these aggregated.
- How much new apartment / multifamily construction is in the pipeline within 1–3 miles? Heavy new supply (>2% of stock underway) typically softens rents 12–24 months out; light construction supports rent growth.
Investment metrics
- 1% rule
- 1.11% ✓
- Cap rate
- 5.76%
- Cash-on-cash
- -1.90%
- DSCR
- 0.92
- GRM
- 7.5
CMA / ARV
No comps found within radius.
Projected returns pro-forma
-3.0% appreciation · 3.89% rent growth · sell at horizon
- IRR
- -17.9%
- Equity multiple
- 0.36×
- Total profit
- $-26,812
- Equity at exit
- $22,365
- IRR
- -7.7%
- Equity multiple
- 0.49×
- Total profit
- $-21,573
- Equity at exit
- $12,969
Cash invested: $42,000 (down + closing). Projections, not guarantees.
Landlord ↔ Tenant lean methodology
- Overall (STATE)
- 87 Strongly Landlord-Friendly
- State Florida
- 87 Strongly Landlord-Friendly · R+3
- County
- — inherits STATE
- City
- — inherits STATE
ZIP-level market 32750
- Rents YoY
- 3.9%
- Active inventory
- 152
- Price-to-rent
- 7.5×
Monthly cashflow live
- Estimated rent
- $1,663 high interval (Pro) →
- Mortgage (P&I)
- −$787
- Tax from tax record
- −$161 /mo · $1,938/yr
- Insurance
- −$62
- HOA
- −$370
- Vacancy / Maint / Mgmt
- −$349
- Net cashflow
- $-67
Break-even live
Sensitivity live
| Price | -10% $18 | -5% $-24 | +0% $-67 | +5% $-109 | +10% $-152 |
|---|---|---|---|---|---|
| Rent | -10% $-198 | -5% $-132 | +0% $-67 | +5% $-1 | +10% $65 |
| Rate | -1.0pp $9 | -0.5pp $-28 | base $-67 | +0.5pp $-106 | +1.0pp $-145 |
UW: 25.0% down · 7.5% · 30yr · 1.5% tax · 5.0% vac · 8.0% maint · 8.0% mgmt
Financing live
Cash to close
- Down payment
- $37,500
- Closing costs
- $4,500
- Reserves months
- —
- Total cash needed
- —
Loan-product check · same deal, 3 products live
Conventional
25% down · 7.5% · 30yr
- Down + closing
- —
- Monthly P&I
- —
- Monthly cashflow
- —
- DSCR
- —
- Eligible?
- —
Personal DTI + credit; lowest rate.
DSCR
20% down · 8.5% · 30yr
- Down + closing
- —
- Monthly P&I
- —
- Monthly cashflow
- —
- DSCR
- —
- Eligible?
- —
No personal income docs; deal must DSCR.
Hard money
10% down · 12.0% · 12mo
- Down + closing
- —
- Monthly P&I
- —
- Monthly cashflow
- —
- DSCR
- —
- Eligible?
- —
Short-term bridge; refi at stabilization.
Rent comps 20 comps
| Address | Beds | Baths | Sqft | Rent | $/sqft | DOM | Units | Dist |
|---|---|---|---|---|---|---|---|---|
| 172 Springwood Cir Unit 172 Longwood, FL | 2.0 | 2.0 | 1054 | $1,550 | $1.47 | 25d | 1 | 0.01mi |
| 151 Springwood Cir Unit C Longwood, FL | 2.0 | 1.0 | 1020 | $1,520 | $1.49 | 3d | 1 | 0.07mi |
| 151 Springwood Cir Unit C Longwood, FL | 2.0 | 1.0 | 1020 | $1,520 | $1.49 | 6d | 1 | 0.07mi |
| 163 Springwood Cir Unit A Longwood, FL | 2.0 | 2.0 | 1180 | $1,650 | $1.40 | 25d | 1 | 0.09mi |
| 940 Douglas Ave #185 Altamonte Springs, FL | 2.0 | 2.0 | 1199 | $1,600 | $1.33 | 6d | 1 | 0.92mi |
| 940 Douglas Ave Altamonte Springs, FL | 1.0–2.0 | 1.0–2.0 | 1020 | $1,600 | $1.57 | 12d | 2 | 1.01mi |
| 205 Fairway Dr Longwood, FL | 2.0 | 1.0 | 1141 | $1,795 | $1.57 | 14d | 1 | 1.03mi |
| 222 Crown Oaks Way Longwood, FL | 2.0 | 2.0 | 1143 | $1,750 | $1.53 | 25d | 1 | 1.04mi |
| 108 Fairway Dr #108 Longwood, FL | 2.0 | 2.0 | 1216 | $1,900 | $1.56 | 25d | 1 | 1.05mi |
| 116 Fairway Dr Longwood, FL | 2.0 | 1.0 | 1200 | $1,900 | $1.58 | 25d | 1 | 1.06mi |
| 263 Crown Oaks Way Unit 263 Longwood, FL | 1.0 | 1.0 | 900 | $1,700 | $1.89 | 5d | 1 | 1.11mi |
| 413 Summit Ridge Pl #111 Longwood, FL | 2.0 | 1.0 | 1271 | $1,550 | $1.22 | 3d | 1 | 1.36mi |
| 417 Summit Ridge Pl #211 Longwood, FL | 2.0 | 2.0 | 1368 | $1,595 | $1.17 | 0d | 1 | 1.38mi |
| 505 Sun Ridge Pl Altamonte Springs, FL | 2.0 | 2.5 | 1124 | $1,900 | $1.69 | 25d | 1 | 1.39mi |
| 524 Sun Valley Vlg #105 Altamonte Springs, FL | 2.0 | 2.0 | 1139 | $2,100 | $1.84 | 19d | 1 | 1.42mi |
| 420 Summit Ridge Pl Longwood, FL | 2.0 | 1.0–2.5 | 1274 | $1,674 | $1.31 | 23d | 2 | 1.45mi |
| 420 Summit Ridge Pl Longwood, FL | 2.0 | 1.0–2.5 | 1274 | $1,624 | $1.28 | 21d | 2 | 1.45mi |
| 420 Summit Ridge Pl #306 Longwood, FL | 2.0 | 1.0 | 1271 | $1,599 | $1.26 | 19d | 1 | 1.45mi |
| 385 Golf Brook Cir Longwood, FL | 2.0–3.0 | 2.0 | 1495 | $2,190 | $1.46 | 0d | 5 | 1.47mi |
| 534 Sun Valley Vlg Altamonte Springs, FL | 1.0–3.0 | 1.0–2.0 | 1117 | $1,871 | $1.68 | 0d | 8 | 1.47mi |
HOA detail condo
- Monthly dues
- $370 · $4,440/yr
- Assessments
- None detected in remarks — confirm with the listing agent.
Listing history 27 events
-
2026-06-21days on market $150,000 Active 40 DOM
-
2026-06-19remarks 553-char remark
-
2026-06-19price $150,000 Active 37 DOM
-
2026-06-18days on market $159,900 Active 37 DOM
-
2026-06-17days on market $159,900 Active 36 DOM
-
2026-06-16days on market $159,900 Active 35 DOM
-
2026-06-15days on market $159,900 Active 34 DOM
-
2026-06-13days on market $159,900 Active 32 DOM
-
2026-06-09days on market $159,900 Active 28 DOM
-
2026-06-08days on market $159,900 Active 27 DOM
-
2026-06-07days on market $159,900 Active 26 DOM
-
2026-06-04days on market $159,900 Active 23 DOM
-
2026-06-03days on market $159,900 Active 22 DOM
-
2026-06-02days on market $159,900 Active 21 DOM
-
2026-06-01days on market $159,900 Active 20 DOM
-
2026-05-31days on market $159,900 Active 19 DOM
-
2026-05-12$159,900 Active
-
2013-11-19soldstatus $60,000
-
2013-10-18soldstatus $60,000 291-char remark
Show marketing remark (291 chars)
NOT an REO or Shortsale - quick responses to offers! Check out this 2/2 block condo in lovely, wooded neighborhood near Wekiva Springs!!! Features separate dining area, all kitchen appliances and screened balcony! Completely remodeled with new laminatewood floor and tiles in the bathrooms.
-
2013-09-09$63,500 291-char remark
Show marketing remark (291 chars)
NOT an REO or Shortsale - quick responses to offers! Check out this 2/2 block condo in lovely, wooded neighborhood near Wekiva Springs!!! Features separate dining area, all kitchen appliances and screened balcony! Completely remodeled with new laminatewood floor and tiles in the bathrooms.
-
2013-01-04historical
-
2012-09-22$62,300
-
2011-11-30soldstatus $34,000
-
2011-11-02$32,900
-
2005-10-05soldstatus $120,000
-
2002-05-23soldstatus $59,900
-
1981-04-01soldstatus $39,400
ⓘ Source: listings_history table (triggers on properties + properties_extension) + one-shot
backfill from property_details.listing_events for pre-trigger history.
Tax reassessment forecast FL · Resets to sale price
- Current annual tax
- $1,938 · $161/mo
- Projected year-2 tax
- $1,938 · $161/mo
- Expected delta
- $0/yr ($0/mo · 0.0%)
ⓘ Screening estimate from a state-policy table — verify with the county assessor before closing.
Climate risk First Street
- Flood 1/10 Low FEMA zone X (unshaded) · 0% chance over 30 yrs
- Wildfire 3/10 Moderate
- Heat 9/10 Extreme 7 d/yr ≥108°F today · 24 d/yr by 30 yrs out
- Wind 9/10 Extreme 99% chance of damaging wind over 30 yrs
- Air quality 2/10 Low 1 unhealthy d/yr today · 1 by 30 yrs out
Nearby sold comps map
Loading sold comps map…
Walkable amenities ~0.75 mi
Loading nearby amenities…
Taxation est. · year 1
- Rental income
- $19,959
- − Mortgage interest
- −$8,402
- − Property taxes
- −$1,938
- − Insurance
- −$750
- − Repairs & maintenance
- −$1,597
- − Management
- −$1,597
- − HOA
- −$4,440
- − Depreciation
- −$4,364
- Taxable loss
- −$3,128
- Est. tax savings @ 24.0%
- +$751
- After-tax cash flow
- $-49/yr
For passive investors: Depreciation is non-cash, so a rental often shows a tax loss while cash-flowing — sheltering income. Rental losses are passive: they offset passive income freely, and up to $25,000/yr can offset ordinary (W-2) income if you actively participate and your MAGI is under $100k (phasing out to $0 by $150k); unused losses carry forward. On sale, claimed depreciation is recaptured at up to 25%, and gains may owe capital-gains tax (a 1031 exchange can defer both). Figures are a year-1 estimate at your 24.0% rate — not tax advice; consult a CPA.
Schools (NCES district)
- District
- Seminole
- NCES district ID
- 1201710
- Math proficiency
- 57% ▼ -7.00%
- Reading proficiency
- 61% ▼ -1.00%
- Median HH income
- $58,478
- Composite
- 51.05/100
- National rank
- #1769
- State rank
- #13 of 73 in FL
Livability — Wekiwa Springs
- Score
- 75/100
- State rank
- #264
- US rank
- #4232
Category grades
Schools grade is shown separately in the Schools card above.
Census & demographics
- County
- Seminole County · 436,154 people
- Metro
- Orlando-Kissimmee-Sanford, FL
- Population (ZIP)
- 26,164
- Household income
- $86,125
- Rent vs Own
- Severe rent burden
- 774.0
Population outlook (Seminole County) Hauer SSP2
- Today (2025)
- 515,494 people
- By 2030
- 545,713 · +5.9%
- By 2040
- 598,068 · +16.0%
- By 2050
- 640,663 · +24.3%
- By 2075
- 724,461 · +40.5%
- By 2100
- 755,530 · +46.6%
Race, ethnicity, and origin ACS 2023
- Neighborhood character
- Majority White (63%)
- Race & ethnicity
- White 63% Hispanic / Latino 22% Two or more races 17% Black 5% Asian 3%
- Hispanic origin (detail)
- Mexican 2% Puerto Rican 9% Cuban 3%
- Common ancestry
- Romanian 2% Slovak 2% Lithuanian 2%
- Foreign-born
- 12% · Canada, Jamaica, China
- Languages at home
- 81% English-only · Spanish 13% Russian/Polish/Slavic 1% Other Indo-European 1%
Political lean MEDSL · Seminole
- 2024 margin
- Toss-up / Even · D 47.6% · R 51.1% · Other 1.3%
- 2008→2024 swing
- -0.8pp no change · 2008: -2.8pp · 2024: -3.5pp
- All cycles
- 2024: R+3.5 2020: D+2.8 2016: R+1.6 2012: R+6.5 2008: R+2.8
Not yet ingested
- Civics
- —
Market trends
- HPI YoY
- ▼ -250.13%
- Current HPI
- 335.7221
- Rent YoY
- ▲ 3.89%
- Metro
- Orlando-Kissimmee-Sanford, FL
- State GDP YoY
- ▲ 3.28%
- F500 in state
- 36
Industry mix (Fortune 500 HQ in FL)
| Industry | F500 HQs | Revenue |
|---|---|---|
| Industrial Technology | 2 | $29B |
|
||
| Insurance | 2 | $17B |
|
||
| Retail | 1 | $60B |
|
||
| Technology Distribution | 1 | $58B |
|
||
| Homebuilding | 1 | $35B |
|
||
| Technology Manufacturing | 1 | $35B |
|
||
Price history
+305.8% since first listed11 events — show timeline
- 2026-05-12 Listed $159,900 Stellar MLS as Distributed by MLS Grid
- 2013-11-19 Sold (Public Records) $60,000 Public Records
- 2013-10-18 Sold (MLS) $60,000 Stellar MLS as Distributed by MLS Grid
- 2013-09-09 Listed $63,500 Stellar MLS as Distributed by MLS Grid
- 2013-01-04 Listing Removed — Stellar MLS as Distributed by MLS Grid
- 2012-09-22 Listed $62,300 Stellar MLS as Distributed by MLS Grid
- 2011-11-30 Sold (MLS) $34,000 Stellar MLS as Distributed by MLS Grid
- 2011-11-02 Listed $32,900 Stellar MLS as Distributed by MLS Grid
- 2005-10-05 Sold (Public Records) $120,000 Public Records
- 2002-05-23 Sold (Public Records) $59,900 Public Records
- 1981-04-01 Sold (Public Records) $39,400 Public Records
Property tax history
+11.9%/yrLatest (2025): $1,938 · +8.6% YoY. Source: county tax records.
Cash-flow waterfall
monthlySold comps — $/sqft
last 12 mo · ≤1 miLoading sold comps…