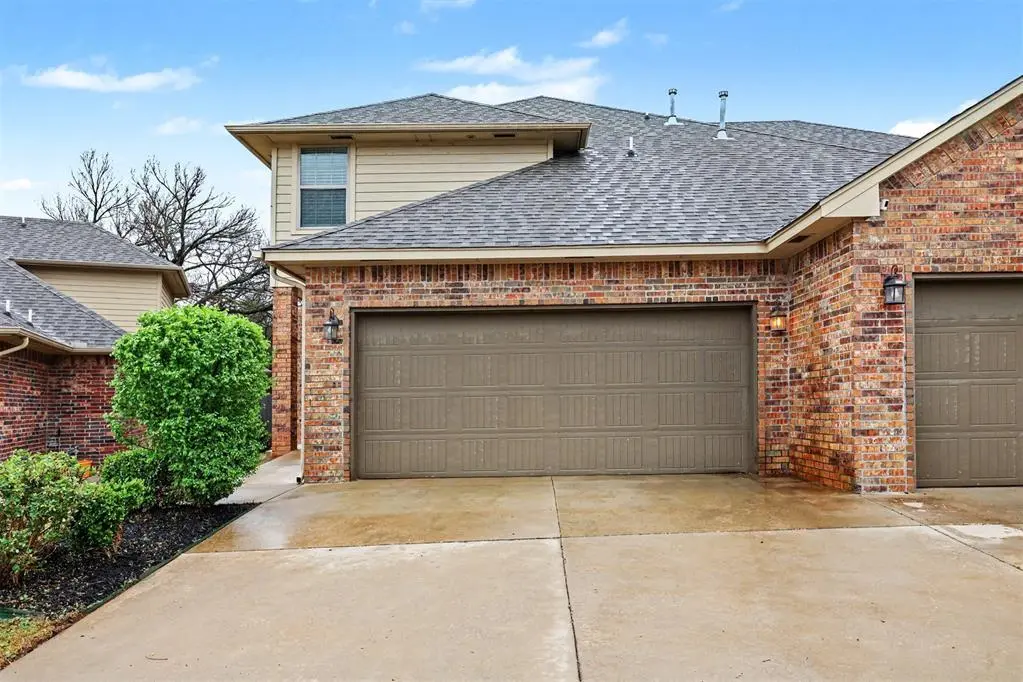
1826 NE 135th St · Oklahoma City, OK
Flood risk 1/10 · Minimal
- FEMA flood zone
- X (unshaded)
- Chance of flooding over 30 yrs
- 0.0%
- Est. flood insurance / yr
- $507 – $1,088
Fire risk 4/10 · Minor
- Est. fire insurance / yr
- $2,463 – $4,575
Heat risk 6/10 · Moderate
- Hot days now (above 107°F)
- 7 days/yr
- Hot days in 30 yrs
- 19 days/yr
Wind risk 2/10 · Minimal
- Chance of severe wind over 30 yrs
- 3.0%
Air-quality risk 2/10 · Minimal
- Unhealthy air days now
- 2 days/yr
- Unhealthy air days in 30 yrs
- 2 days/yr
Risk factors via First Street. Map © Google.
Why this score? — see what drove the D- grade
The composite is a weighted blend of 9 inputs, each scored 0–100. Each bar is that input's sub-score; the figure is the points it added to the 100-point composite (weight × sub-score).
- Cash flow +13.8/30.0
- ARV discount +4.3/15.0
- DSCR +4.2/10.0
- Livability +4.0/5.0
- 1% rule +3.7/10.0
- Schools +3.6/10.0
- Rent growth +2.5/5.0
- Condition / age +2.5/5.0
- Appreciation +0.0/10.0
$199,900
🖨 Deal sheet (PDF) 📄 Offer letter ✓ Due diligence
Listing remarks
Move-in ready 3-bedroom, 2.5-bathroom duplex located in the desirable Villas at Devon Creek. This residence is situated on a quiet cul-de-sac and features a functional open floor plan that creates a seamless flow throughout the main living areas - making it an ideal space for both daily living and entertaining. The heart of the home is the updated kitchen, which is beautifully finished with granite countertops and stainless steel appliances. The primary bedroom features an ensuite with double vanities, a tile surround soaking tub-shower combo and a walk-in closet. Enjoy the outdoors in the private, fenced in backyard with spacious covered patio. The location is a standout feature, providing
Key facts
- 2 garage spots
- Built 2015
- Listed 59 days
Property features AI
Finance
- Other: Property in The Villas At Devon Creek
- Financial info: Selling as-is; financing options include Cash, Conventional, FHA or VA; Not assumable
- HOA & community: No mandatory association dues
Exterior
- Parking: 2-car garage
- Utilities: Homestead not indicated
- Home design: Residential half duplex; Two levels; Entry level: Two
- Construction: Brick and masonry veneer exterior; Composition roof; Slab foundation; Existing property
- Exterior features: Covered patio; Wood fencing; Located on a cul-de-sac
Interior
- Kitchen: Gas range; Dishwasher; Microwave
- Bedrooms: 3 bedrooms
- Flooring: Carpet; Tile
- Bathrooms: 2 full bathrooms; 1 half bathroom
- Heating & cooling: Electric heating
- Interior features: Ceiling fans; Window treatments
Neighborhood map
What this means for you Summary
Snapshot
- This is a 3-bed/3.0-bath townhouse listed at $200k.
Deal economics
- At list price, monthly cash flow is $19 ($230/yr) — positive.
- The deal already cash-flows at list — no discount required.
- To meet the 1% rule (rent ≥ 1% of price), the offer needs to be $174k (13.1% below list).
- Recommended offer: $174k (13.1% below list) — sets the bar for 1% rule.
- Cap rate 6.4% vs local median 3.7% in Oklahoma City — top-decile yield for the area; either an underpriced asset or a hidden risk that comps aren't pricing in. Stress-test before assuming the spread holds.
Location & tenants
- Location reads 80/100 on livability (#3 in OK, #1,635 nationally) — a professional / high-income tenant draw. Strengths: amenities A+, commute A+, cost of living A+; Watch: crime F.
- Edmond (suburban): math 38% / reading 40% proficiency, ranked #11 of 270 in OK (top 4%) — families likely to look elsewhere, expect single-tenant / working-renter base with shorter leases.
- Zoned schools: Orvis Risner Es (math 26% / reading 33%, grade F, #255 of 845 statewide, top 35%, 568 students, 0% FRL); Cimarron Ms (math 24% / reading 26%, grade F, #90 of 345 statewide, top 27%, 866 students, 0% FRL); Memorial Hs (math 44% / reading 56%, grade D+, #4 of 447 statewide, top 1%, 2,605 students, 0% FRL) — zoned schools average 0% FRL vs 22% district-wide (22 pts lower); this property's tenant base skews higher-income than the district average.
- Market conditions: 72 active listings in the ZIP; 18 comparable units currently listed for rent nearby; rentals leasing fast (median 6d on market — plan ~1-2 weeks tenant-placement turnaround); high-income renter base; 5,365 units permitted in Oklahoma County in 2024 (569 in 5+ unit buildings).
- This rent is only 15% of the median local income ($138k/yr) — well below the 30% rent-burden line; pricing power to push rent on renewal without tenant pushback.
Forward outlook
- Local home prices are declining (-3.0%/yr); year-one equity from $1k of loan paydown is wiped out by about $6k of value loss. Plan a longer hold.
- Oklahoma County population projected at +41% by 2050 — long-run rental-demand tailwind backs the buy-and-hold thesis.
Negotiation context
- It's been on market 59 days — a 3% lower offer ($194k) is reasonable based on typical stale-listing flexibility.
- 2 sale attempts since 2y ago with the ask held roughly flat each time — persistent listings suggest the price (not the market) is what's stuck; bring a comps-based counter.
Risks & watch-outs
- Climate carrying-cost: extreme-heat days projected 7→19/yr by 2055 (HVAC capex compounding) — expect insurance premiums to compound above CPI over the hold.
Questions for the listing agent
- It's been on market 59 days. Have you received any prior offers? Is the seller open to a 13% concession, seller financing, or rate buy-down credit?
- Is there a deadline driving the sale (1031 exchange, divorce, estate, relocation)? That informs how much negotiation room exists.
- Schools are F-rated, which usually means shorter tenancies and higher turnover. Who's the typical renter profile here, and what's been the actual vacancy rate?
- Crime grade is F in this area — have there been break-ins, vandalism, or insurance claims at this property in the last 3 years? What carrier currently insures it and at what premium?
- The area grade is low — what's the realistic commute time and amenity access for the typical tenant pool here? Any planned neighborhood developments (good or bad) we should know about?
- What's the average days-on-market for RENTAL listings here right now (not sales)? A rising rental-DOM trend means longer vacancies and softer asking-rent achievability than the comps imply.
- What's the recent tenant-quality profile in this submarket — average credit score on applications, eviction rate, late-payment / NSF rate, and stable-employment percentage? A property-management company in the area should have these aggregated.
- How much new for-sale + rental construction is in the pipeline within 1–3 miles? Heavy new supply typically softens prices + rents 12–24 months out; constrained supply supports both.
Investment metrics
- 1% rule
- 0.87% ✗
- Cap rate
- 6.41%
- Cash-on-cash
- 0.41%
- DSCR
- 1.02
- GRM
- 9.6
CMA / ARV
- ARV (on-the-fly)
- $186,810
- Comps found
- 9
Show comp detail 9 sales within ~0.75 mi
| Address | Dist | Beds/Ba | Sqft | Sold | Price | $/sf | Match |
|---|---|---|---|---|---|---|---|
| 13814 Crossing Way East | 0.46mi | 2/2.0 (-1) | 1,367 (-5%) | 2mo | $145,000 | $106 | 60 |
| 14127 Crossing Way East | 0.65mi | 3/2.0 | 1,449 (+1%) | 11mo | $201,000 | $139 | 56 |
| 14002 Crossing Way East Way | 0.51mi | 2/2.0 (-1) | 1,327 (-8%) | 3mo | $143,000 | $108 | 52 |
| 13929 W Crossing Way | 0.59mi | 2/2.0 (-1) | 1,352 (-6%) | 3mo | $155,000 | $115 | 51 |
| 13716 Crossing Way E | 0.48mi | 2/2.0 (-1) | 1,497 (+4%) | 14mo | $194,900 | $130 | 50 |
| 14012 Crossing Way E | 0.53mi | 2/2.0 (-1) | 1,327 (-8%) | 5mo | $195,000 | $147 | 50 |
| 14004 Crossing Way | 0.52mi | 2/2.0 (-1) | 1,327 (-8%) | 13mo | $197,500 | $149 | 44 |
| 13824 E Crossing Way | 0.45mi | 2/2.0 (-1) | 1,294 (-10%) | 23mo | $144,000 | $111 | 35 |
| 14025 Crossing Way | 0.62mi | 2/2.0 (-1) | 1,263 (-12%) | 22mo | $170,000 | $135 | 24 |
Match score weights: distance 35% · size 25% · config 20% · recency 20%. Top-matched comps best support the ARV.
Projected returns pro-forma
-3.0% appreciation · 3.0% rent growth · sell at horizon
- IRR
- -15.6%
- Equity multiple
- 0.44×
- Total profit
- $-31,160
- Equity at exit
- $29,806
- IRR
- -7.2%
- Equity multiple
- 0.54×
- Total profit
- $-25,523
- Equity at exit
- $17,284
Cash invested: $55,972 (down + closing). Projections, not guarantees.
Landlord ↔ Tenant lean methodology
- Overall (STATE)
- 83 Strongly Landlord-Friendly
- State Oklahoma
- 83 Strongly Landlord-Friendly · R+20
- County
- — inherits STATE
- City
- — inherits STATE
ZIP-level market 73131
- Home prices YoY
- -23.4%
- Active inventory
- 72
- Price-to-rent
- 9.6×
Monthly cashflow live
- Estimated rent
- $1,737 high interval (Pro) →
- Mortgage (P&I)
- −$1,048
- Tax from tax record
- −$222 /mo · $2,660/yr
- Insurance
- −$83
- HOA
- −$0
- Vacancy / Maint / Mgmt
- −$365
- Net cashflow
- $19
Break-even live
Sensitivity live
| Price | -10% $132 | -5% $76 | +0% $19 | +5% $-37 | +10% $-94 |
|---|---|---|---|---|---|
| Rent | -10% $-118 | -5% $-49 | +0% $19 | +5% $88 | +10% $156 |
| Rate | -1.0pp $120 | -0.5pp $70 | base $19 | +0.5pp $-33 | +1.0pp $-85 |
UW: 25.0% down · 7.5% · 30yr · 1.5% tax · 5.0% vac · 8.0% maint · 8.0% mgmt
Financing live
Cash to close
- Down payment
- $49,975
- Closing costs
- $5,997
- Reserves months
- —
- Total cash needed
- —
Loan-product check · same deal, 3 products live
Conventional
25% down · 7.5% · 30yr
- Down + closing
- —
- Monthly P&I
- —
- Monthly cashflow
- —
- DSCR
- —
- Eligible?
- —
Personal DTI + credit; lowest rate.
DSCR
20% down · 8.5% · 30yr
- Down + closing
- —
- Monthly P&I
- —
- Monthly cashflow
- —
- DSCR
- —
- Eligible?
- —
No personal income docs; deal must DSCR.
Hard money
10% down · 12.0% · 12mo
- Down + closing
- —
- Monthly P&I
- —
- Monthly cashflow
- —
- DSCR
- —
- Eligible?
- —
Short-term bridge; refi at stabilization.
Rent comps 18 comps
| Address | Beds | Baths | Sqft | Rent | $/sqft | DOM | Units | Dist |
|---|---|---|---|---|---|---|---|---|
| 14025 N Eastern Ave Edmond, OK | 2.0 | 2.0 | 1108 | $1,349 | $1.22 | 25d | 1 | 0.33mi |
| 14002 Crossing Way E Edmond, OK | 2.0 | 2.0 | 1327 | $1,600 | $1.21 | 13d | 1 | 0.51mi |
| 2433 Shady Tree Ln Edmond, OK | 3.0 | 2.0 | 1460 | $1,795 | $1.23 | 3d | 1 | 0.65mi |
| 14140 N Broadway Ext Edmond, OK | 4.0 | 2.0 | 1327 | $1,708 | $1.29 | 25d | 1 | 0.70mi |
| 3621 Wynn Dr Edmond, OK | 1.0–2.0 | 1.0–1.5 | 894 | $1,099 | $1.23 | 3d | 6 | 0.88mi |
| 3622 Wynn Cir Edmond, OK | 3.0 | 2.0 | 1575 | $1,425 | $0.90 | 16d | 1 | 0.90mi |
| 3622 Wynn Cir Edmond, OK | 3.0 | 2.0 | 1575 | $1,425 | $0.90 | 25d | 1 | 0.90mi |
| 3623 Wynn Cir Edmond, OK | 3.0 | 2.5 | 1700 | $1,450 | $0.85 | 4d | 1 | 0.93mi |
| 3613 Wynn Cir Edmond, OK | 3.0 | 2.5 | 1737 | $1,595 | $0.92 | 6d | 1 | 0.94mi |
| 3617 Wynn Cir Edmond, OK | 3.0 | 2.5 | 1706 | $1,350 | $0.79 | 25d | 1 | 0.94mi |
| 3611 Wynn Cir Unit 1 Edmond, OK | 3.0 | 2.5 | 1737 | $1,495 | $0.86 | 6d | 1 | 0.95mi |
| 2704 NE 129th St Edmond, OK | 3.0 | 2.0 | 1572 | $1,850 | $1.18 | 5d | 1 | 0.96mi |
| 3518 Wynn Cir Edmond, OK | 3.0 | 2.5 | 1595 | $1,475 | $0.92 | 25d | 1 | 0.96mi |
| 3412 Prairie Ave Edmond, OK | 3.0 | 2.5 | 1589 | $1,970 | $1.24 | 4d | 1 | 1.12mi |
| 205 E 30th St Unit 1 Edmond, OK | 3.0 | 2.0 | 1400 | $1,450 | $1.04 | 25d | 1 | 1.28mi |
| 13005 Silver Eagle Trl Edmond, OK | 3.0 | 2.0 | 1826 | $1,750 | $0.96 | 3d | 1 | 1.35mi |
| 3215 Oakwood Dr Edmond, OK | 4.0 | 2.0 | 1602 | $2,550 | $1.59 | 4d | 1 | 1.35mi |
| 900 NE 122nd St Oklahoma City, OK | 1.0–2.0 | 1.0–2.0 | 818 | $1,240 | $1.51 | 4d | 1 | 1.40mi |
Listing history 9 events
-
2026-05-22price $199,900
-
2026-05-08price $204,900
-
2026-03-30$210,000 Active
-
2024-07-25historical
-
2024-07-18price $219,900
-
2024-06-21price $224,900
-
2024-06-06price $229,900
-
2024-05-14price $234,900
-
2024-04-24$239,900 Active
ⓘ Source: listings_history table (triggers on properties + properties_extension) + one-shot
backfill from property_details.listing_events for pre-trigger history.
Tax reassessment forecast OK · Resets to sale price
- Current annual tax
- $2,660 · $222/mo
- Projected year-2 tax
- $2,660 · $222/mo
- Expected delta
- $0/yr ($0/mo · 0.0%)
ⓘ Screening estimate from a state-policy table — verify with the county assessor before closing.
Climate risk First Street
- Flood 1/10 Low FEMA zone X (unshaded) · 0% chance over 30 yrs
- Wildfire 4/10 Moderate
- Heat 6/10 Major 7 d/yr ≥107°F today · 19 d/yr by 30 yrs out
- Wind 2/10 Low 3% chance of damaging wind over 30 yrs
- Air quality 2/10 Low 2 unhealthy d/yr today · 2 by 30 yrs out
Nearby sold comps map
Loading sold comps map…
Walkable amenities ~0.75 mi
Loading nearby amenities…
Taxation est. · year 1
- Rental income
- $20,848
- − Mortgage interest
- −$11,198
- − Property taxes
- −$2,660
- − Insurance
- −$1,000
- − Repairs & maintenance
- −$1,668
- − Management
- −$1,668
- − Depreciation
- −$5,815
- Taxable loss
- −$3,160
- Est. tax savings @ 24.0%
- +$758
- After-tax cash flow
- $989/yr
For passive investors: Depreciation is non-cash, so a rental often shows a tax loss while cash-flowing — sheltering income. Rental losses are passive: they offset passive income freely, and up to $25,000/yr can offset ordinary (W-2) income if you actively participate and your MAGI is under $100k (phasing out to $0 by $150k); unused losses carry forward. On sale, claimed depreciation is recaptured at up to 25%, and gains may owe capital-gains tax (a 1031 exchange can defer both). Figures are a year-1 estimate at your 24.0% rate — not tax advice; consult a CPA.
Schools (NCES district)
- District
- Edmond
- NCES district ID
- 4010590
- Math proficiency
- 38% ▼ -12.00%
- Reading proficiency
- 40% ▼ -12.00%
- Median HH income
- $73,212
- Composite
- 35.88/100
- National rank
- #4814
- State rank
- #11 of 270 in OK
Livability — Oklahoma City
- Score
- 80/100
- State rank
- #3
- US rank
- #1635
Category grades
Schools grade is shown separately in the Schools card above.
Census & demographics
- Census place
- Oklahoma City, OK
- County
- Oklahoma County · 771,644 people
- City population
- 498,656
- Metro
- Oklahoma City, OK
- Population (ZIP)
- 3,845
- Household income
- $137,849
- Rent vs Own
Population outlook (Oklahoma County) Hauer SSP2
- Today (2025)
- 911,875 people
- By 2030
- 982,413 · +7.7%
- By 2040
- 1,130,468 · +24.0%
- By 2050
- 1,288,422 · +41.3%
- By 2075
- 1,711,482 · +87.7%
- By 2100
- 2,088,448 · +129.0%
Race, ethnicity, and origin ACS 2023
- Neighborhood character
- Predominantly White (77%)
- Race & ethnicity
- White 77% Hispanic / Latino 8% Two or more races 8% Black 7% Asian 1%
- Hispanic origin (detail)
- Mexican 5% Puerto Rican 2%
- Common ancestry
- Lithuanian 2% Italian 1% Slovak 1%
- Foreign-born
- 2% · Canada
- Languages at home
- 95% English-only · Spanish 2% Arabic 1% Chinese 1%
Political lean MEDSL · Oklahoma
- 2024 margin
- Toss-up / Even · D 48.0% · R 49.7% · Other 2.3%
- 2008→2024 swing
- +15.1pp toward D · 2008: -16.8pp · 2024: -1.7pp
- All cycles
- 2024: R+1.7 2020: R+1.1 2016: R+10.5 2012: R+16.7 2008: R+16.8
Not yet ingested
- Civics
- —
Market trends
- HPI YoY
- ▼ -65.72%
- Current HPI
- 215.3101
- Rent YoY
- —
- Metro
- Oklahoma City, OK
- State GDP YoY
- ▲ 1.55%
- F500 in state
- 6
Industry mix (Fortune 500 HQ in OK)
| Industry | F500 HQs | Revenue |
|---|---|---|
| Energy | 3 | $48B |
|
||
Price history
-16.7% since first listed9 events — show timeline
- 2026-05-22 Price Changed $199,900 MLSOK
- 2026-05-08 Price Changed $204,900 MLSOK
- 2026-03-30 Listed $210,000 MLSOK
- 2024-07-25 Listing Removed — MLSOK
- 2024-07-18 Price Changed $219,900 MLSOK
- 2024-06-21 Price Changed $224,900 MLSOK
- 2024-06-06 Price Changed $229,900 MLSOK
- 2024-05-14 Price Changed $234,900 MLSOK
- 2024-04-24 Listed $239,900 MLSOK
Property tax history
+20.7%/yrLatest (2025): $2,660 · +3.4% YoY. Source: county tax records.
Cash-flow waterfall
monthlySold comps — $/sqft
last 12 mo · ≤1 miLoading sold comps…