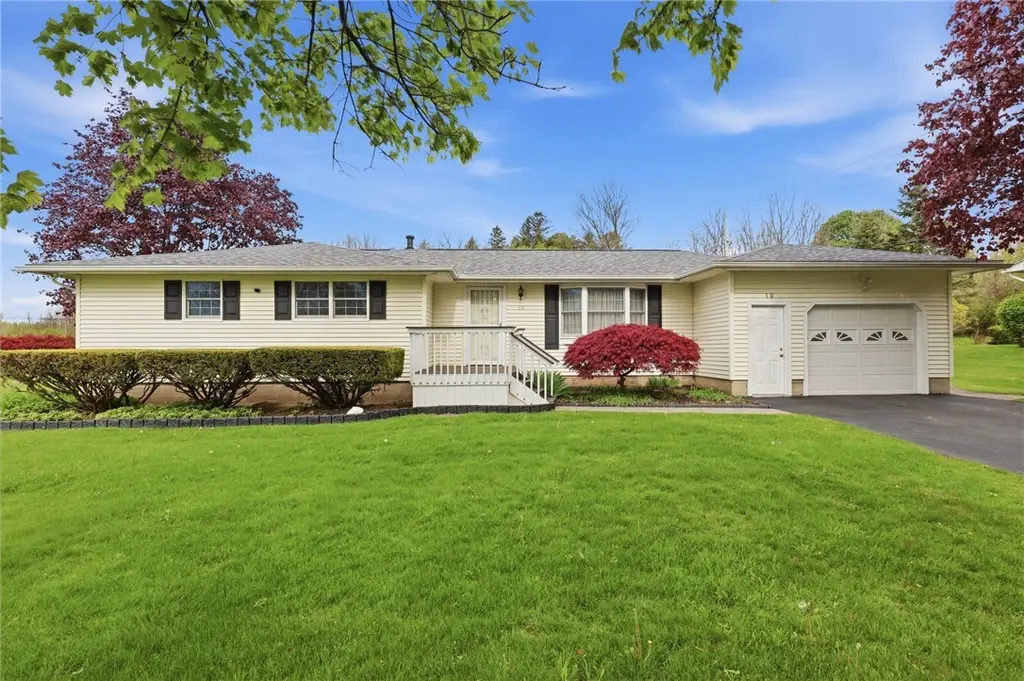
10 Fox Chapel Rd · Brighton, NY
Flood risk 1/10 · Minimal
- FEMA flood zone
- X (unshaded)
- Chance of flooding over 30 yrs
- 0.0%
- Est. flood insurance / yr
- $473 – $860
Fire risk 1/10 · Minimal
- Est. fire insurance / yr
- $691 – $1,283
Heat risk 2/10 · Minimal
- Hot days now (above 94°F)
- 7 days/yr
- Hot days in 30 yrs
- 15 days/yr
Wind risk 1/10 · Minimal
- Chance of severe wind over 30 yrs
- —
Air-quality risk 2/10 · Minimal
- Unhealthy air days now
- 1 days/yr
- Unhealthy air days in 30 yrs
- 1 days/yr
Risk factors via First Street. Map © Google.
Why this score? — see what drove the B- grade
The composite is a weighted blend of 9 inputs, each scored 0–100. Each bar is that input's sub-score; the figure is the points it added to the 100-point composite (weight × sub-score).
- Cash flow +24.3/30.0
- ARV discount +15.0/15.0
- DSCR +7.8/10.0
- 1% rule +7.2/10.0
- Schools +5.2/10.0
- Livability +4.0/5.0
- Rent growth +2.5/5.0
- Condition / age +2.5/5.0
- Appreciation +0.0/10.0
$259,000
🖨 Deal sheet 📄 Offer letter ✓ Due diligence
Listing remarks
Beautiful one-owner home showcasing true pride of ownership throughout! Super clean and meticulously cared for, this 4-bedroom, 2.5-bath ranch offers spacious living with a generous sunroom off the kitchen, perfect for relaxing or entertaining. The kitchen features original Wood-Mode cabinetry with a convenient pull-out island. Thoughtful updates provide peace of mind including a new roof (2022), furnace (2024), and water heater (2024). The dry, finished full basement adds exceptional bonus space with a full bath, laundry room, and workshop. A rare opportunity to own a lovingly cared-for home with outstanding space, character, and potential in a sought-after location! Delayed Negotiations M
Key facts
- Pull-out island
- Laundry room
- Full bath
Tags
Property features AI
Exterior
- Parking: Attached garage (1 car)
- Utilities: Public water connected; Sewer connected
- Home design: Single-story home; Existing/resale property
- Construction: Vinyl siding; Architectural shingle roof; Block foundation
- Exterior features: Blacktop driveway; Rectangular residential lot; City street frontage
Interior
- Kitchen: Gas oven and gas range; Refrigerator; Dishwasher; Range hood; Exhaust fan
- Bedrooms: Four main-level bedrooms
- Flooring: Carpet; Hardwood; Tile; Varied flooring
- Bathrooms: Two full bathrooms; One half bathroom; Two main-level bathrooms
- Heating & cooling: Forced-air gas heating; Central air conditioning
- Interior features: Eat-in kitchen; Quartz counters; Basement finished
- Laundry & utility: Washer and dryer in basement; Gas water heater
Neighborhood map
What this means for you Summary
Snapshot
- This is a 4-bed/2.0-bath single-family listed at $259k.
Deal economics
- At list price, monthly cash flow is $523 ($6k/yr) — positive.
- The deal already cash-flows at list — no discount required.
- Meets the 1% rule at list price ($3k rent vs $259k).
- Cap rate 8.7% vs local median 3.9% in Brighton — top-decile yield for the area; either an underpriced asset or a hidden risk that comps aren't pricing in. Stress-test before assuming the spread holds.
Location & tenants
- Location reads 81/100 on livability (#89 in NY, #1,379 nationally) — a professional / high-income tenant draw. Strengths: housing A+, health & safety A+, schools B+; Watch: crime D+, amenities D-.
- Rush-Henrietta Central School District (suburban): math 62% / reading 57% proficiency, ranked #237 of 590 in NY (top 40%) — acceptable for families but not a draw, mixed tenant base, ~2y average lease.
- Market conditions: 186 active listings in the ZIP; high-income renter base; 1,169 units permitted in Monroe County in 2024 (591 in 5+ unit buildings).
Forward outlook
- Local home prices are declining (-3.0%/yr); year-one equity from $2k of loan paydown is wiped out by about $8k of value loss. Plan a longer hold.
- Monroe County population projected to shrink 6% by 2050 — rents likely to lag national; underwrite the cash flow, not the appreciation.
Negotiation context
- Only 7 days on market — expect competitive offers; lowballing is unlikely to land.
Questions for the listing agent
- Built in 1961 — when were the roof, HVAC, electrical panel, plumbing, and water heater last replaced?
- Is there a deadline driving the sale (1031 exchange, divorce, estate, relocation)? That informs how much negotiation room exists.
- Schools are B-rated — typically a magnet for longer-tenancy family renters. What's the average tenant stay here, and is there a school-zone premium baked into asking?
- Crime grade is D in this area — have there been break-ins, vandalism, or insurance claims at this property in the last 3 years? What carrier currently insures it and at what premium?
- What's the average days-on-market for RENTAL listings here right now (not sales)? A rising rental-DOM trend means longer vacancies and softer asking-rent achievability than the comps imply.
- What's the recent tenant-quality profile in this submarket — average credit score on applications, eviction rate, late-payment / NSF rate, and stable-employment percentage? A property-management company in the area should have these aggregated.
- How much new for-sale + rental construction is in the pipeline within 1–3 miles? Heavy new supply typically softens prices + rents 12–24 months out; constrained supply supports both.
Investment metrics
- 1% rule
- 1.22% ✓
- Cap rate
- 8.71%
- Cash-on-cash
- 8.65%
- DSCR
- 1.38
- GRM
- 6.8
CMA / ARV
- ARV (median comp)
- $344,907
- List price
- $259,000
- Delta
- -24.91%
- Verdict
- UNDERPRICED
- Comps
- 20 within 1.0 mi
Show comp detail 12 sales within ~0.75 mi
| Address | Dist | Beds/Ba | Sqft | Sold | Price | $/sf | Match |
|---|---|---|---|---|---|---|---|
| 41 Fox Chapel Rd | 0.10mi | 3/1.0 (-1) | 1,290 (-15%) | 1mo | $315,000 | $244 | 60 |
| 63 Fawn Ridge Rd | 0.40mi | 3/1.5 (-1) | 1,584 (+4%) | 9mo | $275,000 | $174 | 60 |
| 36 Tomahawk Trl | 0.70mi | 4/2.0 | 1,624 (+7%) | 2mo | $385,000 | $237 | 54 |
| 208 Cape Cod Way | 0.71mi | 4/2.0 | 1,575 (+4%) | 11mo | $314,000 | $199 | 52 |
| 241 Cape Cod Way | 0.68mi | 4/2.0 | 1,568 (+3%) | 13mo | $325,000 | $207 | 52 |
| 271 Blackwell Ln | 0.65mi | 4/2.0 | 1,400 (-8%) | 7mo | $280,000 | $200 | 51 |
| 235 Gate House Trl | 0.70mi | 4/2.0 | 1,584 (+4%) | 14mo | $331,000 | $209 | 48 |
| 878 Pinnacle Rd | 0.45mi | 3/2.0 (-1) | 1,380 (-9%) | 14mo | $235,000 | $170 | 47 |
| 200 Blackwell Ln | 0.59mi | 4/1.0 | 1,660 (+9%) | 8mo | $218,000 | $131 | 46 |
| 106 Blackwell Ln | 0.71mi | 4/2.5 | 1,666 (+10%) | 7mo | $250,000 | $150 | 43 |
| 40 Little Glen Rd | 0.44mi | 3/2.0 (-1) | 1,731 (+14%) | 10mo | $436,700 | $252 | 42 |
| 545 Pittsford-henrietta Town Line Rd | 0.67mi | 3/2.0 (-1) | 1,665 (+10%) | 10mo | $281,000 | $169 | 39 |
Match score weights: distance 35% · size 25% · config 20% · recency 20%. Top-matched comps best support the ARV.
Projected returns pro-forma
-3.0% appreciation · 3.0% rent growth · sell at horizon
- IRR
- -3.1%
- Equity multiple
- 0.88×
- Total profit
- $-8,521
- Equity at exit
- $38,618
- IRR
- 6.6%
- Equity multiple
- 1.50×
- Total profit
- $36,100
- Equity at exit
- $22,394
Cash invested: $72,520 (down + closing). Projections, not guarantees.
Landlord ↔ Tenant lean methodology
- Overall (STATE)
- 15 Strongly Tenant-Friendly
- State New York
- 15 Strongly Tenant-Friendly · D+10
- County
- — inherits STATE
- City
- — inherits STATE
ZIP-level market 14534
- Active inventory
- 186
- Price-to-rent
- 6.8×
Monthly cashflow live
- Estimated rent
- $3,163 medium interval (Pro) →
- Mortgage (P&I)
- −$1,358
- Tax from tax record
- −$510 /mo · $6,118/yr
- Insurance
- −$108
- HOA
- −$0
- Vacancy / Maint / Mgmt
- −$664
- Net cashflow
- $523
Break-even live
UW: 25.0% down · 7.5% · 30yr · 1.5% tax · 5.0% vac · 8.0% maint · 8.0% mgmt
Financing live
Cash to close
- Down payment
- $64,750
- Closing costs
- $7,770
- Reserves months
- —
- Total cash needed
- —
Loan-product check · same deal, 3 products live
Conventional
25% down · 7.5% · 30yr
- Down + closing
- —
- Monthly P&I
- —
- Monthly cashflow
- —
- DSCR
- —
- Eligible?
- —
Personal DTI + credit; lowest rate.
DSCR
20% down · 8.5% · 30yr
- Down + closing
- —
- Monthly P&I
- —
- Monthly cashflow
- —
- DSCR
- —
- Eligible?
- —
No personal income docs; deal must DSCR.
Hard money
10% down · 12.0% · 12mo
- Down + closing
- —
- Monthly P&I
- —
- Monthly cashflow
- —
- DSCR
- —
- Eligible?
- —
Short-term bridge; refi at stabilization.
Listing history 1 events
-
2026-05-13$259,000 Active 743-char remark
ⓘ Source: listings_history table (triggers on properties + properties_extension) + one-shot
backfill from property_details.listing_events for pre-trigger history.
Tax reassessment forecast NY · Partial reset (capped growth)
- Current annual tax
- $6,118 · $510/mo
- Projected year-2 tax
- $6,118 · $510/mo
- Expected delta
- $0/yr ($0/mo · 0.0%)
ⓘ Screening estimate from a state-policy table — verify with the county assessor before closing.
Climate risk First Street
- Flood 1/10 Low FEMA zone X (unshaded) · 0% chance over 30 yrs
- Wildfire 1/10 Low
- Heat 2/10 Low 7 d/yr ≥94°F today · 15 d/yr by 30 yrs out
- Wind 1/10 Low
- Air quality 2/10 Low 1 unhealthy d/yr today · 1 by 30 yrs out
Nearby sold comps map
Loading sold comps map…
Walkable amenities ~0.75 mi
Loading nearby amenities…
Taxation est. · year 1
- Rental income
- $37,953
- − Mortgage interest
- −$14,508
- − Property taxes
- −$6,118
- − Insurance
- −$1,295
- − Repairs & maintenance
- −$3,036
- − Management
- −$3,036
- − Depreciation
- −$7,535
- Taxable income
- $2,425
- Est. tax owed @ 24.0%
- −$582
- After-tax cash flow
- $5,689/yr
For passive investors: Depreciation is non-cash, so a rental often shows a tax loss while cash-flowing — sheltering income. Rental losses are passive: they offset passive income freely, and up to $25,000/yr can offset ordinary (W-2) income if you actively participate and your MAGI is under $100k (phasing out to $0 by $150k); unused losses carry forward. On sale, claimed depreciation is recaptured at up to 25%, and gains may owe capital-gains tax (a 1031 exchange can defer both). Figures are a year-1 estimate at your 24.0% rate — not tax advice; consult a CPA.
Schools (NCES district)
- District
- Rush-Henrietta Central School District
- NCES district ID
- 3625170
- Math proficiency
- 62% ▼ -6.00%
- Reading proficiency
- 57% ▲ 1.00%
- Median HH income
- $58,682
- Composite
- 51.52/100
- National rank
- #1720
- State rank
- #237 of 590 in NY
Livability — Brighton
- Score
- 81/100
- State rank
- #89
- US rank
- #1379
Category grades
Schools grade is shown separately in the Schools card above.
Census & demographics
- County
- Monroe County · 674,131 people
- City population
- 38,703
- Metro
- Rochester, NY
- Population (ZIP)
- 33,230
- Household income
- $143,694
- Rent vs Own
- Severe rent burden
- 398.0
Population outlook (Monroe County) Hauer SSP2
- Today (2025)
- 759,460 people
- By 2030
- 757,154 · -0.3%
- By 2040
- 740,644 · -2.5%
- By 2050
- 714,443 · -5.9%
- By 2075
- 645,883 · -15.0%
- By 2100
- 547,084 · -28.0%
Race, ethnicity, and origin ACS 2023
- Neighborhood character
- Predominantly White (81%)
- Race & ethnicity
- White 81% Asian 8% Two or more races 6% Hispanic / Latino 4% Black 2%
- Common ancestry
- Romanian 5% Italian 4% Lithuanian 3%
- Foreign-born
- 12% · Canada, China, South Korea
- Languages at home
- 87% English-only · Other Indo-European 3% Chinese 2% Spanish 2%
Political lean MEDSL · Monroe
- 2024 margin
- D (+19.1) · D 59.5% · R 40.5%
- 2008→2024 swing
- +1.4pp toward D · 2008: 17.7pp · 2024: 19.1pp
- All cycles
- 2024: D+19.1 2020: D+21.0 2016: D+14.1 2012: D+17.4 2008: D+17.7
Not yet ingested
- Civics
- —
Market trends
- HPI YoY
- ▼ -232.40%
- Current HPI
- 258.0726
- Rent YoY
- —
- Metro
- Rochester, NY
- State GDP YoY
- ▲ 2.60%
- F500 in state
- 92
Industry mix (Fortune 500 HQ in NY)
| Industry | F500 HQs | Revenue |
|---|---|---|
| Financial Services | 10 | $950B |
|
||
| Consumer Goods | 9 | $162B |
|
||
| Insurance | 4 | $225B |
|
||
| Telecommunications | 2 | $144B |
|
||
| Pharmaceuticals | 2 | $112B |
|
||
| Media / Entertainment | 2 | $69B |
|
||
Price history
2 events — show timeline
- 2026-05-20 Pending — UNYREIS
- 2026-05-13 Listed $259,000 UNYREIS
Property tax history
+17.8%/yrLatest (2025): $6,118 · +207.6% YoY. Source: county tax records.
Cash-flow waterfall
monthlySold comps — $/sqft
last 12 mo · ≤1 miLoading sold comps…