 🏷️ Likely Rental
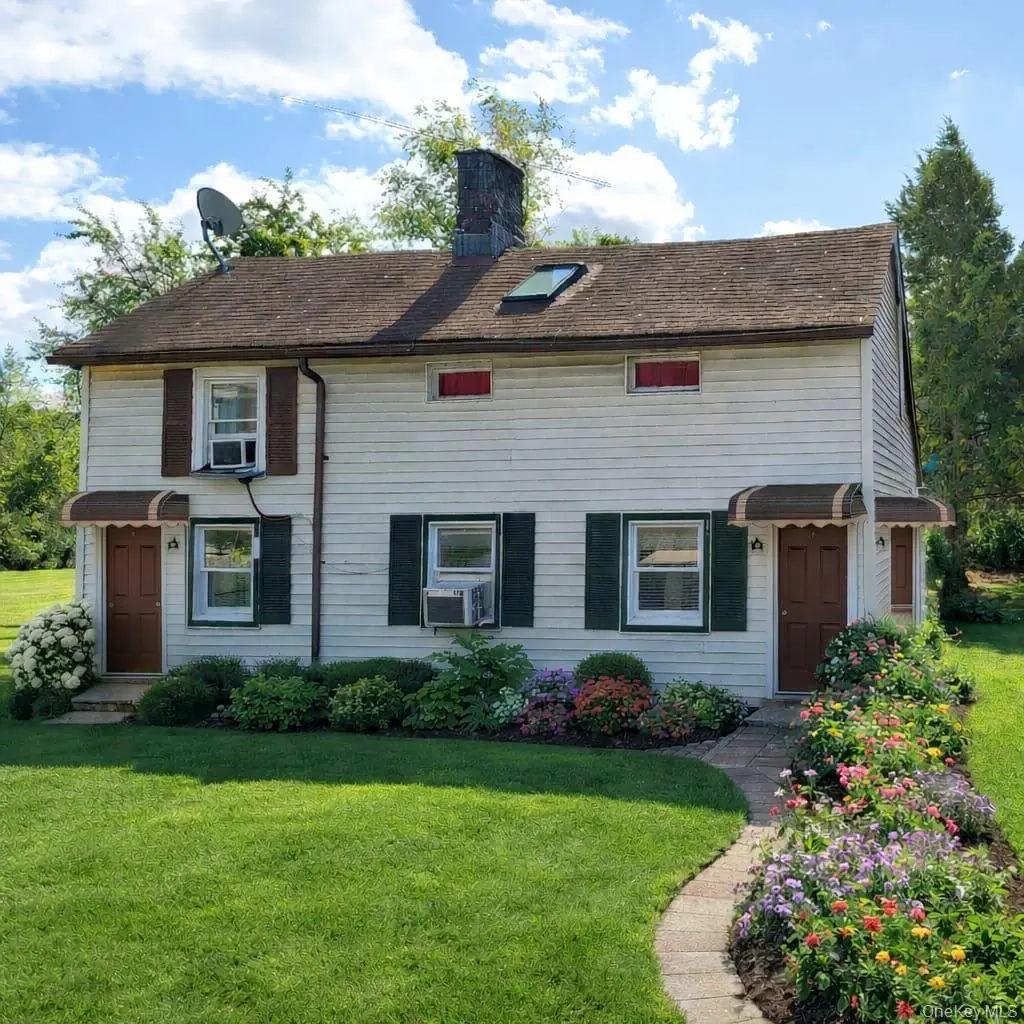
24 Pratt St · Haverstraw, NY
Flood risk 1/10 · Minimal
- FEMA flood zone
- X (unshaded)
- Chance of flooding over 30 yrs
- 0.0%
- Est. flood insurance / yr
- $507 – $1,088
Fire risk 4/10 · Minor
- Est. fire insurance / yr
- $691 – $1,283
Heat risk 6/10 · Moderate
- Hot days now (above 100°F)
- 7 days/yr
- Hot days in 30 yrs
- 16 days/yr
Wind risk 4/10 · Minor
- Chance of severe wind over 30 yrs
- 20.0%
Air-quality risk 3/10 · Minor
- Unhealthy air days now
- 2 days/yr
- Unhealthy air days in 30 yrs
- 3 days/yr
Risk factors via First Street. Map © Google.
Why this score? — see what drove the B- grade
The composite is a weighted blend of 9 inputs, each scored 0–100. Each bar is that input's sub-score; the figure is the points it added to the 100-point composite (weight × sub-score).
- Cash flow +24.4/30.0
- ARV discount +15.0/15.0
- DSCR +7.9/10.0
- 1% rule +6.3/10.0
- Rent growth +4.4/5.0
- Schools +4.1/10.0
- Livability +2.9/5.0
- Condition / age +2.5/5.0
- Appreciation +0.0/10.0
$539,000
🖨 Deal sheet (PDF) 📄 Offer letter ✓ Due diligence
Multi-family units
County records classify this as Multi-Family (2-4 Unit). Listing-text estimate: 2 units. confirmed
Listing remarks MLS
Beautiful 2-family home located in a desirable area, offering a great blend of comfort and opportunity. Both units are occupied, making it ideal for investors or end-users looking for additional income. The property is well-kept and in good condition, providing a solid and reliable setup for its next owner. Currently generating $4,645/month in rental income.
Key facts
- 3,049 sq ft lot
- Built 1900
- Listed 58 days
Neighborhood map
What this means for you Summary
Snapshot
- This is a 2 × 2-bed/1.0-bath units multifamily listed at $539k.
Deal economics
- At list price, monthly cash flow is $1k ($13k/yr) — positive. Per door: $545/mo.
- The deal already cash-flows at list — no discount required.
- Meets the 1% rule at list price ($6k rent vs $539k).
- Recommended offer: $523k (3.0% below list) — sets the bar for market timing.
- Cap rate 8.7% vs local median 5.2% in Haverstraw — top-decile yield for the area; either an underpriced asset or a hidden risk that comps aren't pricing in. Stress-test before assuming the spread holds.
Location & tenants
- Location reads 57/100 on livability (#1,087 in NY) — a working-class tenant base; expect higher turnover. Strengths: housing A+, employment B+; Watch: crime D+, schools F, amenities F.
- Haverstraw-Stony Point CSD (North Rockland) (suburban): math 41% / reading 47% proficiency, ranked #427 of 590 in NY (top 72%) — families likely to look elsewhere, expect single-tenant / working-renter base with shorter leases.
- Market conditions: Rents rising fast (+7.6%/yr); 50 active listings in the ZIP; 9 comparable units currently listed for rent nearby; rentals at typical pace (median 20d on market — plan ~3-4 weeks tenant-placement turnaround); solid renter incomes; 429 units permitted in Rockland County in 2024 (231 in 5+ unit buildings).
- At $6,095/mo this rent would consume 97% of the median local household income ($75k/yr) (locally 791% of renters already pay >50% of income on rent) — very limited rent-growth headroom before tenants either downsize or default.
Forward outlook
- Local home prices are declining (-3.0%/yr); year-one equity from $4k of loan paydown is wiped out by about $16k of value loss. Plan a longer hold.
- Rockland County population projected at +7% by 2050 — modest demand growth; plan on rents tracking national, not racing it.
- At projected returns (-3.0% appreciation + 7.6% rent growth), your $151k cash investment doubles in ~8 years — after that, you're playing with house money.
Negotiation context
- It's been on market 58 days — a 3% lower offer ($523k) is reasonable based on typical stale-listing flexibility.
- Current owner paid $325k; list at $539k implies a 66% gain — meaningful room to come down on a strong offer.
Risks & watch-outs
- Watch-outs: built in 1900 — expect roof / HVAC / electrical / plumbing capex.
- Climate carrying-cost: extreme-heat days projected 7→16/yr by 2055 (HVAC capex compounding) — expect insurance premiums to compound above CPI over the hold.
Questions for the listing agent
- It's been on market 58 days. Have you received any prior offers? Is the seller open to a 3% concession, seller financing, or rate buy-down credit?
- Can we see the unit-by-unit rent roll, current vacancy, and any below-market leases? What's the average tenancy length?
- What capital expenditures (roof, boiler, parking lot, exteriors) have been made in the last 5 years, and what's planned in the next 2?
- Built in 1900 — when were the roof, HVAC, electrical panel, plumbing, and water heater last replaced?
- Is there a deadline driving the sale (1031 exchange, divorce, estate, relocation)? That informs how much negotiation room exists.
- Schools are F-rated, which usually means shorter tenancies and higher turnover. Who's the typical renter profile here, and what's been the actual vacancy rate?
- Crime grade is D in this area — have there been break-ins, vandalism, or insurance claims at this property in the last 3 years? What carrier currently insures it and at what premium?
- What's the average days-on-market for RENTAL listings here right now (not sales)? A rising rental-DOM trend means longer vacancies and softer asking-rent achievability than the comps imply.
- What's the recent tenant-quality profile in this submarket — average credit score on applications, eviction rate, late-payment / NSF rate, and stable-employment percentage? A property-management company in the area should have these aggregated.
- How much new apartment / multifamily construction is in the pipeline within 1–3 miles? Heavy new supply (>2% of stock underway) typically softens rents 12–24 months out; light construction supports rent growth.
Investment metrics
- 1% rule
- 1.13% ✓
- Cap rate
- 8.72%
- Cash-on-cash
- 8.67%
- DSCR
- 1.39
- GRM
- 7.4
CMA / ARV
- ARV (median comp)
- $797,301
- List price
- $539,000
- Delta
- -32.40%
- Verdict
- UNDERPRICED
- Comps
- 20 within 1.0 mi
Projected returns pro-forma
-3.0% appreciation · 7.62% rent growth · sell at horizon
- IRR
- 1.9%
- Equity multiple
- 1.08×
- Total profit
- $11,834
- Equity at exit
- $80,367
- IRR
- 15.7%
- Equity multiple
- 2.55×
- Total profit
- $233,961
- Equity at exit
- $46,603
Cash invested: $150,920 (down + closing). Projections, not guarantees.
Landlord ↔ Tenant lean methodology
- Overall (STATE)
- 15 Strongly Tenant-Friendly
- State New York
- 15 Strongly Tenant-Friendly · D+10
- County
- — inherits STATE
- City
- — inherits STATE
ZIP-level market 10927
- Home prices YoY
- -23.6%
- Rents YoY
- 7.6%
- Active inventory
- 50
- Price-to-rent
- 14.7×
Monthly cashflow live
- Estimated rent
- $6,095 high interval (Pro) →
- Mortgage (P&I)
- −$2,827
- Tax est. 1.5%
- −$674 /mo · $8,085/yr
- Insurance
- −$225
- HOA
- −$0
- Vacancy / Maint / Mgmt
- −$1,280
- Net cashflow
- $1,090
Break-even live
Sensitivity live
| Price | -10% $1,463 | -5% $1,276 | +0% $1,090 | +5% $904 | +10% $718 |
|---|---|---|---|---|---|
| Rent | -10% $609 | -5% $849 | +0% $1,090 | +5% $1,331 | +10% $1,572 |
| Rate | -1.0pp $1,362 | -0.5pp $1,227 | base $1,090 | +0.5pp $950 | +1.0pp $808 |
2-unit breakdown (identical units grouped — click to expand)
| Units | Beds | Baths | Est. rent |
|---|---|---|---|
| 2× units | 2 | 1 | $6,094 |
| #1 | 2 | 1 | $3,047 |
| #2 | 2 | 1 | $3,047 |
| Total (2 units) | $6,095 | ||
UW: 25.0% down · 7.5% · 30yr · 1.5% tax · 5.0% vac · 8.0% maint · 8.0% mgmt
Financing live
Cash to close
- Down payment
- $134,750
- Closing costs
- $16,170
- Reserves months
- —
- Total cash needed
- —
Loan-product check · same deal, 3 products live
Conventional
25% down · 7.5% · 30yr
- Down + closing
- —
- Monthly P&I
- —
- Monthly cashflow
- —
- DSCR
- —
- Eligible?
- —
Personal DTI + credit; lowest rate.
DSCR
20% down · 8.5% · 30yr
- Down + closing
- —
- Monthly P&I
- —
- Monthly cashflow
- —
- DSCR
- —
- Eligible?
- —
No personal income docs; deal must DSCR.
Hard money
10% down · 12.0% · 12mo
- Down + closing
- —
- Monthly P&I
- —
- Monthly cashflow
- —
- DSCR
- —
- Eligible?
- —
Short-term bridge; refi at stabilization.
Rent comps 9 comps
| Address | Beds | Baths | Sqft | Rent | $/sqft | DOM | Units | Dist |
|---|---|---|---|---|---|---|---|---|
| 22 Westside Ave Haverstraw, NY | 3.0 | 2.0 | 1260 | $3,200 | $2.54 | 44d | 1 | 0.11mi |
| 100 Westside Ave Unit 2 Haverstraw, NY | 3.0 | 1.0 | 1492 | $2,485 | $1.67 | 1d | 1 | 0.42mi |
| 56 Coolidge St Unit 2 Haverstraw, NY | 4.0 | 1.5 | 1400 | $3,500 | $2.50 | 5d | 1 | 0.49mi |
| 56 Coolidge St Haverstraw, NY | 3.0 | 1.5 | 1440 | $3,500 | $2.43 | 12d | 1 | 0.49mi |
| 58 Samsondale Ave Unit A West Haverstraw, NY | 3.0 | 2.0 | 1512 | $3,300 | $2.18 | 19d | 1 | 0.54mi |
| 156 Coolidge St Haverstraw, NY | 3.0 | 1.5 | 1600 | $3,200 | $2.00 | 21d | 1 | 0.62mi |
| 31 N Wayne Ave West Haverstraw, NY | 3.0 | 2.0 | 1080 | $3,400 | $3.15 | 25d | 1 | 0.76mi |
| 126 Roosevelt Dr West Haverstraw, NY | 3.0 | 1.5 | 1404 | $3,600 | $2.56 | 44d | 1 | 0.95mi |
| 12 Roosevelt Dr West Haverstraw, NY | 3.0 | 1.5 | 1400 | $3,600 | $2.57 | 17d | 1 | 1.00mi |
Listing history 15 events
-
2026-06-18days on market $539,000 Active 58 DOM
-
2026-06-17days on market $539,000 Active 57 DOM
-
2026-06-16days on market $539,000 Active 56 DOM
-
2026-06-15days on market $539,000 Active 55 DOM
-
2026-06-13days on market $539,000 Active 53 DOM
-
2026-06-10days on market $539,000 Active 49 DOM
-
2026-06-08days on market $539,000 Active 48 DOM
-
2026-06-07days on market $539,000 Active 47 DOM
-
2026-06-04days on market $539,000 Active 44 DOM
-
2026-06-03days on market $539,000 Active 43 DOM
-
2026-06-02days on market $539,000 Active 42 DOM
-
2026-06-01days on market $539,000 Active 41 DOM
-
2026-05-31days on market $539,000 Active 40 DOM
-
2026-04-16$539,000 Active 360-char remark
Show marketing remark (360 chars)
Beautiful 2-family home located in a desirable area, offering a great blend of comfort and opportunity. Both units are occupied, making it ideal for investors or end-users looking for additional income. The property is well-kept and in good condition, providing a solid and reliable setup for its next owner. Currently generating $4,645/month in rental income.
-
2023-02-07soldstatus $325,000
ⓘ Source: listings_history table (triggers on properties + properties_extension) + one-shot
backfill from property_details.listing_events for pre-trigger history.
Climate risk First Street
- Flood 1/10 Low FEMA zone X (unshaded) · 0% chance over 30 yrs
- Wildfire 4/10 Moderate
- Heat 6/10 Major 7 d/yr ≥100°F today · 16 d/yr by 30 yrs out
- Wind 4/10 Moderate 20% chance of damaging wind over 30 yrs
- Air quality 3/10 Moderate 2 unhealthy d/yr today · 3 by 30 yrs out
Nearby sold comps map
Loading sold comps map…
Walkable amenities ~0.75 mi
Loading nearby amenities…
Taxation est. · year 1
- Rental income
- $73,140
- − Mortgage interest
- −$30,192
- − Property taxes
- −$8,085
- − Insurance
- −$2,695
- − Repairs & maintenance
- −$5,851
- − Management
- −$5,851
- − Depreciation
- −$15,680
- Taxable income
- $4,785
- Est. tax owed @ 24.0%
- −$1,148
- After-tax cash flow
- $11,933/yr
For passive investors: Depreciation is non-cash, so a rental often shows a tax loss while cash-flowing — sheltering income. Rental losses are passive: they offset passive income freely, and up to $25,000/yr can offset ordinary (W-2) income if you actively participate and your MAGI is under $100k (phasing out to $0 by $150k); unused losses carry forward. On sale, claimed depreciation is recaptured at up to 25%, and gains may owe capital-gains tax (a 1031 exchange can defer both). Figures are a year-1 estimate at your 24.0% rate — not tax advice; consult a CPA.
Schools (NCES district)
- District
- Haverstraw-Stony Point CSD (North Rockland)
- NCES district ID
- 3614010
- Math proficiency
- 41% ▼ -7.00%
- Reading proficiency
- 47% ▼ -1.00%
- Median HH income
- $80,218
- Composite
- 40.68/100
- National rank
- #3672
- State rank
- #427 of 590 in NY
Livability — Haverstraw
- Score
- 57/100
- State rank
- #1087
- US rank
- #21649
Category grades
Schools grade is shown separately in the Schools card above.
Census & demographics
- Census place
- Haverstraw, NY
- County
- Rockland County · 98,828 people
- City population
- 12,325
- Metro
- New York-Newark-Jersey City, NY-NJ-PA
- Population (ZIP)
- 12,325
- Household income
- $75,167
- Rent vs Own
- Severe rent burden
- 791.0
Population outlook (Rockland County) Hauer SSP2
- Today (2025)
- 339,642 people
- By 2030
- 345,987 · +1.9%
- By 2040
- 357,178 · +5.2%
- By 2050
- 362,456 · +6.7%
- By 2075
- 367,281 · +8.1%
- By 2100
- 328,211 · -3.4%
Race, ethnicity, and origin ACS 2023
- Neighborhood character
- Diverse neighborhood (Simpson 0.57)
- Race & ethnicity
- Hispanic / Latino 61% Two or more races 24% White 18% Black 17% Asian 3% Native American 2%
- Hispanic origin (detail)
- Mexican 3% Puerto Rican 8% Dominican 32%
- Common ancestry
- Hispanic 5% Romanian 1% Scotch-Irish 1%
- Foreign-born
- 43% · Canada, Dominican Republic, Guatemala
- Languages at home
- 38% English-only · Spanish 53% French/Haitian/Cajun 6% Other Asian/Pacific 2%
Political lean MEDSL · Rockland
- 2024 margin
- R (+11.8) · D 44.1% · R 55.9%
- 2008→2024 swing
- -17.7pp toward R · 2008: 5.9pp · 2024: -11.8pp
- All cycles
- 2024: R+11.8 2020: D+1.7 2016: D+5.1 2012: D+6.6 2008: D+5.9
Not yet ingested
- Civics
- —
Market trends
- HPI YoY
- ▼ -73.63%
- Current HPI
- 238.4313
- Rent YoY
- ▲ 7.62%
- Metro
- New York-Newark-Jersey City, NY-NJ-PA
- State GDP YoY
- ▲ 2.60%
- F500 in state
- 92
Industry mix (Fortune 500 HQ in NY)
| Industry | F500 HQs | Revenue |
|---|---|---|
| Financial Services | 10 | $950B |
|
||
| Consumer Goods | 9 | $162B |
|
||
| Insurance | 4 | $225B |
|
||
| Telecommunications | 2 | $144B |
|
||
| Pharmaceuticals | 2 | $112B |
|
||
| Media / Entertainment | 2 | $69B |
|
||
Price history
+65.8% since first listed2 events — show timeline
- 2026-04-16 Listed $539,000 OneKey® MLS as Distributed by MLS Grid
- 2023-02-07 Sold (Public Records) $325,000 Public Records
Property tax history
+17.8%/yrLatest (2025): $68,171 · +7.1% YoY. Source: county tax records.
Cash-flow waterfall
monthlySold comps — $/sqft
last 12 mo · ≤1 miLoading sold comps…