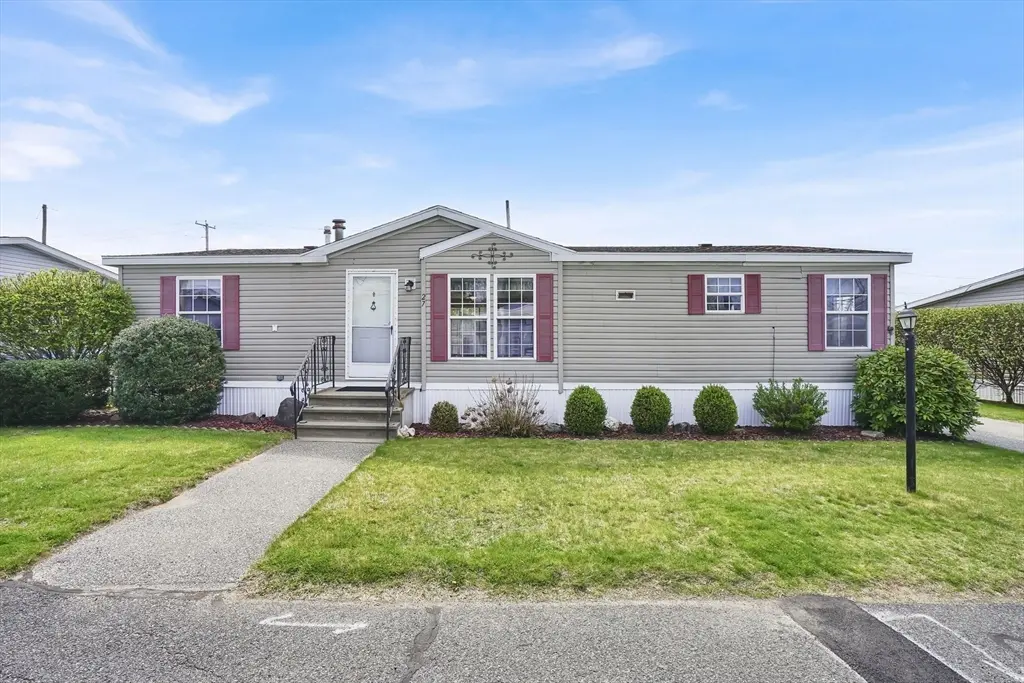
27 Somerset Rd · Chicopee, MA
Flood risk 4/10 · Minor
- FEMA flood zone
- X (unshaded)
- Chance of flooding over 30 yrs
- 0.13%
- Est. flood insurance / yr
- $473 – $860
Fire risk 4/10 · Minor
- Est. fire insurance / yr
- $915 – $1,699
Heat risk 5/10 · Moderate
- Hot days now (above 98°F)
- 7 days/yr
- Hot days in 30 yrs
- 16 days/yr
Wind risk 5/10 · Moderate
- Chance of severe wind over 30 yrs
- 23.0%
Air-quality risk 2/10 · Minimal
- Unhealthy air days now
- 1 days/yr
- Unhealthy air days in 30 yrs
- 1 days/yr
Risk factors via First Street. Map © Google.
Why this score? — see what drove the C- grade
The composite is a weighted blend of 9 inputs, each scored 0–100. Each bar is that input's sub-score; the figure is the points it added to the 100-point composite (weight × sub-score).
- Cash flow +19.3/30.0
- ARV discount +12.4/15.0
- DSCR +6.1/10.0
- 1% rule +5.1/10.0
- Livability +3.8/5.0
- Condition / age +2.8/5.0
- Rent growth +2.5/5.0
- Schools +2.3/10.0
- Appreciation +0.0/10.0
$225,000
🖨 Deal sheet 📄 Offer letter ✓ Due diligence
Listing remarks
Welcome to 27 Somerset Rd in Chicopee—a spacious 3-bedroom, 2 full bath double-wide manufactured home located in the well-maintained Holiday Circle mobile home park. This home offers a comfortable layout with generous living space both inside and out, perfect for both everyday living and entertaining! This move-in ready home provides a great opportunity to add your personal touches over time. The bedrooms are well-sized, including a primary suite with its own full bath for added convenience. Enjoy low-maintenance living with park fees that include water and property taxes, helping simplify your monthly expenses! Whether you're a first-time buyer, downsizing, or looking for an afforda
Key facts
- 3,049 sq ft lot
- 2 parking spots
- Built 1988
Property features AI
Finance
- Other: Listing status: Active; Directions: GPS
- HOA & community: Not a senior community
Exterior
- Parking: Two open parking spaces
- Utilities: Public water; Public sewer
- Home design: Mobile home; One-story house; Entry level on the first floor
- Construction: Modular construction; Slab foundation; Built (year approximate, source: public records)
- Exterior features: Cleared, level lot; Approximately 0.07-acre lot
Interior
- Kitchen: Kitchen located on the first floor
- Bedrooms: Master bedroom on the first floor; Two additional bedrooms on the first floor
- Bathrooms: Two full bathrooms on the first floor
- Heating & cooling: Central heating; Central air conditioning
- Interior features: Five total rooms; Living room on the first floor; Dining room on the first floor
Neighborhood map
What this means for you Summary
Snapshot
- This is a 3-bed/2.0-bath manufactured listed at $225k. Condition is rated average.
Deal economics
- At list price, monthly cash flow is $249 ($3k/yr) — positive.
- The deal already cash-flows at list — no discount required.
- Meets the 1% rule at list price ($2k rent vs $225k).
- Recommended offer: $218k (3.0% below list) — sets the bar for market timing.
- Cap rate 7.6% vs local median 4.6% in Chicopee — top-decile yield for the area; either an underpriced asset or a hidden risk that comps aren't pricing in. Stress-test before assuming the spread holds.
Location & tenants
- Location reads 76/100 on livability (#66 in MA, #3,658 nationally) — a middle-class / working-renter tenant base. Strengths: commute A+, housing A+, health & safety A+; Watch: employment D+, schools D, crime F.
- Chicopee (suburban): math 20% / reading 33% proficiency, ranked #270 of 302 in MA (top 89%) — low school quality limits family demand, transient renter base, plan for 1-2y turnover.
- Market conditions: 20 active listings in the ZIP; 453 units permitted in Hampden County in 2024 (116 in 5+ unit buildings).
- This rent runs 42% of the median local income ($66k/yr) — at the standard rent-burdened threshold; future hikes will face affordability resistance.
Forward outlook
- Local home prices are declining (-3.0%/yr); year-one equity from $2k of loan paydown is wiped out by about $7k of value loss. Plan a longer hold.
- Hampden County population projected at +5% by 2050 — modest demand growth; plan on rents tracking national, not racing it.
Negotiation context
- It's been on market 42 days — a 3% lower offer ($218k) is reasonable based on typical stale-listing flexibility.
Risks & watch-outs
- Climate carrying-cost: moderate wind risk, 23% chance of damaging wind over 30y; extreme-heat days projected 7→16/yr by 2055 (HVAC capex compounding) — expect insurance premiums to compound above CPI over the hold.
Questions for the listing agent
- It's been on market 42 days. Have you received any prior offers? Is the seller open to a 3% concession, seller financing, or rate buy-down credit?
- Is there a deadline driving the sale (1031 exchange, divorce, estate, relocation)? That informs how much negotiation room exists.
- Schools are D-rated, which usually means shorter tenancies and higher turnover. Who's the typical renter profile here, and what's been the actual vacancy rate?
- Crime grade is F in this area — have there been break-ins, vandalism, or insurance claims at this property in the last 3 years? What carrier currently insures it and at what premium?
- What's the average days-on-market for RENTAL listings here right now (not sales)? A rising rental-DOM trend means longer vacancies and softer asking-rent achievability than the comps imply.
- What's the recent tenant-quality profile in this submarket — average credit score on applications, eviction rate, late-payment / NSF rate, and stable-employment percentage? A property-management company in the area should have these aggregated.
- How much new for-sale + rental construction is in the pipeline within 1–3 miles? Heavy new supply typically softens prices + rents 12–24 months out; constrained supply supports both.
Investment metrics
- 1% rule
- 1.01% ✓
- Cap rate
- 7.62%
- Cash-on-cash
- 4.74%
- DSCR
- 1.21
- GRM
- 8.2
CMA / ARV
- ARV (median comp)
- $252,620
- List price
- $225,000
- Delta
- -10.93%
- Verdict
- UNDERPRICED
- Comps
- 12 within 1.0 mi
Show comp detail 12 sales within ~0.75 mi
| Address | Dist | Beds/Ba | Sqft | Sold | Price | $/sf | Match |
|---|---|---|---|---|---|---|---|
| 24 Festival Cir | 0.11mi | 3/2.0 | 1,352 (+0%) | 6mo | $260,500 | $193 | 89 |
| 111 Festival Cir | 0.11mi | 3/2.0 | 1,456 (+8%) | 2mo | $259,900 | $179 | 80 |
| 89 Celebration Cir | 0.08mi | 3/2.0 | 1,300 (-4%) | 12mo | $290,000 | $223 | 80 |
| 11 Gala Way | 0.03mi | 2/2.0 (-1) | 1,456 (+8%) | 1mo | $260,000 | $179 | 79 |
| 43 Somerset Rd | 0.02mi | 3/2.0 | 1,456 (+8%) | 10mo | $242,500 | $167 | 78 |
| 17 Jubilee Way | 0.04mi | 3/2.0 | 1,456 (+8%) | 15mo | $250,000 | $172 | 72 |
| 94 Sunrise Ln | 0.20mi | 2/2.0 (-1) | 1,350 (0%) | 19mo | $300,000 | $222 | 70 |
| 5 Somerset Rd | 0.04mi | 3/2.0 | 1,456 (+8%) | 21mo | $175,000 | $120 | 67 |
| 30 Festival Cir | 0.12mi | 3/2.0 | 1,248 (-8%) | 18mo | $178,750 | $143 | 66 |
| 54 Sunrise Ln | 0.24mi | 3/2.0 | 1,493 (+11%) | 8mo | $312,000 | $209 | 65 |
| 26 Fiesta Way | 0.15mi | 3/2.0 | 1,456 (+8%) | 19mo | $214,900 | $148 | 64 |
| 7 Nelligan | 0.13mi | 2/2.0 (-1) | 1,148 (-15%) | 10mo | $128,000 | $111 | 56 |
Match score weights: distance 35% · size 25% · config 20% · recency 20%. Top-matched comps best support the ARV.
Projected returns pro-forma
-3.0% appreciation · 3.0% rent growth · sell at horizon
- IRR
- -8.9%
- Equity multiple
- 0.67×
- Total profit
- $-20,576
- Equity at exit
- $33,548
- IRR
- 0.6%
- Equity multiple
- 1.04×
- Total profit
- $2,631
- Equity at exit
- $19,454
Cash invested: $63,000 (down + closing). Projections, not guarantees.
Landlord ↔ Tenant lean methodology
- Overall (STATE)
- 20 Strongly Tenant-Friendly
- State Massachusetts
- 20 Strongly Tenant-Friendly · D+15
- County
- — inherits STATE
- City
- — inherits STATE
ZIP-level market 01020
- Home prices YoY
- -34.5%
- Active inventory
- 20
- Price-to-rent
- 8.2×
Monthly cashflow live
- Estimated rent
- $2,283 medium interval (Pro) →
- Mortgage (P&I)
- −$1,180
- Tax est. 1.5%
- −$281 /mo · $3,375/yr
- Insurance
- −$94
- HOA
- −$0
- Vacancy / Maint / Mgmt
- −$479
- Net cashflow
- $249
Break-even live
UW: 25.0% down · 7.5% · 30yr · 1.5% tax · 5.0% vac · 8.0% maint · 8.0% mgmt
Financing live
Cash to close
- Down payment
- $56,250
- Closing costs
- $6,750
- Reserves months
- —
- Total cash needed
- —
Loan-product check · same deal, 3 products live
Conventional
25% down · 7.5% · 30yr
- Down + closing
- —
- Monthly P&I
- —
- Monthly cashflow
- —
- DSCR
- —
- Eligible?
- —
Personal DTI + credit; lowest rate.
DSCR
20% down · 8.5% · 30yr
- Down + closing
- —
- Monthly P&I
- —
- Monthly cashflow
- —
- DSCR
- —
- Eligible?
- —
No personal income docs; deal must DSCR.
Hard money
10% down · 12.0% · 12mo
- Down + closing
- —
- Monthly P&I
- —
- Monthly cashflow
- —
- DSCR
- —
- Eligible?
- —
Short-term bridge; refi at stabilization.
Listing history 17 events
-
2026-06-18days on market $225,000 Active 42 DOM
-
2026-06-17days on market $225,000 Active 41 DOM
-
2026-06-16days on market $225,000 Active 40 DOM
-
2026-06-15days on market $225,000 Active 39 DOM
-
2026-06-14days on market $225,000 Active 37 DOM
-
2026-06-13days on market $225,000 Active 36 DOM
-
2026-06-10days on market $225,000 Active 34 DOM
-
2026-06-09days on market $225,000 Active 33 DOM
-
2026-06-08days on market $225,000 Active 32 DOM
-
2026-06-07statusdays on market $225,000 Active 31 DOM
-
2026-06-03days on market $225,000 Price Changed 27 DOM
-
2026-06-02days on market $225,000 Price Changed 26 DOM
-
2026-06-01days on market $225,000 Price Changed 25 DOM
-
2026-06-01pricestatus $225,000 Price Changed 24 DOM
-
2026-05-31days on market $245,000 Active 24 DOM
-
2026-05-30days on market $245,000 Active 23 DOM
-
2026-05-07$249,900 New 864-char remark
ⓘ Source: listings_history table (triggers on properties + properties_extension) + one-shot
backfill from property_details.listing_events for pre-trigger history.
Climate risk First Street
- Flood 4/10 Moderate FEMA zone X (unshaded) · 13% chance over 30 yrs
- Wildfire 4/10 Moderate
- Heat 5/10 Major 7 d/yr ≥98°F today · 16 d/yr by 30 yrs out
- Wind 5/10 Major 23% chance of damaging wind over 30 yrs
- Air quality 2/10 Low 1 unhealthy d/yr today · 1 by 30 yrs out
Nearby sold comps map
Loading sold comps map…
Walkable amenities ~0.75 mi
Loading nearby amenities…
Taxation est. · year 1
- Rental income
- $27,399
- − Mortgage interest
- −$12,603
- − Property taxes
- −$3,375
- − Insurance
- −$1,125
- − Repairs & maintenance
- −$2,192
- − Management
- −$2,192
- − Depreciation
- −$6,545
- Taxable loss
- −$634
- Est. tax savings @ 24.0%
- +$152
- After-tax cash flow
- $3,138/yr
For passive investors: Depreciation is non-cash, so a rental often shows a tax loss while cash-flowing — sheltering income. Rental losses are passive: they offset passive income freely, and up to $25,000/yr can offset ordinary (W-2) income if you actively participate and your MAGI is under $100k (phasing out to $0 by $150k); unused losses carry forward. On sale, claimed depreciation is recaptured at up to 25%, and gains may owe capital-gains tax (a 1031 exchange can defer both). Figures are a year-1 estimate at your 24.0% rate — not tax advice; consult a CPA.
Condition & rehab AI · 30 photos
This move-in ready manufactured home in Holiday Circle mobile home park offers a spacious layout with average condition. Minor repairs and updates to the kitchen, bathroom, exterior, and interior walls would significantly enhance its value.
Repairs flagged
- Minor Kitchen cabinets — Worn appearance
- Minor Bathroom fixtures — Need cleaning and updating
- Minor Exterior siding — Weathered appearance
- Minor Interior walls — Paint faded
Value-add opportunities
- Both Paint interior walls — Fresh paint enhances curb appeal and interior aesthetics
- Both Replace kitchen cabinets — New cabinets improve functionality and aesthetics
- Both Replace bathroom fixtures — Modern fixtures improve functionality and aesthetics
- Both Landscaping upgrade — Fresh landscaping enhances curb appeal and property value
Renovation cost estimate screening
| Repair item | Severity | Est. cost |
|---|---|---|
| Kitchen cabinets · Worn appearance | Minor | $500–3,000 |
| Bathroom fixtures · Need cleaning and updating | Minor | $500–3,000 |
| Exterior siding · Weathered appearance | Minor | $500–3,000 |
| Interior walls · Paint faded | Minor | $500–3,000 |
| Total estimated repair cost · 4 items | $2,000–12,000 |
Value-add ROI direction
- Both Paint interior walls — Fresh paint enhances curb appeal and interior aesthetics ↑
- Both Replace kitchen cabinets — New cabinets improve functionality and aesthetics ↑
- Both Replace bathroom fixtures — Modern fixtures improve functionality and aesthetics ↑
- Both Landscaping upgrade — Fresh landscaping enhances curb appeal and property value ↑
ⓘ Cost ranges are severity-bucket heuristics (US national rule-of-thumb). Get contractor quotes + a written scope before underwriting a rehab budget.
Schools (NCES district)
- District
- Chicopee
- NCES district ID
- 2503660
- Math proficiency
- 20% ▼ -22.00%
- Reading proficiency
- 33% ▼ -10.00%
- Median HH income
- $46,414
- Composite
- 22.91/100
- National rank
- #7997
- State rank
- #270 of 302 in MA
Livability — Chicopee
- Score
- 76/100
- State rank
- #66
- US rank
- #3658
Category grades
Schools grade is shown separately in the Schools card above.
Census & demographics
- Census place
- Chicopee, MA
- County
- Hampden County · 230,965 people
- City population
- 53,451
- Metro
- Springfield, MA
- Population (ZIP)
- 30,167
- Household income
- $66,009
- Rent vs Own
- Severe rent burden
- 1153.0
Population outlook (Hampden County) Hauer SSP2
- Today (2025)
- 485,646 people
- By 2030
- 491,517 · +1.2%
- By 2040
- 500,539 · +3.1%
- By 2050
- 508,827 · +4.8%
- By 2075
- 539,167 · +11.0%
- By 2100
- 545,698 · +12.4%
Race, ethnicity, and origin ACS 2023
- Neighborhood character
- Predominantly White (71%)
- Race & ethnicity
- White 71% Hispanic / Latino 21% Two or more races 11% Black 4% Asian 2%
- Hispanic origin (detail)
- Puerto Rican 18% Dominican 2%
- Common ancestry
- Romanian 15% Lithuanian 14% Scotch-Irish 2%
- Foreign-born
- 9% · Canada
- Languages at home
- 80% English-only · Spanish 11% Russian/Polish/Slavic 3% Other Asian/Pacific 2%
Political lean MEDSL · Hampden
- 2024 margin
- Lean D (+8.9) · D 53.4% · R 44.5% · Other 2.1%
- 2008→2024 swing
- -16.4pp toward R · 2008: 25.3pp · 2024: 8.9pp
- All cycles
- 2024: D+8.9 2020: D+17.7 2016: D+16.0 2012: D+25.4 2008: D+25.3
Not yet ingested
- Civics
- —
Market trends
- HPI YoY
- ▼ -150.25%
- Current HPI
- 285.6119
- Rent YoY
- —
- Metro
- Springfield, MA
- State GDP YoY
- ▲ 2.28%
- F500 in state
- 38
Industry mix (Fortune 500 HQ in MA)
| Industry | F500 HQs | Revenue |
|---|---|---|
| Technology | 3 | $17B |
|
||
| Insurance | 2 | $84B |
|
||
| Retail | 2 | $76B |
|
||
| Life Sciences | 1 | $43B |
|
||
| Energy Technology | 1 | $31B |
|
||
| Aerospace / Defense | 1 | $18B |
|
||
Price history
-10.0% since first listed3 events — show timeline
- 2026-06-01 Price Changed $225,000 MLS PIN
- 2026-05-21 Price Changed $245,000 MLS PIN
- 2026-05-07 Listed $249,900 MLS PIN
Cash-flow waterfall
monthlySold comps — $/sqft
last 12 mo · ≤1 miLoading sold comps…