 🏷️ Likely Rental
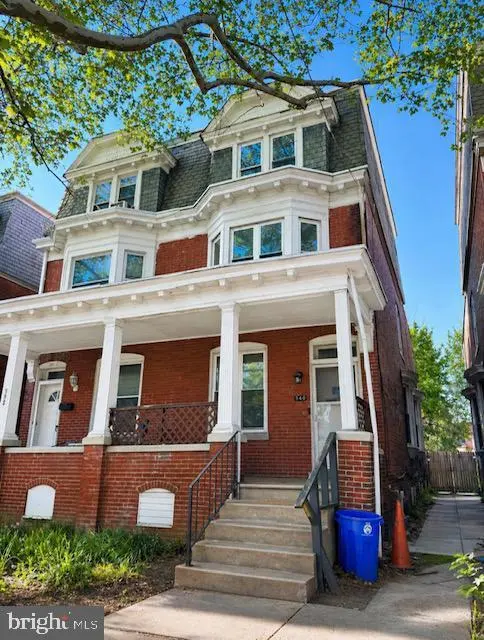
540 Schuylkill St · Harrisburg, PA
Flood risk 1/10 · Minimal
- FEMA flood zone
- X (unshaded)
- Chance of flooding over 30 yrs
- 0.0%
- Est. flood insurance / yr
- $473 – $860
Fire risk 1/10 · Minimal
- Est. fire insurance / yr
- $511 – $949
Heat risk 6/10 · Moderate
- Hot days now (above 101°F)
- 7 days/yr
- Hot days in 30 yrs
- 15 days/yr
Wind risk 3/10 · Minor
- Chance of severe wind over 30 yrs
- 5.0%
Air-quality risk 2/10 · Minimal
- Unhealthy air days now
- 1 days/yr
- Unhealthy air days in 30 yrs
- 3 days/yr
Risk factors via First Street. Map © Google.
Why this score? — see what drove the B grade
The composite is a weighted blend of 9 inputs, each scored 0–100. Each bar is that input's sub-score; the figure is the points it added to the 100-point composite (weight × sub-score).
- Cash flow +30.0/30.0
- ARV discount +15.0/15.0
- DSCR +10.0/10.0
- 1% rule +9.2/10.0
- Livability +4.2/5.0
- Rent growth +2.9/5.0
- Condition / age +2.5/5.0
- Schools +0.8/10.0
- Appreciation +0.0/10.0
$140,000
🖨 Deal sheet 📄 Offer letter ✓ Due diligence
Listing remarks
Investor Opportunity! This semi-detached brick home offers a spacious and functional layout with a smooth flow from the living room to the dining area and into the kitchen—ideal for both everyday living and strong rental appeal. Featuring 5 bedrooms, this property provides plenty of space and excellent income potential. Currently vacant and ready for immediate occupancy, this is a great opportunity for investors looking to place a tenant quickly or for an owner-occupant seeking value and space. The property also offers 2 off-street parking spaces in the rear, adding convenience and additional appeal. Even more opportunity awaits—the seller is also offering a second matching semi
Key facts
- Versatile property
- Spacious layout
- Strong rental appeal
Tags
Property features AI
Exterior
- Parking: Two total garage/parking spaces; Two off-site spaces; On-street parking available
- Utilities: Public water; Public sewer; Natural gas for heating and hot water
- Home design: Semi-detached property; Architectural shingle and rubber roofs; Fee simple ownership
- Construction: Brick construction; Foundations of block, brick/mortar, and stone; Original construction year per assessor
- Exterior features: Not in a federal flood zone; Above- and below-grade structures noted
Interior
- Bedrooms: Three bedrooms on the first upper level; Two bedrooms on the second upper level
- Flooring: Carpet; Wood; Vinyl
- Bathrooms: One full bathroom
- Heating & cooling: Hot water radiator heating (natural gas); Ceiling fans; Window air conditioning units
- Interior features: 9'+ ceilings; Drywall walls and ceilings; Full unfinished basement with interior access
Neighborhood map
What this means for you Summary
Snapshot
- This is a 5-bed/1.0-bath single-family listed at $140k.
Deal economics
- At list price, monthly cash flow is $615 ($7k/yr) — positive.
- The deal already cash-flows at list — no discount required.
- Meets the 1% rule at list price ($2k rent vs $140k).
- Cap rate 11.6% vs local median 6.6% in Harrisburg — top-decile yield for the area; either an underpriced asset or a hidden risk that comps aren't pricing in. Stress-test before assuming the spread holds.
Location & tenants
- Location reads 84/100 on livability (#107 in PA, #826 nationally) — a professional / high-income tenant draw. Strengths: amenities A+, commute A+, cost of living A+; Watch: employment D, crime F.
- Harrisburg City SD (urban): math 6% / reading 13% proficiency, ranked #535 of 539 in PA (top 99%) — low school quality limits family demand, transient renter base, plan for 1-2y turnover; 82% free/reduced lunch — lower-income household profile, screen leases tightly.
- Zoned schools: Harrisburg Hs (math 24% / reading 10%, grade F, #399 of 437 statewide, top 92%, 1,230 students, 100% FRL) — zoned schools average 100% FRL vs 82% district-wide (18 pts higher); higher-poverty schools than district average — tighter screening recommended.
- Market conditions: Rents rising (+1.6%/yr); 170 active listings in the ZIP; 10 comparable units currently listed for rent nearby; rentals at typical pace (median 24d on market — plan ~3-4 weeks tenant-placement turnaround); 40% of comp listings sitting > 30 days — soft ceiling on asking rent; solid renter incomes; 540 units permitted in Dauphin County in 2024 (194 in 5+ unit buildings).
Forward outlook
- Local home prices are declining (-3.0%/yr); year-one equity from $968 of loan paydown is wiped out by about $4k of value loss. Plan a longer hold.
- At projected returns (-3.0% appreciation + 1.6% rent growth), your $39k cash investment doubles in ~8 years — after that, you're playing with house money.
Negotiation context
- Only 7 days on market — expect competitive offers; lowballing is unlikely to land.
- 2 sale attempts since 2y ago with the ask held roughly flat each time — persistent listings suggest the price (not the market) is what's stuck; bring a comps-based counter.
Risks & watch-outs
- Watch-outs: built in 1915 — expect roof / HVAC / electrical / plumbing capex.
- Climate carrying-cost: extreme-heat days projected 7→15/yr by 2055 (HVAC capex compounding) — expect insurance premiums to compound above CPI over the hold.
Questions for the listing agent
- Built in 1915 — when were the roof, HVAC, electrical panel, plumbing, and water heater last replaced?
- Is there a deadline driving the sale (1031 exchange, divorce, estate, relocation)? That informs how much negotiation room exists.
- Crime grade is F in this area — have there been break-ins, vandalism, or insurance claims at this property in the last 3 years? What carrier currently insures it and at what premium?
- What's the average days-on-market for RENTAL listings here right now (not sales)? A rising rental-DOM trend means longer vacancies and softer asking-rent achievability than the comps imply.
- What's the recent tenant-quality profile in this submarket — average credit score on applications, eviction rate, late-payment / NSF rate, and stable-employment percentage? A property-management company in the area should have these aggregated.
- How much new for-sale + rental construction is in the pipeline within 1–3 miles? Heavy new supply typically softens prices + rents 12–24 months out; constrained supply supports both.
Investment metrics
- 1% rule
- 1.42% ✓
- Cap rate
- 11.56%
- Cash-on-cash
- 18.82%
- DSCR
- 1.84
- GRM
- 5.9
CMA / ARV
- ARV (median comp)
- $183,922
- List price
- $140,000
- Delta
- -23.88%
- Verdict
- UNDERPRICED
- Comps
- 20 within 1.0 mi
Show comp detail 9 sales within ~0.75 mi
| Address | Dist | Beds/Ba | Sqft | Sold | Price | $/sf | Match |
|---|---|---|---|---|---|---|---|
| 2346 N 6th St | 0.16mi | 5/1.5 | 2,520 (+6%) | 19mo | $130,000 | $52 | 66 |
| 2600 N 6th St | 0.12mi | 5/2.0 | 2,579 (+8%) | 18mo | $135,000 | $52 | 62 |
| 2228 N 6th St | 0.31mi | 4/2.0 (-1) | 2,480 (+4%) | 12mo | $70,000 | $28 | 60 |
| 2122 Jefferson St | 0.47mi | 5/1.0 | 2,156 (-10%) | 11mo | $65,000 | $30 | 53 |
| 2432 Green St | 0.33mi | 4/2.5 (-1) | 2,450 (+3%) | 24mo | $250,000 | $102 | 50 |
| 2902 Parkside Ln | 0.51mi | 4/2.0 (-1) | 2,351 (-2%) | 20mo | $425,000 | $181 | 48 |
| 2007 N 3rd St | 0.58mi | 4/2.0 (-1) | 2,334 (-2%) | 22mo | $425,000 | $182 | 42 |
| 2711 N 2nd St | 0.45mi | 4/3.0 (-1) | 2,288 (-4%) | 23mo | $347,000 | $152 | 40 |
| 2215 N 2nd St | 0.50mi | 5/3.5 | 2,629 (+10%) | 14mo | $415,000 | $158 | 38 |
Match score weights: distance 35% · size 25% · config 20% · recency 20%. Top-matched comps best support the ARV.
Projected returns pro-forma
-3.0% appreciation · 1.55% rent growth · sell at horizon
- IRR
- 9.0%
- Equity multiple
- 1.35×
- Total profit
- $13,635
- Equity at exit
- $20,874
- IRR
- 16.9%
- Equity multiple
- 2.30×
- Total profit
- $50,983
- Equity at exit
- $12,105
Cash invested: $39,200 (down + closing). Projections, not guarantees.
Landlord ↔ Tenant lean methodology
- Overall (STATE)
- 62 Landlord-Friendly
- State Pennsylvania
- 62 Landlord-Friendly · EVEN
- County
- — inherits STATE
- City
- — inherits STATE
ZIP-level market 17110
- Rents YoY
- 1.6%
- Active inventory
- 170
- Price-to-rent
- 5.9×
Monthly cashflow live
- Estimated rent
- $1,992 high interval (Pro) →
- Mortgage (P&I)
- −$734
- Tax from tax record
- −$166 /mo · $1,993/yr
- Insurance
- −$58
- HOA
- −$0
- Vacancy / Maint / Mgmt
- −$418
- Net cashflow
- $615
Break-even live
UW: 25.0% down · 7.5% · 30yr · 1.5% tax · 5.0% vac · 8.0% maint · 8.0% mgmt
Financing live
Cash to close
- Down payment
- $35,000
- Closing costs
- $4,200
- Reserves months
- —
- Total cash needed
- —
Loan-product check · same deal, 3 products live
Conventional
25% down · 7.5% · 30yr
- Down + closing
- —
- Monthly P&I
- —
- Monthly cashflow
- —
- DSCR
- —
- Eligible?
- —
Personal DTI + credit; lowest rate.
DSCR
20% down · 8.5% · 30yr
- Down + closing
- —
- Monthly P&I
- —
- Monthly cashflow
- —
- DSCR
- —
- Eligible?
- —
No personal income docs; deal must DSCR.
Hard money
10% down · 12.0% · 12mo
- Down + closing
- —
- Monthly P&I
- —
- Monthly cashflow
- —
- DSCR
- —
- Eligible?
- —
Short-term bridge; refi at stabilization.
Rent comps 10 comps
| Address | Beds | Baths | Sqft | Rent | $/sqft | DOM | Units | Dist |
|---|---|---|---|---|---|---|---|---|
| 2715 N 6th St Harrisburg, PA | 4.0 | 1.0 | 1620 | $1,650 | $1.02 | 14d | 1 | 0.26mi |
| 2728 N 6th St Harrisburg, PA | 4.0 | 2.0 | 1786 | $1,750 | $0.98 | 14d | 1 | 0.28mi |
| 2153 Penn St Harrisburg, PA | 4.0 | 2.0 | 1620 | $1,995 | $1.23 | 43d | 1 | 0.53mi |
| 2032 Susquehanna St Harrisburg, PA | 4.0 | 1.5 | 1600 | $1,595 | $1.00 | 43d | 1 | 0.62mi |
| 3015 N 5th St Harrisburg, PA | 6.0 | 2.5 | 3356 | $2,795 | $0.83 | 14d | 1 | 0.63mi |
| 1834 Green St Harrisburg, PA | 4.0 | 1.0 | 1792 | $1,495 | $0.83 | 23d | 1 | 0.78mi |
| 1716 N 6th St Unit NA Harrisburg, PA | 4.0 | 4.0 | 2400 | $2,000 | $0.83 | 23d | 1 | 0.82mi |
| 1716 N 6th St Harrisburg, PA | 4.0 | 3.5 | 2400 | $2,200 | $0.92 | 43d | 1 | 0.82mi |
| 1330 Susquehanna St Harrisburg, PA | 4.0 | 1.5 | 2280 | $1,895 | $0.83 | 23d | 1 | 1.19mi |
| 1202 Penn St Harrisburg, PA | 4.0 | 1.0 | 1706 | $1,495 | $0.88 | 43d | 1 | 1.33mi |
Listing history 4 events
-
2026-05-03status Pending 951-char remark
-
2026-04-26$140,000 Active 951-char remark
-
2025-01-13historical $1,195
-
2024-12-21$1,195
ⓘ Source: listings_history table (triggers on properties + properties_extension) + one-shot
backfill from property_details.listing_events for pre-trigger history.
Tax reassessment forecast PA · Partial reset (capped growth)
- Current annual tax
- $1,993 · $166/mo
- Projected year-2 tax
- $2,102 · $175/mo
- Expected delta
- +$110/yr (+$9/mo · 5.5%)
ⓘ Screening estimate from a state-policy table — verify with the county assessor before closing.
Climate risk First Street
- Flood 1/10 Low FEMA zone X (unshaded) · 0% chance over 30 yrs
- Wildfire 1/10 Low
- Heat 6/10 Major 7 d/yr ≥101°F today · 15 d/yr by 30 yrs out
- Wind 3/10 Moderate 5% chance of damaging wind over 30 yrs
- Air quality 2/10 Low 1 unhealthy d/yr today · 3 by 30 yrs out
Nearby sold comps map
Loading sold comps map…
Walkable amenities ~0.75 mi
Loading nearby amenities…
Taxation est. · year 1
- Rental income
- $23,900
- − Mortgage interest
- −$7,842
- − Property taxes
- −$1,993
- − Insurance
- −$700
- − Repairs & maintenance
- −$1,912
- − Management
- −$1,912
- − Depreciation
- −$4,073
- Taxable income
- $5,469
- Est. tax owed @ 24.0%
- −$1,312
- After-tax cash flow
- $6,066/yr
For passive investors: Depreciation is non-cash, so a rental often shows a tax loss while cash-flowing — sheltering income. Rental losses are passive: they offset passive income freely, and up to $25,000/yr can offset ordinary (W-2) income if you actively participate and your MAGI is under $100k (phasing out to $0 by $150k); unused losses carry forward. On sale, claimed depreciation is recaptured at up to 25%, and gains may owe capital-gains tax (a 1031 exchange can defer both). Figures are a year-1 estimate at your 24.0% rate — not tax advice; consult a CPA.
Schools (NCES district)
- District
- Harrisburg City SD
- NCES district ID
- 4211580
- Math proficiency
- 6% ▼ -6.00%
- Reading proficiency
- 13% ▼ -10.00%
- Median HH income
- $33,432
- Composite
- 7.6/100
- National rank
- #9945
- State rank
- #535 of 539 in PA
Livability — Harrisburg
- Score
- 84/100
- State rank
- #107
- US rank
- #826
Category grades
Schools grade is shown separately in the Schools card above.
Census & demographics
- Census place
- Harrisburg, PA
- County
- Dauphin County · 247,857 people
- City population
- 184,296
- Metro
- Harrisburg-Carlisle, PA
- Population (ZIP)
- 27,364
- Household income
- $80,699
- Rent vs Own
- Severe rent burden
- 1037.0
Population outlook (Dauphin County) Hauer SSP2
- Today (2025)
- 281,628 people
- By 2030
- 283,549 · +0.7%
- By 2040
- 285,385 · +1.3%
- By 2050
- 286,188 · +1.6%
- By 2075
- 291,053 · +3.3%
- By 2100
- 282,374 · +0.3%
Race, ethnicity, and origin ACS 2023
- Neighborhood character
- Diverse neighborhood (Simpson 0.66)
- Race & ethnicity
- White 47% Black 32% Hispanic / Latino 9% Asian 7% Two or more races 6%
- Hispanic origin (detail)
- Puerto Rican 6% Dominican 1%
- Common ancestry
- Italian 3% Romanian 2% Slovak 1%
- Foreign-born
- 8% · Canada, India, Vietnam
- Languages at home
- 88% English-only · Spanish 6% Other Indo-European 2% Vietnamese 1%
Political lean MEDSL · Dauphin
- 2024 margin
- Lean D (+5.9) · D 52.4% · R 46.5% · Other 1.1%
- 2008→2024 swing
- -3.1pp toward R · 2008: 9.1pp · 2024: 5.9pp
- All cycles
- 2024: D+5.9 2020: D+8.5 2016: D+2.8 2012: D+6.0 2008: D+9.1
Not yet ingested
- Civics
- —
Market trends
- HPI YoY
- ▼ -144.07%
- Current HPI
- 257.826
- Rent YoY
- ▲ 1.55%
- Metro
- Harrisburg-Carlisle, PA
- State GDP YoY
- ▲ 1.68%
- F500 in state
- 34
Industry mix (Fortune 500 HQ in PA)
| Industry | F500 HQs | Revenue |
|---|---|---|
| Healthcare | 2 | $309B |
|
||
| Insurance | 2 | $27B |
|
||
| Telecommunications / Media | 1 | $124B |
|
||
| Industrial Distribution | 1 | $22B |
|
||
| Financial Services | 1 | $20B |
|
||
| Chemicals / Materials | 1 | $18B |
|
||
Price history
+10360.3% since first listed6 events — show timeline
- 2026-06-09 Sold (Public Records) $125,000 Public Records
- 2026-06-01 Sold (MLS) $125,000 BRIGHT MLS
- 2026-05-03 Pending — BRIGHT MLS
- 2026-04-26 Listed $140,000 BRIGHT MLS
- 2025-01-13 Rental Removed $1,195 SHOWMOJO
- 2024-12-21 Listed for Rent $1,195 SHOWMOJO
Property tax history
+1.0%/yrLatest (2026): $1,993 · +1.6% YoY. Source: county tax records.
Cash-flow waterfall
monthlySold comps — $/sqft
last 12 mo · ≤1 miLoading sold comps…