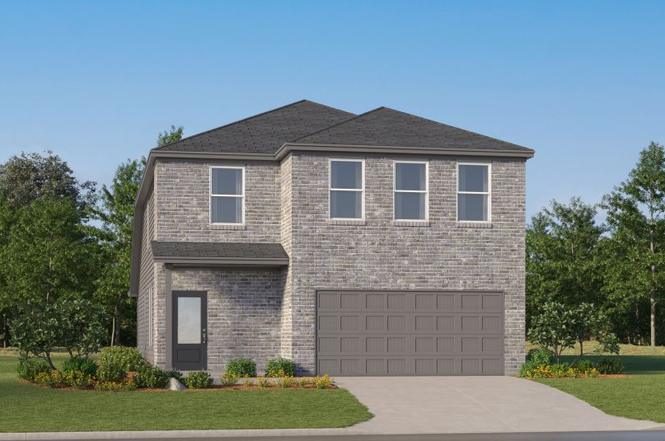
274 Inyo St · New Braunfels, TX
Flood risk No data
- FEMA flood zone
- —
- Chance of flooding over 30 yrs
- —
- Est. flood insurance / yr
- —
Fire risk No data
- Est. fire insurance / yr
- —
Heat risk No data
- Hot days now (above threshold)
- —
- Hot days in 30 yrs
- —
Wind risk No data
- Chance of severe wind over 30 yrs
- —
Air-quality risk No data
- Unhealthy air days now
- —
- Unhealthy air days in 30 yrs
- —
Risk factors via First Street. Map © Google.
Why this score? — see what drove the D grade
The composite is a weighted blend of 9 inputs, each scored 0–100. Each bar is that input's sub-score; the figure is the points it added to the 100-point composite (weight × sub-score).
- Cash flow +12.5/30.0
- ARV discount +8.9/15.0
- Schools +5.2/10.0
- Condition / age +4.8/5.0
- Livability +4.2/5.0
- DSCR +3.7/10.0
- 1% rule +3.6/10.0
- Rent growth +2.0/5.0
- Appreciation +0.0/10.0
$311,999
🖨 Deal sheet (PDF) 📄 Offer letter ✓ Due diligence
Listing remarks
This new two-story home is host to an inviting open-concept layout on the first floor, featuring access to a covered patio for optimal entertaining and multitasking. Two bedrooms are tucked away to the side of the home, including the luxe owner's suite with a full bathroom and walk-in closet. A versatile game room shares the second floor with three additional bedrooms.
Key facts
- Luxe owner's suite
- Full bathroom
- Walk-in closet
Tags
Property features AI
Finance
- Financial info: List price $311,499
Exterior
- Parking: 2 garage spaces (2 total parking spaces)
- Home design: Single-family home; Active listing
- Exterior features: Address: 274 Inyo St, New Braunfels, TX 78130
Interior
- Bedrooms: 5 bedrooms
- Bathrooms: 3 full bathrooms
- Interior features: Spec home, Santo plan; Open living area (2,516 total living area)
Neighborhood map
What this means for you Summary
Snapshot
- This is a 5-bed/3.0-bath single-family listed at $312k. Condition is rated excellent.
Deal economics
- At list price, monthly cash flow is $-45 ($-541/yr) — negative.
- To cash-flow at today's rent, offer at most $305k (2.1% below list).
- To meet the 1% rule (rent ≥ 1% of price), the offer needs to be $267k (14.4% below list).
- Recommended offer: $267k (14.4% below list) — sets the bar for 1% rule.
- Cap rate 6.1% vs local median 3.3% in New Braunfels — top-decile yield for the area; either an underpriced asset or a hidden risk that comps aren't pricing in. Stress-test before assuming the spread holds.
Location & tenants
- Location reads 83/100 on livability (#9 in TX, #925 nationally) — a professional / high-income tenant draw. Strengths: amenities A+, housing A+, health & safety A+; Watch: commute F.
- Comal ISD (rural): math 57% / reading 59% proficiency, ranked #58 of 826 in TX (top 7%) — acceptable for families but not a draw, mixed tenant base, ~2y average lease.
- Zoned schools: Oak Creek El (math 53% / reading 57%, grade C, #602 of 4,322 statewide, top 14%, 765 students, 37% FRL); Church Hill Middle (math 64% / reading 60%, grade B+, #134 of 1,662 statewide, top 8%, 748 students, 29% FRL); Canyon H S (math 59% / reading 65%, grade B-, #237 of 1,632 statewide, top 16%, 2,348 students, 35% FRL) — zoned schools at 34% FRL track the district average.
- Market conditions: Rents soft (-2.0%/yr); 1931 active listings in the ZIP; 9 comparable units currently listed for rent nearby; rentals at typical pace (median 26d on market — plan ~3-4 weeks tenant-placement turnaround); 44% of comp listings sitting > 30 days — soft ceiling on asking rent; solid renter incomes; 3,420 units permitted in Comal County in 2024 (1,164 in 5+ unit buildings).
- This rent runs 39% of the median local income ($83k/yr) — at the standard rent-burdened threshold; future hikes will face affordability resistance.
Forward outlook
- Local home prices are declining (-3.0%/yr); year-one equity from $2k of loan paydown is wiped out by about $9k of value loss. Plan a longer hold.
- Comal County population projected at +70% by 2050 — long-run rental-demand tailwind backs the buy-and-hold thesis.
Negotiation context
- Only 11 days on market — expect competitive offers; lowballing is unlikely to land.
Questions for the listing agent
- What do current leases actually rent for vs. the listed asking? Can we see a recent rent roll and the last 12 months of T-12 income?
- Is there a deadline driving the sale (1031 exchange, divorce, estate, relocation)? That informs how much negotiation room exists.
- Schools are B-rated — typically a magnet for longer-tenancy family renters. What's the average tenant stay here, and is there a school-zone premium baked into asking?
- The area grade is low — what's the realistic commute time and amenity access for the typical tenant pool here? Any planned neighborhood developments (good or bad) we should know about?
- What's the average days-on-market for RENTAL listings here right now (not sales)? A rising rental-DOM trend means longer vacancies and softer asking-rent achievability than the comps imply.
- What's the recent tenant-quality profile in this submarket — average credit score on applications, eviction rate, late-payment / NSF rate, and stable-employment percentage? A property-management company in the area should have these aggregated.
- How much new for-sale + rental construction is in the pipeline within 1–3 miles? Heavy new supply typically softens prices + rents 12–24 months out; constrained supply supports both.
Investment metrics
- 1% rule
- 0.86% ✗
- Cap rate
- 6.12%
- Cash-on-cash
- -0.62%
- DSCR
- 0.97
- GRM
- 9.7
CMA / ARV
- ARV (on-the-fly)
- $322,048
- Comps found
- 12
Show comp detail 12 sales within ~0.75 mi
| Address | Dist | Beds/Ba | Sqft | Sold | Price | $/sf | Match |
|---|---|---|---|---|---|---|---|
| 241 Inyo St | 0.07mi | 4/3.0 (-1) | 2,288 (-9%) | 1mo | $287,999 | $126 | 76 |
| 213 Inyo St | 0.12mi | 4/3.0 (-1) | 2,288 (-9%) | 2mo | $268,999 | $118 | 73 |
| 4008 Shaw Tree | 0.22mi | 4/3.0 (-1) | 2,288 (-9%) | 1mo | $291,999 | $128 | 69 |
| 277 Inyo St | 0.03mi | 4/3.5 (-1) | 2,149 (-15%) | 1mo | $272,999 | $127 | 67 |
| 257 Inyo St | 0.04mi | 4/3.5 (-1) | 2,149 (-15%) | 1mo | $269,999 | $126 | 66 |
| 217 Inyo St | 0.11mi | 4/3.5 (-1) | 2,149 (-15%) | 2mo | $253,999 | $118 | 62 |
| 3613 Black Cloud Dr | 0.72mi | 5/3.0 | 2,582 (+3%) | 1mo | $380,000 | $147 | 61 |
| 302 Tahoe Ave | 0.17mi | 4/2.5 (-1) | 2,173 (-14%) | 5mo | $251,999 | $116 | 58 |
| 256 Flathead | 0.14mi | 4/3.5 (-1) | 2,149 (-15%) | 6mo | $273,999 | $128 | 57 |
| 292 Flathead | 0.12mi | 4/3.5 (-1) | 2,149 (-15%) | 7mo | $281,999 | $131 | 57 |
| 4052 Shaw Tree | 0.24mi | 4/3.5 (-1) | 2,149 (-15%) | 5mo | $287,999 | $134 | 54 |
| 754 Cumulus Cloud Dr | 0.60mi | 4/3.5 (-1) | 2,742 (+9%) | 1mo | $419,990 | $153 | 49 |
Match score weights: distance 35% · size 25% · config 20% · recency 20%. Top-matched comps best support the ARV.
Projected returns pro-forma
-3.0% appreciation · 0.0% rent growth · sell at horizon
- IRR
- -20.7%
- Equity multiple
- 0.30×
- Total profit
- $-61,222
- Equity at exit
- $46,520
- IRR
- -22.8%
- Equity multiple
- 0.00×
- Total profit
- $-87,111
- Equity at exit
- $26,976
Cash invested: $87,360 (down + closing). Projections, not guarantees.
Landlord ↔ Tenant lean methodology
- Overall (STATE)
- 87 Strongly Landlord-Friendly
- State Texas
- 87 Strongly Landlord-Friendly · R+5
- County
- — inherits STATE
- City
- — inherits STATE
ZIP-level market 78130
- Rents YoY
- -2.0%
- Active inventory
- 1931
- Price-to-rent
- 9.7×
Monthly cashflow live
- Estimated rent
- $2,672 high interval (Pro) →
- Mortgage (P&I)
- −$1,636
- Tax est. 1.5%
- −$390 /mo · $4,680/yr
- Insurance
- −$130
- HOA
- −$0
- Vacancy / Maint / Mgmt
- −$561
- Net cashflow
- $-45
Break-even live
Sensitivity live
| Price | -10% $170 | -5% $63 | +0% $-45 | +5% $-153 | +10% $-261 |
|---|---|---|---|---|---|
| Rent | -10% $-256 | -5% $-151 | +0% $-45 | +5% $60 | +10% $166 |
| Rate | -1.0pp $112 | -0.5pp $34 | base $-45 | +0.5pp $-126 | +1.0pp $-208 |
UW: 25.0% down · 7.5% · 30yr · 1.5% tax · 5.0% vac · 8.0% maint · 8.0% mgmt
Financing live
Cash to close
- Down payment
- $78,000
- Closing costs
- $9,360
- Reserves months
- —
- Total cash needed
- —
Loan-product check · same deal, 3 products live
Conventional
25% down · 7.5% · 30yr
- Down + closing
- —
- Monthly P&I
- —
- Monthly cashflow
- —
- DSCR
- —
- Eligible?
- —
Personal DTI + credit; lowest rate.
DSCR
20% down · 8.5% · 30yr
- Down + closing
- —
- Monthly P&I
- —
- Monthly cashflow
- —
- DSCR
- —
- Eligible?
- —
No personal income docs; deal must DSCR.
Hard money
10% down · 12.0% · 12mo
- Down + closing
- —
- Monthly P&I
- —
- Monthly cashflow
- —
- DSCR
- —
- Eligible?
- —
Short-term bridge; refi at stabilization.
Rent comps 9 comps
| Address | Beds | Baths | Sqft | Rent | $/sqft | DOM | Units | Dist |
|---|---|---|---|---|---|---|---|---|
| 129 Radnor Rd New Braunfels, TX | 4.0 | 4.0 | 2800 | $2,800 | $1.00 | 45d | 1 | 0.53mi |
| 3629 Blue Cloud Dr New Braunfels, TX | 4.0 | 2.0 | 1877 | $2,295 | $1.22 | 16d | 1 | 0.58mi |
| 5958 Edna Pt New Braunfels, TX | 4.0 | 3.5 | 2515 | $2,650 | $1.05 | 45d | 1 | 0.65mi |
| 316 Hulda Trl New Braunfels, TX | 4.0 | 3.0 | 2426 | $3,000 | $1.24 | 12d | 1 | 0.79mi |
| 1233 Fox Wing Way New Braunfels, TX | 4.0 | 3.0 | 2377 | $2,750 | $1.16 | 6d | 1 | 1.06mi |
| 364 Starling Crk New Braunfels, TX | 4.0 | 2.5 | 2477 | $2,175 | $0.88 | 25d | 1 | 1.15mi |
| 240 Oak Creek Way New Braunfels, TX | 4.0 | 2.5 | 2267 | $2,395 | $1.06 | 25d | 1 | 1.27mi |
| 5862 Hopper Ct New Braunfels, TX | 5.0 | 3.0 | 3099 | $3,500 | $1.13 | 45d | 1 | 1.30mi |
| 105 Sky Country Dr New Braunfels, TX | 4.0 | 2.0 | 1895 | $4,300 | $2.27 | 45d | 1 | 1.31mi |
Listing history 7 events
-
2026-06-21days on market $311,999 Active 11 DOM
-
2026-06-18days on market $311,999 Active 8 DOM
-
2026-06-17days on market $311,999 Active 7 DOM
-
2026-06-16days on market $311,999 Active 6 DOM
-
2026-06-15pricedays on market $311,999 Active 5 DOM
-
2026-06-13remarks 371-char remark
-
2026-06-13$311,499 Active 3 DOM
ⓘ Source: listings_history table (triggers on properties + properties_extension) + one-shot
backfill from property_details.listing_events for pre-trigger history.
Nearby sold comps map
Loading sold comps map…
Walkable amenities ~0.75 mi
Loading nearby amenities…
Taxation est. · year 1
- Rental income
- $32,066
- − Mortgage interest
- −$17,477
- − Property taxes
- −$4,680
- − Insurance
- −$1,560
- − Repairs & maintenance
- −$2,565
- − Management
- −$2,565
- − Depreciation
- −$9,076
- Taxable loss
- −$5,857
- Est. tax savings @ 24.0%
- +$1,406
- After-tax cash flow
- $864/yr
For passive investors: Depreciation is non-cash, so a rental often shows a tax loss while cash-flowing — sheltering income. Rental losses are passive: they offset passive income freely, and up to $25,000/yr can offset ordinary (W-2) income if you actively participate and your MAGI is under $100k (phasing out to $0 by $150k); unused losses carry forward. On sale, claimed depreciation is recaptured at up to 25%, and gains may owe capital-gains tax (a 1031 exchange can defer both). Figures are a year-1 estimate at your 24.0% rate — not tax advice; consult a CPA.
Condition & rehab AI · 13 photos
This two-story home is in excellent condition with a modern and well-maintained interior and exterior. It offers a great opportunity for a potential buyer or investor looking for a move-in-ready property.
Value-add opportunities
- Both Painting the exterior brick and updating landscaping — Enhances curb appeal and adds value for both resale and rental.
- Resale Updating the kitchen backsplash — Modernizes the kitchen and adds visual interest.
- Both Installing smart home technology — Improves convenience and adds value for both resale and rental.
Renovation cost estimate screening
Value-add ROI direction
- Both Painting the exterior brick and updating landscaping — Enhances curb appeal and adds value for both resale and rental. ↑
- Resale Updating the kitchen backsplash — Modernizes the kitchen and adds visual interest. ↑
- Both Installing smart home technology — Improves convenience and adds value for both resale and rental. ↑
ⓘ Cost ranges are severity-bucket heuristics (US national rule-of-thumb). Get contractor quotes + a written scope before underwriting a rehab budget.
Schools (NCES district)
- District
- Comal ISD
- NCES district ID
- 4814730
- Math proficiency
- 57% ▼ -9.00%
- Reading proficiency
- 59% ▼ -2.00%
- Median HH income
- $74,792
- Composite
- 51.79/100
- National rank
- #1671
- State rank
- #58 of 826 in TX
Livability — New Braunfels
- Score
- 83/100
- State rank
- #9
- US rank
- #925
Category grades
Schools grade is shown separately in the Schools card above.
Census & demographics
- County
- Comal County · 206,262 people
- City population
- 144,962
- Metro
- San Antonio-New Braunfels, TX
- Population (ZIP)
- 104,009
- Household income
- $83,064
- Rent vs Own
- Severe rent burden
- 2912.0
Population outlook (Comal County) Hauer SSP2
- Today (2025)
- 175,637 people
- By 2030
- 199,911 · +13.8%
- By 2040
- 249,436 · +42.0%
- By 2050
- 299,430 · +70.5%
- By 2075
- 423,857 · +141.3%
- By 2100
- 512,048 · +191.5%
Race, ethnicity, and origin ACS 2023
- Neighborhood character
- Majority White (58%)
- Race & ethnicity
- White 58% Hispanic / Latino 37% Two or more races 19% Black 2%
- Hispanic origin (detail)
- Mexican 32%
- Common ancestry
- Romanian 2% Lithuanian 2% Slovak 2%
- Foreign-born
- 7% · Canada
- Languages at home
- 78% English-only · Spanish 20% German/W. Germanic 1%
Political lean MEDSL · Comal
- 2024 margin
- Solid R (+45.5) · D 26.8% · R 72.2%
- 2008→2024 swing
- +1.9pp toward D · 2008: -47.4pp · 2024: -45.5pp
- All cycles
- 2024: R+45.5 2020: R+42.7 2016: R+50.1 2012: R+54.1 2008: R+47.4
Not yet ingested
- Civics
- —
Market trends
- HPI YoY
- ▼ -190.61%
- Current HPI
- 173.7128
- Rent YoY
- ▼ -1.97%
- Metro
- San Antonio-New Braunfels, TX
- State GDP YoY
- ▲ 3.95%
- F500 in state
- 110
Industry mix (Fortune 500 HQ in TX)
| Industry | F500 HQs | Revenue |
|---|---|---|
| Energy | 16 | $1,198B |
|
||
| Technology | 5 | $198B |
|
||
| Engineering / Construction | 4 | $72B |
|
||
| Energy Services | 3 | $60B |
|
||
| Utilities | 3 | $41B |
|
||
| Healthcare | 2 | $330B |
|
||
Cash-flow waterfall
monthlySold comps — $/sqft
last 12 mo · ≤1 miLoading sold comps…