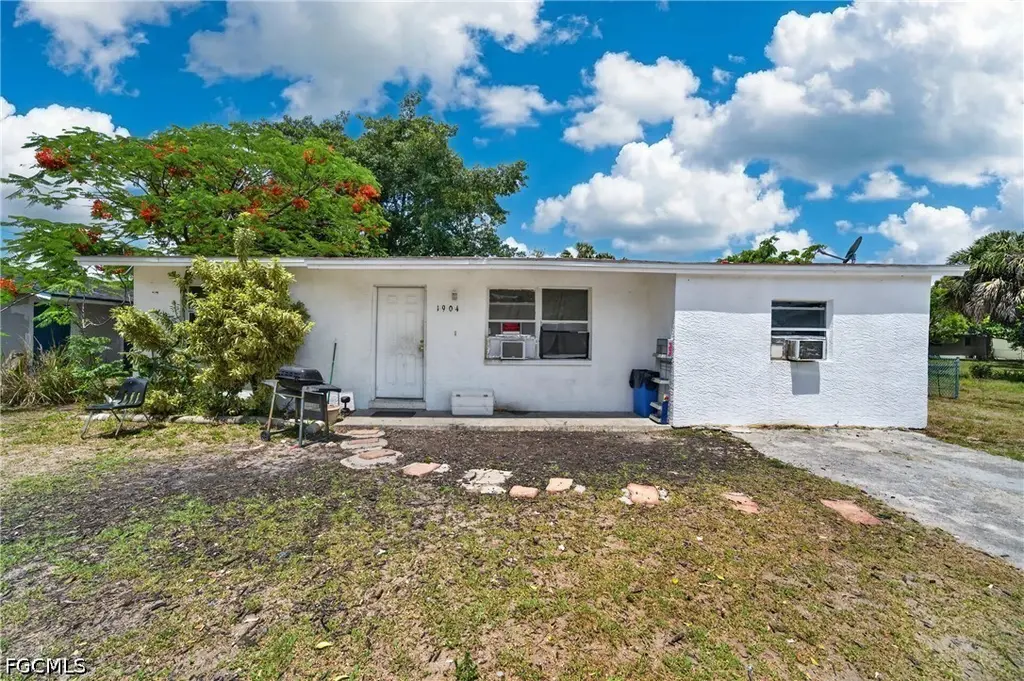
1904 Fountain St · Fort Myers, FL
Flood risk 1/10 · Minimal
- FEMA flood zone
- X (unshaded)
- Chance of flooding over 30 yrs
- 0.0%
- Est. flood insurance / yr
- $507 – $1,088
Fire risk 1/10 · Minimal
- Est. fire insurance / yr
- $947 – $1,759
Heat risk 10/10 · Severe
- Hot days now (above 107°F)
- 7 days/yr
- Hot days in 30 yrs
- 30 days/yr
Wind risk 10/10 · Severe
- Chance of severe wind over 30 yrs
- 99.0%
Air-quality risk 2/10 · Minimal
- Unhealthy air days now
- 1 days/yr
- Unhealthy air days in 30 yrs
- 1 days/yr
Risk factors via First Street. Map © Google.
Why this score? — see what drove the C grade
The composite is a weighted blend of 9 inputs, each scored 0–100. Each bar is that input's sub-score; the figure is the points it added to the 100-point composite (weight × sub-score).
- Cash flow +23.8/30.0
- ARV discount +8.3/15.0
- DSCR +7.6/10.0
- 1% rule +6.3/10.0
- Livability +4.3/5.0
- Schools +4.1/10.0
- Condition / age +2.5/5.0
- Rent growth +1.4/5.0
- Appreciation +0.0/10.0
$165,000
🖨 Deal sheet 📄 Offer letter ✓ Due diligence
Listing remarks MLS
Nice Property for 1st home or investment. In great condition other than cosmetics. Needs paint inside. Newer AC and Newer Roof. Garage is now the 3rd bedroom.
Key facts
- 6,838 sq ft lot
- Parking
- Built 1972
Property features AI
Finance
- Financial info: Pets allowed
- HOA & community: No association fee; Non-gated community
Exterior
- Parking: Driveway; Paved parking
- Utilities: Cable available; Public water; Public sewer
- Home design: Single-story; Resale property; Entry level: 0; Faces east; Exposure to the west on the lot
- Construction: Block, concrete and stucco construction; Shingle roof; Rectangular lot; Lot dimensions approx. 70 x 98
- Exterior features: Fence; Room for pool; Paved road
Interior
- Kitchen: Dishwasher; Range; Refrigerator
- Bedrooms: Bedroom on main level
- Flooring: Tile
- Bathrooms: 1 full bathroom
- Heating & cooling: Central heating (electric); Central air conditioning; Ceiling fans
- Interior features: Built-in features; Living/dining room; Main-level primary; Split bedrooms; Tub/shower; Single-hung windows; Unfurnished
Neighborhood map
What this means for you Summary
Snapshot
- This is a 3-bed/1.0-bath single-family listed at $165k.
Deal economics
- At list price, monthly cash flow is $316 ($4k/yr) — positive.
- The deal already cash-flows at list — no discount required.
- Meets the 1% rule at list price ($2k rent vs $165k).
- Recommended offer: $163k (1.5% below list) — sets the bar for market timing.
- Cap rate 8.6% vs local median 3.0% in Fort Myers — top-decile yield for the area; either an underpriced asset or a hidden risk that comps aren't pricing in. Stress-test before assuming the spread holds.
Location & tenants
- Location reads 86/100 on livability (#14 in FL, #383 nationally) — a professional / high-income tenant draw. Strengths: amenities A+, commute A+, housing A+.
- Lee (suburban): math 47% / reading 50% proficiency, ranked #42 of 73 in FL (top 58%) — families likely to look elsewhere, expect single-tenant / working-renter base with shorter leases.
- Market conditions: Rents falling (-4.3%/yr); 267 active listings in the ZIP; 40 comparable units currently listed for rent nearby; rentals at typical pace (median 21d on market — plan ~3-4 weeks tenant-placement turnaround); 15,411 units permitted in Lee County in 2024 (4,686 in 5+ unit buildings).
- This rent runs 42% of the median local income ($53k/yr) — at the standard rent-burdened threshold; future hikes will face affordability resistance.
Forward outlook
- Local home prices are declining (-3.0%/yr); year-one equity from $1k of loan paydown is wiped out by about $5k of value loss. Plan a longer hold.
- Lee County population projected at +44% by 2050 — long-run rental-demand tailwind backs the buy-and-hold thesis.
Negotiation context
- It's been on market 29 days — a 2% lower offer ($163k) is reasonable based on typical stale-listing flexibility.
- 2 sale attempts since 17y ago with the ask held roughly flat each time — persistent listings suggest the price (not the market) is what's stuck; bring a comps-based counter.
- Current owner paid $81k; list at $165k implies a 104% gain — meaningful room to come down on a strong offer.
Risks & watch-outs
- Climate carrying-cost: severe wind risk, 99% chance of damaging wind over 30y; extreme-heat days projected 7→30/yr by 2055 (HVAC capex compounding) — expect insurance premiums to compound above CPI over the hold.
Questions for the listing agent
- Built in 1972 — when were the roof, HVAC, electrical panel, plumbing, and water heater last replaced?
- Is there a deadline driving the sale (1031 exchange, divorce, estate, relocation)? That informs how much negotiation room exists.
- What's the average days-on-market for RENTAL listings here right now (not sales)? A rising rental-DOM trend means longer vacancies and softer asking-rent achievability than the comps imply.
- What's the recent tenant-quality profile in this submarket — average credit score on applications, eviction rate, late-payment / NSF rate, and stable-employment percentage? A property-management company in the area should have these aggregated.
- How much new for-sale + rental construction is in the pipeline within 1–3 miles? Heavy new supply typically softens prices + rents 12–24 months out; constrained supply supports both.
Investment metrics
- 1% rule
- 1.13% ✓
- Cap rate
- 8.59%
- Cash-on-cash
- 8.20%
- DSCR
- 1.36
- GRM
- 7.4
CMA / ARV
- ARV (on-the-fly)
- $168,147
- Comps found
- 6
Show comp detail 6 sales within ~0.75 mi
| Address | Dist | Beds/Ba | Sqft | Sold | Price | $/sf | Match |
|---|---|---|---|---|---|---|---|
| 1366 Brookhill Dr | 0.68mi | 3/2.0 | 1,092 (+2%) | 10mo | $65,000 | $60 | 53 |
| 2997 Price Ave | 0.41mi | 3/2.0 | 1,180 (+10%) | 9mo | $185,000 | $157 | 52 |
| 1543 Billie St | 0.57mi | 2/1.0 (-1) | 1,026 (-4%) | 16mo | $125,000 | $122 | 48 |
| 2152 Pauldo St | 0.51mi | 2/1.0 (-1) | 1,201 (+12%) | 8mo | $87,500 | $73 | 44 |
| 2775 Lime St | 0.68mi | 3/2.0 | 1,115 (+4%) | 17mo | $245,000 | $220 | 44 |
| 2836 Indian St | 0.62mi | 3/2.0 | 1,180 (+10%) | 17mo | $199,000 | $169 | 36 |
Match score weights: distance 35% · size 25% · config 20% · recency 20%. Top-matched comps best support the ARV.
Projected returns pro-forma
-3.0% appreciation · 0.0% rent growth · sell at horizon
- IRR
- -7.3%
- Equity multiple
- 0.74×
- Total profit
- $-12,050
- Equity at exit
- $24,602
- IRR
- -2.0%
- Equity multiple
- 0.88×
- Total profit
- $-5,537
- Equity at exit
- $14,266
Cash invested: $46,200 (down + closing). Projections, not guarantees.
Landlord ↔ Tenant lean methodology
- Overall (STATE)
- 87 Strongly Landlord-Friendly
- State Florida
- 87 Strongly Landlord-Friendly · R+3
- County
- — inherits STATE
- City
- — inherits STATE
ZIP-level market 33916
- Home prices YoY
- -28.2%
- Rents YoY
- -4.3%
- Active inventory
- 267
- Price-to-rent
- 7.4×
Monthly cashflow live
- Estimated rent
- $1,862 high interval (Pro) →
- Mortgage (P&I)
- −$865
- Tax from tax record
- −$221 /mo · $2,652/yr
- Insurance
- −$69
- HOA
- −$0
- Vacancy / Maint / Mgmt
- −$391
- Net cashflow
- $316
Break-even live
UW: 25.0% down · 7.5% · 30yr · 1.5% tax · 5.0% vac · 8.0% maint · 8.0% mgmt
Financing live
Cash to close
- Down payment
- $41,250
- Closing costs
- $4,950
- Reserves months
- —
- Total cash needed
- —
Loan-product check · same deal, 3 products live
Conventional
25% down · 7.5% · 30yr
- Down + closing
- —
- Monthly P&I
- —
- Monthly cashflow
- —
- DSCR
- —
- Eligible?
- —
Personal DTI + credit; lowest rate.
DSCR
20% down · 8.5% · 30yr
- Down + closing
- —
- Monthly P&I
- —
- Monthly cashflow
- —
- DSCR
- —
- Eligible?
- —
No personal income docs; deal must DSCR.
Hard money
10% down · 12.0% · 12mo
- Down + closing
- —
- Monthly P&I
- —
- Monthly cashflow
- —
- DSCR
- —
- Eligible?
- —
Short-term bridge; refi at stabilization.
Rent comps 40 comps
| Address | Beds | Baths | Sqft | Rent | $/sqft | DOM | Units | Dist |
|---|---|---|---|---|---|---|---|---|
| 3216 Dale St Fort Myers, FL | 2.0 | 1.0 | 886 | $1,650 | $1.86 | 3d | 1 | 0.13mi |
| 2103 French St Fort Myers, FL | 3.0 | 2.0 | 1100 | $1,800 | $1.64 | 1d | 1 | 0.21mi |
| 2103 French St Fort Myers, FL | 3.0 | 2.0 | 1100 | $1,900 | $1.73 | 23d | 1 | 0.21mi |
| 2103 French St Fort Myers, FL | 3.0 | 2.0 | 1100 | $1,800 | $1.64 | 2d | 1 | 0.21mi |
| 2103 French St Unit 2 Fort Myers, FL | 3.0 | 2.0 | 1100 | $1,800 | $1.64 | 23d | 1 | 0.21mi |
| 2225 Carver Ave Fort Myers, FL | 3.0 | 2.0 | 1193 | $2,200 | $1.84 | 23d | 1 | 0.33mi |
| 4051 Regata Way Fort Myers, FL | 1.0–3.0 | 1.0–2.0 | 987 | $2,021 | $2.05 | 2d | 34 | 0.33mi |
| 3040 Douglas Ave Unit 3042 Fort Myers, FL | 2.0 | 1.0 | 800 | $1,150 | $1.44 | 2d | 1 | 0.33mi |
| 3034 Price Ave Fort Myers, FL | 3.0 | 2.0 | 1367 | $2,100 | $1.54 | 3d | 1 | 0.37mi |
| 3323 Michigan Ave Fort Myers, FL | 3.0 | 2.0 | 1029 | $1,600 | $1.55 | 21d | 1 | 0.39mi |
| 2218 Quality Life Center Way Fort Myers, FL | 4.0 | 2.0 | 1257 | $2,250 | $1.79 | 23d | 1 | 0.39mi |
| 1919 Lillie St Unit H Fort Myers, FL | 2.0 | 1.0 | 829 | $1,400 | $1.69 | 23d | 1 | 0.43mi |
| 1919 Lillie St Unit F Fort Myers, FL | 2.0 | 1.0 | 829 | $1,400 | $1.69 | 16d | 1 | 0.43mi |
| 2147 Pauldo St Fort Myers, FL | 3.0 | 2.0 | 1088 | $1,395 | $1.28 | 23d | 1 | 0.49mi |
| 3306 Bassie Ct Fort Myers, FL | 4.0 | 2.0 | 1257 | $2,100 | $1.67 | 23d | 1 | 0.50mi |
| 2987 Thomas St Fort Myers, FL | 3.0 | 2.0 | 1200 | $2,100 | $1.75 | 21d | 1 | 0.52mi |
| 1759 Aquarius Ct Fort Myers, FL | 2.0 | 1.0 | 800 | $1,400 | $1.75 | 14d | 1 | 0.53mi |
| 1759 Aquarius Ct Fort Myers, FL | 2.0 | 1.0 | 800 | $1,400 | $1.75 | 3d | 1 | 0.53mi |
| 2955 Dunbar St Unit A Fort Myers, FL | 3.0 | 2.0 | 1285 | $2,300 | $1.79 | 16d | 1 | 0.53mi |
| 2955 Dunbar St Unit A Fort Myers, FL | 3.0 | 2.0 | 1111 | $2,300 | $2.07 | 3d | 1 | 0.53mi |
| 2132 Barker Blvd Fort Myers, FL | 4.0 | 2.0 | 1367 | $2,600 | $1.90 | 23d | 1 | 0.54mi |
| 2188 Barker Blvd Fort Myers, FL | 4.0 | 2.0 | 1367 | $2,600 | $1.90 | 23d | 1 | 0.58mi |
| 3141 Edison Ave Fort Myers, FL | 4.0 | 1.0 | 1136 | $1,500 | $1.32 | 23d | 1 | 0.64mi |
| 2197 Davis Ct Fort Myers, FL | 4.0 | 2.0 | 1257 | $2,450 | $1.95 | 2d | 1 | 0.65mi |
| 1775 Glenway Ct Fort Myers, FL | 4.0 | 2.0 | 1367 | $2,600 | $1.90 | 23d | 1 | 0.66mi |
| 3341 Willard St Fort Myers, FL | 4.0 | 2.0 | 1257 | $2,500 | $1.99 | 16d | 1 | 0.68mi |
| 1270 Allen St Unit B Fort Myers, FL | 3.0 | 2.0 | 1085 | $1,700 | $1.57 | 23d | 1 | 0.75mi |
| 2656 Lime St Fort Myers, FL | 4.0 | 2.0 | 1232 | $1,700 | $1.38 | 3d | 1 | 0.81mi |
| 216 Maria St Fort Myers, FL | 3.0 | 1.0 | 864 | $1,600 | $1.85 | 23d | 1 | 0.84mi |
| 3417 South St Fort Myers, FL | 3.0 | 2.0 | 1008 | $1,695 | $1.68 | 23d | 1 | 0.87mi |
| 3425 South St Fort Myers, FL | 3.0 | 1.0 | 1132 | $1,395 | $1.23 | 3d | 1 | 0.88mi |
| 221 Maria St Unit 225 Fort Myers, FL | 2.0 | 1.0 | 720 | $1,095 | $1.52 | 23d | 1 | 0.88mi |
| 227 Maria St Fort Myers, FL | 2.0 | 1.0 | 720 | $1,095 | $1.52 | 23d | 1 | 0.89mi |
| 2651 Market St Fort Myers, FL | 3.0 | 2.0 | 1184 | $1,295 | $1.09 | 23d | 1 | 0.91mi |
| 2649 Market St Unit 2651 Fort Myers, FL | 3.0 | 2.0 | 1184 | $1,250 | $1.06 | 19d | 1 | 0.91mi |
| 2825 Palm Beach Blvd Fort Myers, FL | 1.0–3.0 | 1.5–2.5 | 990 | $2,200 | $2.22 | 10d | 7 | 0.92mi |
| 2885 Palm Beach Blvd #408 Fort Myers, FL | 2.0 | 2.0 | 835 | $1,675 | $2.01 | 23d | 1 | 0.92mi |
| 2885 Palm Beach Blvd #301 Fort Myers, FL | 2.0 | 2.0 | 835 | $1,650 | $1.98 | 13d | 1 | 0.92mi |
| 2885 Palm Beach Blvd #301 Fort Myers, FL | 2.0 | 2.0 | 835 | $1,650 | $1.98 | 14d | 1 | 0.92mi |
| 2885 Palm Beach Blvd #402 Fort Myers, FL | 2.0 | 2.0 | 938 | $1,850 | $1.97 | 14d | 1 | 0.92mi |
Listing history 24 events
-
2026-06-17days on market $165,000 Active 29 DOM
-
2026-06-16days on market $165,000 Active 28 DOM
-
2026-06-15days on market $165,000 Active 27 DOM
-
2026-06-13days on market $165,000 Active 25 DOM
-
2026-06-10days on market $165,000 Active 22 DOM
-
2026-06-09days on market $165,000 Active 21 DOM
-
2026-06-08days on market $165,000 Active 20 DOM
-
2026-06-07days on market $165,000 Active 19 DOM
-
2026-06-03days on market $165,000 Active 15 DOM
-
2026-06-02days on market $165,000 Active 14 DOM
-
2026-06-01days on market $165,000 Active 13 DOM
-
2026-05-31days on market $165,000 Active 12 DOM
-
2026-05-19$165,000 Active
-
2019-07-23soldstatus $81,000
-
2012-07-27soldstatus $33,000 158-char remark
Show marketing remark (158 chars)
Nice Property for 1st home or investment. In great condition other than cosmetics. Needs paint inside. Newer AC and Newer Roof. Garage is now the 3rd bedroom.
-
2012-07-17price $35,000 158-char remark
Show marketing remark (158 chars)
Nice Property for 1st home or investment. In great condition other than cosmetics. Needs paint inside. Newer AC and Newer Roof. Garage is now the 3rd bedroom.
-
2010-04-30soldstatus $14,995 144-char remark
Show marketing remark (144 chars)
two bed one bath converted to 3 bed 1 bath SHORT SALE needs appliance and TLC could make nice cash flow producing rental
-
2009-10-25$14,995 144-char remark
Show marketing remark (144 chars)
two bed one bath converted to 3 bed 1 bath SHORT SALE needs appliance and TLC could make nice cash flow producing rental
-
2006-05-22soldstatus $142,800
-
2006-04-25soldstatus $113,000
-
2004-08-24soldstatus $37,000
-
2004-07-27price $37,900
-
2000-06-06soldstatus $62,000
-
1999-11-17soldstatus $45,000
ⓘ Source: listings_history table (triggers on properties + properties_extension) + one-shot
backfill from property_details.listing_events for pre-trigger history.
Tax reassessment forecast FL · Resets to sale price
- Current annual tax
- $2,652 · $221/mo
- Projected year-2 tax
- $2,652 · $221/mo
- Expected delta
- $0/yr ($0/mo · 0.0%)
ⓘ Screening estimate from a state-policy table — verify with the county assessor before closing.
Climate risk First Street
- Flood 1/10 Low FEMA zone X (unshaded) · 0% chance over 30 yrs
- Wildfire 1/10 Low
- Heat 10/10 Extreme 7 d/yr ≥107°F today · 30 d/yr by 30 yrs out
- Wind 10/10 Extreme 99% chance of damaging wind over 30 yrs
- Air quality 2/10 Low 1 unhealthy d/yr today · 1 by 30 yrs out
Nearby sold comps map
Loading sold comps map…
Walkable amenities ~0.75 mi
Loading nearby amenities…
Taxation est. · year 1
- Rental income
- $22,340
- − Mortgage interest
- −$9,243
- − Property taxes
- −$2,652
- − Insurance
- −$825
- − Repairs & maintenance
- −$1,787
- − Management
- −$1,787
- − Depreciation
- −$4,800
- Taxable income
- $1,246
- Est. tax owed @ 24.0%
- −$299
- After-tax cash flow
- $3,489/yr
For passive investors: Depreciation is non-cash, so a rental often shows a tax loss while cash-flowing — sheltering income. Rental losses are passive: they offset passive income freely, and up to $25,000/yr can offset ordinary (W-2) income if you actively participate and your MAGI is under $100k (phasing out to $0 by $150k); unused losses carry forward. On sale, claimed depreciation is recaptured at up to 25%, and gains may owe capital-gains tax (a 1031 exchange can defer both). Figures are a year-1 estimate at your 24.0% rate — not tax advice; consult a CPA.
Schools (NCES district)
- District
- Lee
- NCES district ID
- 1201080
- Math proficiency
- 47% ▼ -11.00%
- Reading proficiency
- 50% ▼ -4.00%
- Median HH income
- $49,518
- Composite
- 41.49/100
- National rank
- #3458
- State rank
- #42 of 73 in FL
Livability — Fort Myers
- Score
- 86/100
- State rank
- #14
- US rank
- #383
Category grades
Schools grade is shown separately in the Schools card above.
Census & demographics
- Census place
- Fort Myers, FL
- County
- Lee County · 788,662 people
- City population
- 278,598
- Metro
- Cape Coral-Fort Myers, FL
- Population (ZIP)
- 27,943
- Household income
- $52,586
- Rent vs Own
- Severe rent burden
- 2324.0
Population outlook (Lee County) Hauer SSP2
- Today (2025)
- 871,946 people
- By 2030
- 955,468 · +9.6%
- By 2040
- 1,113,587 · +27.7%
- By 2050
- 1,256,891 · +44.1%
- By 2075
- 1,560,270 · +78.9%
- By 2100
- 1,726,848 · +98.0%
Race, ethnicity, and origin ACS 2023
- Neighborhood character
- Highly diverse neighborhood (Simpson 0.71)
- Race & ethnicity
- Black 34% Hispanic / Latino 30% White 28% Two or more races 21% Asian 2%
- Hispanic origin (detail)
- Mexican 5% Puerto Rican 6% Cuban 7% Dominican 1%
- Common ancestry
- Estonian 3% Hispanic 1% Romanian 1%
- Foreign-born
- 22% · Canada, Vietnam, China
- Languages at home
- 69% English-only · Spanish 24% Other Indo-European 4% French/Haitian/Cajun 1%
Political lean MEDSL · Lee
- 2024 margin
- Strong R (+28.4) · D 35.5% · R 63.9%
- 2008→2024 swing
- -18.0pp toward R · 2008: -10.4pp · 2024: -28.4pp
- All cycles
- 2024: R+28.4 2020: R+19.2 2016: R+20.4 2012: R+16.6 2008: R+10.4
Not yet ingested
- Civics
- —
Market trends
- HPI YoY
- ▼ -95.73%
- Current HPI
- 243.2657
- Rent YoY
- ▼ -4.30%
- Metro
- Cape Coral-Fort Myers, FL
- State GDP YoY
- ▲ 3.28%
- F500 in state
- 36
Industry mix (Fortune 500 HQ in FL)
| Industry | F500 HQs | Revenue |
|---|---|---|
| Industrial Technology | 2 | $29B |
|
||
| Insurance | 2 | $17B |
|
||
| Retail | 1 | $60B |
|
||
| Technology Distribution | 1 | $58B |
|
||
| Homebuilding | 1 | $35B |
|
||
| Technology Manufacturing | 1 | $35B |
|
||
Price history
+266.7% since first listed12 events — show timeline
- 2026-05-19 Listed $165,000 FORTMLS
- 2019-07-23 Sold (Public Records) $81,000 Public Records
- 2012-07-27 Sold (MLS) $33,000 FORTMLS
- 2012-07-17 Price Changed $35,000 FORTMLS
- 2010-04-30 Sold (MLS) $14,995 NAPLESMLS
- 2009-10-25 Listed $14,995 NAPLESMLS
- 2006-05-22 Sold (Public Records) $142,800 Public Records
- 2006-04-25 Sold (Public Records) $113,000 Public Records
- 2004-08-24 Sold (MLS) $37,000 FORTMLS
- 2004-07-27 Price Changed $37,900 FORTMLS
- 2000-06-06 Sold (Public Records) $62,000 Public Records
- 1999-11-17 Sold (Public Records) $45,000 Public Records
Property tax history
+11.0%/yrLatest (2025): $2,652 · +2.3% YoY. Source: county tax records.
Cash-flow waterfall
monthlySold comps — $/sqft
last 12 mo · ≤1 miLoading sold comps…