 Multi-family
15299 N US Hwy 441 · Reddick, FL
Flood risk 1/10 · Minimal
- FEMA flood zone
- X (unshaded)
- Chance of flooding over 30 yrs
- 0.0%
- Est. flood insurance / yr
- $507 – $1,088
Fire risk 6/10 · Moderate
- Est. fire insurance / yr
- $947 – $1,759
Heat risk 8/10 · Major
- Hot days now (above 107°F)
- 7 days/yr
- Hot days in 30 yrs
- 21 days/yr
Wind risk 9/10 · Severe
- Chance of severe wind over 30 yrs
- 99.0%
Air-quality risk 3/10 · Minor
- Unhealthy air days now
- 2 days/yr
- Unhealthy air days in 30 yrs
- 3 days/yr
Risk factors via First Street. Map © Google.
Why this score? — see what drove the D- grade
The composite is a weighted blend of 9 inputs, each scored 0–100. Each bar is that input's sub-score; the figure is the points it added to the 100-point composite (weight × sub-score).
- Cash flow +10.9/30.0
- ARV discount +7.5/15.0
- Schools +3.6/10.0
- DSCR +3.2/10.0
- Livability +2.9/5.0
- 1% rule +2.7/10.0
- Rent growth +2.5/5.0
- Condition / age +2.5/5.0
- Appreciation +0.0/10.0
$374,900
🖨 Deal sheet (PDF) 📄 Offer letter ✓ Due diligence
Multi-family units
County records classify this as Multi-Family (2-4 Unit). Listing-text estimate: 1 unit. estimate disagrees with records
Listing remarks MLS
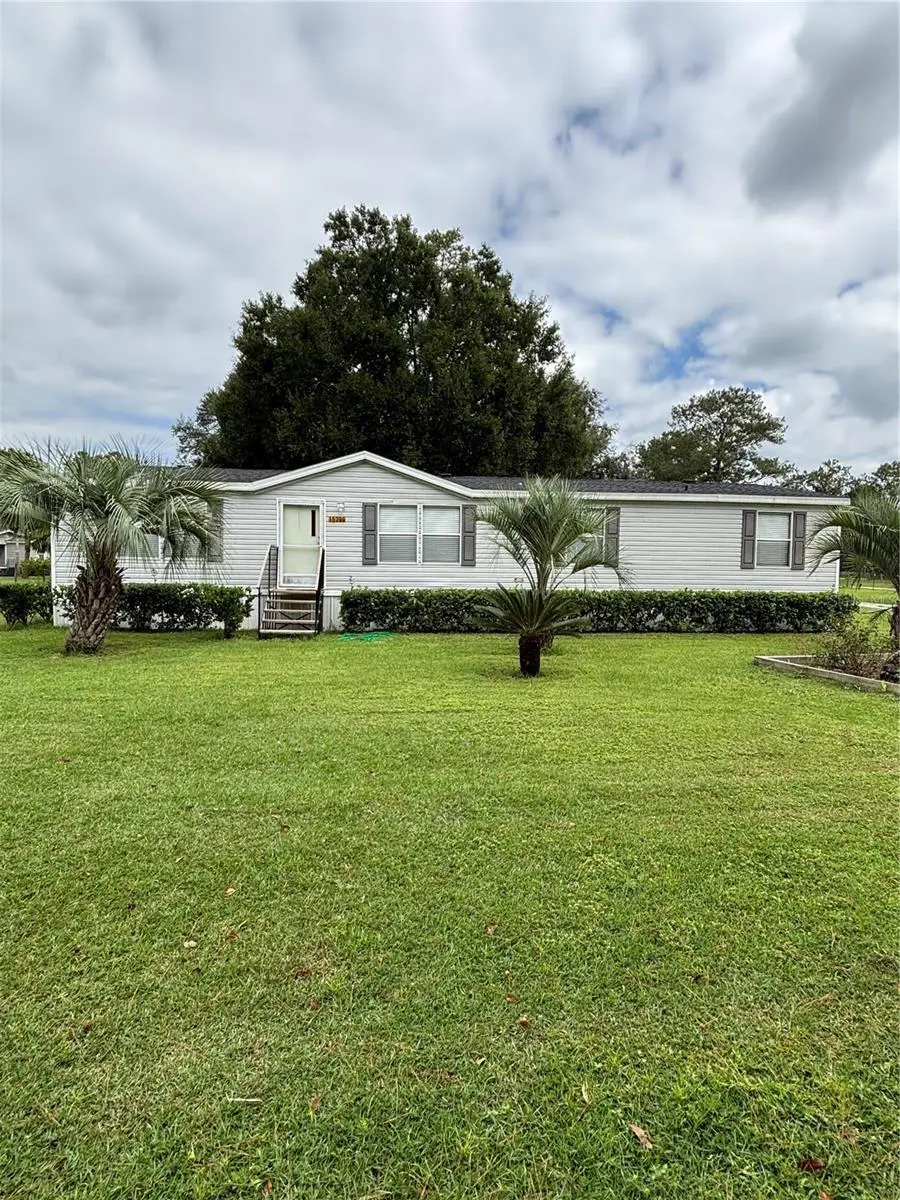
This Property has 2 Manufactured HOMES on 3 ACRES (4/2)Home & (3/2) Home. The Yard is Completely Fenced. This 4 BEDROOM 2 BATHROOM Home sits on 3 ACRES. The Home has a Large Kitchen and Dining Room area to enjoy family and friends. The Master Bedroom is located on the opposite side of the home. This Home has a Shed & Carport. The Living Room has lots of room to enjoy Family time together. TURNKEY Home. The 2nd Home 3 Bedroom 2 Bathroom sits back with Privacy from the other Home. This Home has been Completely Remodeled. The Both Homes are Occupied. Schedule a Showing Today!! Main Home Roof 2020 AC 2024
Key facts
- Shed
- Completely fenced
- Large kitchen
Tags
Neighborhood map
What this means for you Summary
Snapshot
- This is a 3-bed/2.0-bath multifamily listed at $375k.
Deal economics
- At list price, monthly cash flow is $-165 ($-2k/yr) — negative.
- To cash-flow at today's rent, offer at most $346k (7.8% below list).
- To meet the 1% rule (rent ≥ 1% of price), the offer needs to be $289k (23.0% below list).
- Recommended offer: $289k (23.0% below list) — sets the bar for 1% rule.
- Cap rate 5.8% vs local median 2.2% in Reddick — top-decile yield for the area; either an underpriced asset or a hidden risk that comps aren't pricing in. Stress-test before assuming the spread holds.
Location & tenants
- Location reads 58/100 on livability (#845 in FL) — a working-class tenant base; expect higher turnover. Strengths: cost of living A+, housing A+; Watch: crime D, amenities F, commute F.
- Marion (rural): math 42% / reading 43% proficiency, ranked #61 of 73 in FL (top 84%) — families likely to look elsewhere, expect single-tenant / working-renter base with shorter leases; 61% free/reduced lunch — lower-income household profile, screen leases tightly.
- Zoned schools: Reddick-Collier Elementary School (math 37% / reading 37%, grade F, #1,609 of 2,144 statewide, top 77%, 334 students, 67% FRL); North Marion Middle School (math 35% / reading 34%, grade F, #421 of 571 statewide, top 74%, 803 students, 72% FRL); North Marion High School (math 20% / reading 32%, grade F, #494 of 667 statewide, top 75%, 1,303 students, 66% FRL).
- Market conditions: 95 active listings in the ZIP; 7,071 units permitted in Marion County in 2024 (534 in 5+ unit buildings).
Forward outlook
- Local home prices are declining (-3.0%/yr); year-one equity from $3k of loan paydown is wiped out by about $11k of value loss. Plan a longer hold.
- Marion County population projected at +13% by 2050 — modest demand growth; plan on rents tracking national, not racing it.
Negotiation context
- It's been on market 255 days — a 12% lower offer ($330k) is reasonable based on typical stale-listing flexibility.
- 2 sale attempts since 7y ago with the ask held roughly flat each time — persistent listings suggest the price (not the market) is what's stuck; bring a comps-based counter.
- Current owner paid $100k; list at $375k implies a 275% gain — meaningful room to come down on a strong offer.
Risks & watch-outs
- Climate carrying-cost: severe wind risk, 99% chance of damaging wind over 30y; major wildfire risk; extreme-heat days projected 7→21/yr by 2055 (HVAC capex compounding) — expect insurance premiums to compound above CPI over the hold.
Questions for the listing agent
- What do current leases actually rent for vs. the listed asking? Can we see a recent rent roll and the last 12 months of T-12 income?
- It's been on market 255 days. Have you received any prior offers? Is the seller open to a 23% concession, seller financing, or rate buy-down credit?
- Why hasn't it sold? Are there any deal-killer items the seller is aware of (foundation, flood, title, zoning, code violations)?
- Is there a deadline driving the sale (1031 exchange, divorce, estate, relocation)? That informs how much negotiation room exists.
- Schools are D-rated, which usually means shorter tenancies and higher turnover. Who's the typical renter profile here, and what's been the actual vacancy rate?
- Crime grade is D in this area — have there been break-ins, vandalism, or insurance claims at this property in the last 3 years? What carrier currently insures it and at what premium?
- The area grade is low — what's the realistic commute time and amenity access for the typical tenant pool here? Any planned neighborhood developments (good or bad) we should know about?
- What's the average days-on-market for RENTAL listings here right now (not sales)? A rising rental-DOM trend means longer vacancies and softer asking-rent achievability than the comps imply.
- What's the recent tenant-quality profile in this submarket — average credit score on applications, eviction rate, late-payment / NSF rate, and stable-employment percentage? A property-management company in the area should have these aggregated.
- How much new apartment / multifamily construction is in the pipeline within 1–3 miles? Heavy new supply (>2% of stock underway) typically softens rents 12–24 months out; light construction supports rent growth.
Investment metrics
- 1% rule
- 0.77% ✗
- Cap rate
- 5.76%
- Cash-on-cash
- -1.89%
- DSCR
- 0.92
- GRM
- 10.8
CMA / ARV
No comps found within radius.
Projected returns pro-forma
-3.0% appreciation · 3.0% rent growth · sell at horizon
- IRR
- -19.4%
- Equity multiple
- 0.32×
- Total profit
- $-71,304
- Equity at exit
- $55,899
- IRR
- -12.2%
- Equity multiple
- 0.28×
- Total profit
- $-75,808
- Equity at exit
- $32,415
Cash invested: $104,972 (down + closing). Projections, not guarantees.
Landlord ↔ Tenant lean methodology
- Overall (STATE)
- 87 Strongly Landlord-Friendly
- State Florida
- 87 Strongly Landlord-Friendly · R+3
- County
- — inherits STATE
- City
- — inherits STATE
ZIP-level market 32686
- Home prices YoY
- -9.1%
- Active inventory
- 95
- Price-to-rent
- 21.0×
Monthly cashflow live
- Estimated rent
- $2,886 medium interval (Pro) →
- Mortgage (P&I)
- −$1,966
- Tax from tax record
- −$323 /mo · $3,872/yr
- Insurance
- −$156
- HOA
- −$0
- Vacancy / Maint / Mgmt
- −$606
- Net cashflow
- $-165
Break-even live
Sensitivity live
| Price | -10% $47 | -5% $-59 | +0% $-165 | +5% $-271 | +10% $-377 |
|---|---|---|---|---|---|
| Rent | -10% $-393 | -5% $-279 | +0% $-165 | +5% $-51 | +10% $63 |
| Rate | -1.0pp $24 | -0.5pp $-70 | base $-165 | +0.5pp $-262 | +1.0pp $-361 |
2-unit breakdown (identical units grouped — click to expand)
| Units | Beds | Baths | Est. rent |
|---|---|---|---|
| 1× unit | 4 | 2 | $1,487 |
| 1× unit | 3 | 2 | $1,399 |
| Total (2 units) | $2,886 | ||
UW: 25.0% down · 7.5% · 30yr · 1.5% tax · 5.0% vac · 8.0% maint · 8.0% mgmt
Financing live
Cash to close
- Down payment
- $93,725
- Closing costs
- $11,247
- Reserves months
- —
- Total cash needed
- —
Loan-product check · same deal, 3 products live
Conventional
25% down · 7.5% · 30yr
- Down + closing
- —
- Monthly P&I
- —
- Monthly cashflow
- —
- DSCR
- —
- Eligible?
- —
Personal DTI + credit; lowest rate.
DSCR
20% down · 8.5% · 30yr
- Down + closing
- —
- Monthly P&I
- —
- Monthly cashflow
- —
- DSCR
- —
- Eligible?
- —
No personal income docs; deal must DSCR.
Hard money
10% down · 12.0% · 12mo
- Down + closing
- —
- Monthly P&I
- —
- Monthly cashflow
- —
- DSCR
- —
- Eligible?
- —
Short-term bridge; refi at stabilization.
Listing history 19 events
-
2026-06-15remarks 652-char remark
-
2026-06-15status $374,900 Pending 255 DOM
-
2026-06-15days on market $374,900 Active 255 DOM
-
2026-06-14days on market $374,900 Active 253 DOM
-
2026-06-13days on market $374,900 Active 252 DOM
-
2026-06-10days on market $374,900 Active 250 DOM
-
2026-06-09days on market $374,900 Active 249 DOM
-
2026-06-08days on market $374,900 Active 248 DOM
-
2026-06-07days on market $374,900 Active 247 DOM
-
2026-06-03days on market $374,900 Active 243 DOM
-
2026-06-02days on market $374,900 Active 242 DOM
-
2026-05-31days on market $374,900 Active 240 DOM
-
2026-05-30days on market $374,900 Active 239 DOM
-
2025-11-04price $374,900 620-char remark
Show marketing remark (620 chars)
This Property has 2 Manufactured HOMES on 3 ACRES (4/2)Home & (3/2) Home. The Yard is Completely Fenced. This 4 BEDROOM 2 BATHROOM Home sits on 3 ACRES. The Home has a Large Kitchen and Dining Room area to enjoy family and friends. The Master Bedroom is located on the opposite side of the home. This Home has a Shed & Carport. The Living Room has lots of room to enjoy Family time together. TURNKEY Home. The 2nd Home 3 Bedroom 2 Bathroom sits back with Privacy from the other Home. This Home has been Completely Remodeled. The Both Homes are Occupied. Schedule a Showing Today!! Main Home Roof 2020 AC 2024
-
2025-10-03$390,000 Active 620-char remark
Show marketing remark (620 chars)
This Property has 2 Manufactured HOMES on 3 ACRES (4/2)Home & (3/2) Home. The Yard is Completely Fenced. This 4 BEDROOM 2 BATHROOM Home sits on 3 ACRES. The Home has a Large Kitchen and Dining Room area to enjoy family and friends. The Master Bedroom is located on the opposite side of the home. This Home has a Shed & Carport. The Living Room has lots of room to enjoy Family time together. TURNKEY Home. The 2nd Home 3 Bedroom 2 Bathroom sits back with Privacy from the other Home. This Home has been Completely Remodeled. The Both Homes are Occupied. Schedule a Showing Today!! Main Home Roof 2020 AC 2024
-
2019-10-08soldstatus $100,000
-
2019-10-04soldstatus $100,000 216-char remark
Show marketing remark (216 chars)
2 well-maintained mobile homes on 3 acres, each with their own fenced yard, perfect for an extended family, or investor looking for tenants in place. Property is fenced and easy access to 441 and I75 via orange lake.
-
2019-06-24$130,000 216-char remark
Show marketing remark (216 chars)
2 well-maintained mobile homes on 3 acres, each with their own fenced yard, perfect for an extended family, or investor looking for tenants in place. Property is fenced and easy access to 441 and I75 via orange lake.
-
1993-05-13soldstatus $23,900
ⓘ Source: listings_history table (triggers on properties + properties_extension) + one-shot
backfill from property_details.listing_events for pre-trigger history.
Tax reassessment forecast FL · Resets to sale price
- Current annual tax
- $3,872 · $323/mo
- Projected year-2 tax
- $3,872 · $323/mo
- Expected delta
- $0/yr ($0/mo · 0.0%)
ⓘ Screening estimate from a state-policy table — verify with the county assessor before closing.
Climate risk First Street
- Flood 1/10 Low FEMA zone X (unshaded) · 0% chance over 30 yrs
- Wildfire 6/10 Major
- Heat 8/10 Severe 7 d/yr ≥107°F today · 21 d/yr by 30 yrs out
- Wind 9/10 Extreme 99% chance of damaging wind over 30 yrs
- Air quality 3/10 Moderate 2 unhealthy d/yr today · 3 by 30 yrs out
Nearby sold comps map
Loading sold comps map…
Walkable amenities ~0.75 mi
Loading nearby amenities…
Taxation est. · year 1
- Rental income
- $34,632
- − Mortgage interest
- −$21,000
- − Property taxes
- −$3,872
- − Insurance
- −$1,874
- − Repairs & maintenance
- −$2,771
- − Management
- −$2,771
- − Depreciation
- −$10,906
- Taxable loss
- −$8,562
- Est. tax savings @ 24.0%
- +$2,055
- After-tax cash flow
- $75/yr
For passive investors: Depreciation is non-cash, so a rental often shows a tax loss while cash-flowing — sheltering income. Rental losses are passive: they offset passive income freely, and up to $25,000/yr can offset ordinary (W-2) income if you actively participate and your MAGI is under $100k (phasing out to $0 by $150k); unused losses carry forward. On sale, claimed depreciation is recaptured at up to 25%, and gains may owe capital-gains tax (a 1031 exchange can defer both). Figures are a year-1 estimate at your 24.0% rate — not tax advice; consult a CPA.
Schools (NCES district)
- District
- Marion
- NCES district ID
- 1201260
- Math proficiency
- 42% ▼ -7.00%
- Reading proficiency
- 43% ▼ -4.00%
- Median HH income
- $40,015
- Composite
- 35.61/100
- National rank
- #4890
- State rank
- #61 of 73 in FL
Livability — Reddick
- Score
- 58/100
- State rank
- #845
- US rank
- #21164
Category grades
Schools grade is shown separately in the Schools card above.
Census & demographics
- Population (ZIP)
- 5,531
Population outlook (Marion County) Hauer SSP2
- Today (2025)
- 365,905 people
- By 2030
- 376,768 · +3.0%
- By 2040
- 396,555 · +8.4%
- By 2050
- 412,723 · +12.8%
- By 2075
- 446,090 · +21.9%
- By 2100
- 436,193 · +19.2%
Race, ethnicity, and origin ACS 2023
- Neighborhood character
- Diverse neighborhood (Simpson 0.56)
- Race & ethnicity
- White 59% Black 29% Two or more races 8% Hispanic / Latino 7%
- Hispanic origin (detail)
- Puerto Rican 2% Cuban 3%
- Common ancestry
- Italian 2% Iranian 2% Slovak 1%
- Foreign-born
- 8% · Canada, Jamaica, China
- Languages at home
- 92% English-only · Spanish 7% German/W. Germanic 1%
Political lean MEDSL · Marion
- 2024 margin
- Solid R (+31.6) · D 33.8% · R 65.5%
- 2008→2024 swing
- -20.0pp toward R · 2008: -11.6pp · 2024: -31.6pp
- All cycles
- 2024: R+31.6 2020: R+25.9 2016: R+26.2 2012: R+16.2 2008: R+11.6
Not yet ingested
- Civics
- —
Market trends
- HPI YoY
- ▼ -26.99%
- Current HPI
- 269.4566
- Rent YoY
- —
- Metro
- —
- State GDP YoY
- ▲ 3.28%
- F500 in state
- 36
Industry mix (Fortune 500 HQ in FL)
| Industry | F500 HQs | Revenue |
|---|---|---|
| Industrial Technology | 2 | $29B |
|
||
| Insurance | 2 | $17B |
|
||
| Retail | 1 | $60B |
|
||
| Technology Distribution | 1 | $58B |
|
||
| Homebuilding | 1 | $35B |
|
||
| Technology Manufacturing | 1 | $35B |
|
||
Price history
+1468.6% since first listed6 events — show timeline
- 2025-11-04 Price Changed $374,900 Stellar MLS as Distributed by MLS Grid
- 2025-10-03 Listed $390,000 Stellar MLS as Distributed by MLS Grid
- 2019-10-08 Sold (Public Records) $100,000 Public Records
- 2019-10-04 Sold (MLS) $100,000 Stellar MLS as Distributed by MLS Grid
- 2019-06-24 Listed $130,000 Stellar MLS as Distributed by MLS Grid
- 1993-05-13 Sold (Public Records) $23,900 Public Records
Property tax history
+13.1%/yrLatest (2025): $3,872 · +91.4% YoY. Source: county tax records.
Cash-flow waterfall
monthlySold comps — $/sqft
last 12 mo · ≤1 miLoading sold comps…