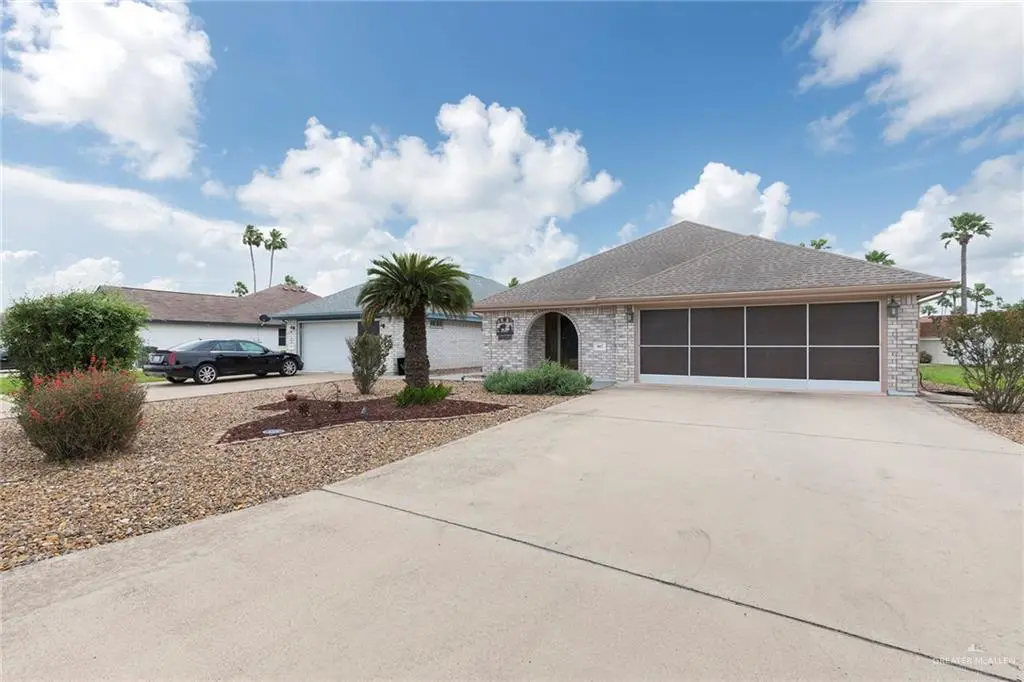
907 Lake View Dr · Mission, TX
Flood risk 1/10 · Minimal
- FEMA flood zone
- X (shaded)
- Chance of flooding over 30 yrs
- 0.0%
- Est. flood insurance / yr
- $507 – $1,088
Fire risk 5/10 · Moderate
- Est. fire insurance / yr
- $1,222 – $2,270
Heat risk 9/10 · Severe
- Hot days now (above 112°F)
- 7 days/yr
- Hot days in 30 yrs
- 23 days/yr
Wind risk 8/10 · Major
- Chance of severe wind over 30 yrs
- 96.0%
Air-quality risk 1/10 · Minimal
- Unhealthy air days now
- 0 days/yr
- Unhealthy air days in 30 yrs
- 0 days/yr
Risk factors via First Street. Map © Google.
Why this score? — see what drove the D grade
The composite is a weighted blend of 9 inputs, each scored 0–100. Each bar is that input's sub-score; the figure is the points it added to the 100-point composite (weight × sub-score).
- ARV discount +15.0/15.0
- Cash flow +8.9/30.0
- 1% rule +4.3/10.0
- Livability +3.8/5.0
- Rent growth +2.7/5.0
- DSCR +2.5/10.0
- Condition / age +2.5/5.0
- Schools +1.7/10.0
- Appreciation +0.0/10.0
$199,000
🖨 Deal sheet (PDF) 📄 Offer letter ✓ Due diligence
Listing remarks
Discover this beautifully maintained 2-bed, 2.5-bath home featuring a thoughtful layout & fantastic upgrades. Nestled on a quiet street with mature trees and great curb appeal, this property offers comfort, convenience and versatility. Step inside to a warm and inviting interior with spacious living areas and abundant natural light. The kitchen comes equipped with a reverse osmosis system, JennAir electric stove and lots of cabinets and drawers —perfect for everyday living and entertaining. A standout feature is the garage, now a fully finished flex room with its own HVAC and full bathroom. Use it as a guest suite, home office, gym, media room, or hobby space—the possibili
Key facts
- Open floor plan
- Side patio
- 5,858 sq ft lot
Tags
Property features AI
Finance
- Other: Living area reported by HidalgoCAD
- HOA & community: No association
Exterior
- Parking: Attached garage with 2 covered parking spaces (2 total spaces, 2 garage spaces); Attached parking
- Utilities: City sewer; Cable available; Public water
- Home design: Brick construction; Shingle roof; Slab foundation; Not new construction
- Construction: Brick exterior; Sloped shingle roof; Slab foundation
- Exterior features: Mature trees; Rock yard; Patio slab; Curbs; Sidewalks; Paved road access; Public water
Interior
- Kitchen: Smooth electric cooktop; Dishwasher; Microwave; Refrigerator; Electric water heater
- Bedrooms: Primary bedroom with sitting area and walk-in closet
- Flooring: Carpet; Tile
- Bathrooms: 2 full bathrooms; 1 half bathroom
- Heating & cooling: Central heating (electric); Central air conditioning (electric)
- Interior features: Quartz countertops; Ceiling fans; Mini blinds on windows
- Laundry & utility: Laundry room with washer/dryer connection; Water heater located in the garage
Neighborhood map
What this means for you Summary
Snapshot
- This is a 3-bed/2.0-bath single-family listed at $199k.
Deal economics
- At list price, monthly cash flow is $-160 ($-2k/yr) — negative.
- To cash-flow at today's rent, offer at most $171k (14.2% below list).
- To meet the 1% rule (rent ≥ 1% of price), the offer needs to be $185k (7.3% below list).
- Recommended offer: $171k (14.2% below list) — sets the bar for cash-flow.
- Cap rate 5.3% vs local median 3.5% in Mission — top-decile yield for the area; either an underpriced asset or a hidden risk that comps aren't pricing in. Stress-test before assuming the spread holds.
Location & tenants
- Location reads 75/100 on livability (#148 in TX, #4,155 nationally) — a middle-class / working-renter tenant base. Strengths: cost of living A+, housing A+, health & safety A+; Watch: amenities F, commute F, employment D-.
- Mission CISD (urban): math 15% / reading 28% proficiency, ranked #775 of 826 in TX (top 94%) — low school quality limits family demand, transient renter base, plan for 1-2y turnover; 78% free/reduced lunch — lower-income household profile, screen leases tightly.
- Zoned schools: Leal El (math 12% / reading 25%, grade F, #3,759 of 4,322 statewide, top 88%, 463 students, 89% FRL); White J H (math 11% / reading 28%, grade F, #1,445 of 1,662 statewide, top 88%, 847 students, 90% FRL); Mission H S (math 18% / reading 28%, grade F, #1,348 of 1,632 statewide, top 83%, 2,218 students, 91% FRL).
- Market conditions: Rents flat; 852 active listings in the ZIP; 4 comparable units currently listed for rent nearby; rentals lingering (median 46d on market — plan ~5-8 weeks vacancy on turnover, expect pricing pressure); 75% of comp listings sitting > 30 days — soft ceiling on asking rent; 7,378 units permitted in Hidalgo County in 2024 (641 in 5+ unit buildings).
- This rent runs 41% of the median local income ($54k/yr) — at the standard rent-burdened threshold; future hikes will face affordability resistance.
Forward outlook
- Local home prices are declining (-3.0%/yr); year-one equity from $1k of loan paydown is wiped out by about $6k of value loss. Plan a longer hold.
- Hidalgo County population projected at +28% by 2050 — long-run rental-demand tailwind backs the buy-and-hold thesis.
Negotiation context
- It's been on market 55 days — a 3% lower offer ($193k) is reasonable based on typical stale-listing flexibility.
- 3 sale attempts with the ask held roughly flat each time — persistent listings suggest the price (not the market) is what's stuck; bring a comps-based counter.
Risks & watch-outs
- Watch-outs: property tax is 3.0% of price.
- Climate carrying-cost: severe wind risk, 96% chance of damaging wind over 30y; moderate wildfire risk; extreme-heat days projected 7→23/yr by 2055 (HVAC capex compounding) — expect insurance premiums to compound above CPI over the hold.
Questions for the listing agent
- What do current leases actually rent for vs. the listed asking? Can we see a recent rent roll and the last 12 months of T-12 income?
- It's been on market 55 days. Have you received any prior offers? Is the seller open to a 14% concession, seller financing, or rate buy-down credit?
- Property tax is high relative to price — has the assessment been appealed recently, and will the sale trigger a re-assessment?
- Is there a deadline driving the sale (1031 exchange, divorce, estate, relocation)? That informs how much negotiation room exists.
- The area grade is low — what's the realistic commute time and amenity access for the typical tenant pool here? Any planned neighborhood developments (good or bad) we should know about?
- What's the average days-on-market for RENTAL listings here right now (not sales)? A rising rental-DOM trend means longer vacancies and softer asking-rent achievability than the comps imply.
- What's the recent tenant-quality profile in this submarket — average credit score on applications, eviction rate, late-payment / NSF rate, and stable-employment percentage? A property-management company in the area should have these aggregated.
- How much new for-sale + rental construction is in the pipeline within 1–3 miles? Heavy new supply typically softens prices + rents 12–24 months out; constrained supply supports both.
Investment metrics
- 1% rule
- 0.93% ✗
- Cap rate
- 5.33%
- Cash-on-cash
- -3.45%
- DSCR
- 0.85
- GRM
- 9.0
CMA / ARV
- ARV (median comp)
- $253,086
- List price
- $199,000
- Delta
- -21.37%
- Verdict
- UNDERPRICED
- Comps
- 20 within 1.0 mi
Show comp detail 12 sales within ~0.75 mi
| Address | Dist | Beds/Ba | Sqft | Sold | Price | $/sf | Match |
|---|---|---|---|---|---|---|---|
| 1208 Lake View Dr | 0.26mi | 3/2.5 | 1,902 (+0%) | 1mo | $299,000 | $157 | 84 |
| 410 La Laguna | 0.10mi | 3/2.0 | 1,771 (-7%) | 2mo | $283,900 | $160 | 82 |
| 800 La Laguna Rd | 0.11mi | 3/2.5 | 1,772 (-7%) | 0mo | $323,500 | $183 | 81 |
| 605 La Laguna Rd | 0.08mi | 4/2.5 (+1) | 1,804 (-5%) | 3mo | $335,000 | $186 | 78 |
| 705 La Laguna Rd | 0.10mi | 3/2.0 | 1,701 (-10%) | 3mo | $313,000 | $184 | 75 |
| 508 La Laguna Rd | 0.07mi | 3/2.5 | 1,637 (-14%) | 5mo | $289,000 | $177 | 68 |
| 1007 La Laguna Rd | 0.23mi | 3/2.5 | 1,687 (-11%) | 1mo | $310,000 | $184 | 68 |
| 502 La Laguna Rd | 0.09mi | 3/2.5 | 1,647 (-13%) | 6mo | $295,000 | $179 | 67 |
| 904 W E St | 0.70mi | 3/3.0 | 1,832 (-4%) | 2mo | $249,000 | $136 | 56 |
| 600 S Viento Dorado St | 0.53mi | 4/2.5 (+1) | 1,730 (-9%) | 0mo | $275,000 | $159 | 53 |
| 1715 River Bend Dr | 0.58mi | 2/2.0 (-1) | 2,078 (+10%) | 1mo | $155,000 | $75 | 51 |
| 1008 W B St | 0.64mi | 3/2.5 | 1,671 (-12%) | 0mo | $299,000 | $179 | 48 |
Match score weights: distance 35% · size 25% · config 20% · recency 20%. Top-matched comps best support the ARV.
Projected returns pro-forma
-3.0% appreciation · 0.93% rent growth · sell at horizon
- IRR
- -24.8%
- Equity multiple
- 0.17×
- Total profit
- $-46,033
- Equity at exit
- $29,672
- IRR
- -29.6%
- Equity multiple
- -0.21×
- Total profit
- $-67,320
- Equity at exit
- $17,206
Cash invested: $55,720 (down + closing). Projections, not guarantees.
Landlord ↔ Tenant lean methodology
- Overall (STATE)
- 87 Strongly Landlord-Friendly
- State Texas
- 87 Strongly Landlord-Friendly · R+5
- County
- — inherits STATE
- City
- — inherits STATE
ZIP-level market 78572
- Home prices YoY
- -22.9%
- Rents YoY
- 0.9%
- Active inventory
- 852
- Price-to-rent
- 9.0×
Monthly cashflow live
- Estimated rent
- $1,845 medium interval (Pro) →
- Mortgage (P&I)
- −$1,044
- Tax from tax record
- −$491 /mo · $5,897/yr
- Insurance
- −$83
- HOA
- −$0
- Vacancy / Maint / Mgmt
- −$388
- Net cashflow
- $-160
Break-even live
Sensitivity live
| Price | -10% $-47 | -5% $-104 | +0% $-160 | +5% $-216 | +10% $-273 |
|---|---|---|---|---|---|
| Rent | -10% $-306 | -5% $-233 | +0% $-160 | +5% $-87 | +10% $-14 |
| Rate | -1.0pp $-60 | -0.5pp $-109 | base $-160 | +0.5pp $-212 | +1.0pp $-264 |
UW: 25.0% down · 7.5% · 30yr · 1.5% tax · 5.0% vac · 8.0% maint · 8.0% mgmt
Financing live
Cash to close
- Down payment
- $49,750
- Closing costs
- $5,970
- Reserves months
- —
- Total cash needed
- —
Loan-product check · same deal, 3 products live
Conventional
25% down · 7.5% · 30yr
- Down + closing
- —
- Monthly P&I
- —
- Monthly cashflow
- —
- DSCR
- —
- Eligible?
- —
Personal DTI + credit; lowest rate.
DSCR
20% down · 8.5% · 30yr
- Down + closing
- —
- Monthly P&I
- —
- Monthly cashflow
- —
- DSCR
- —
- Eligible?
- —
No personal income docs; deal must DSCR.
Hard money
10% down · 12.0% · 12mo
- Down + closing
- —
- Monthly P&I
- —
- Monthly cashflow
- —
- DSCR
- —
- Eligible?
- —
Short-term bridge; refi at stabilization.
Rent comps 4 comps
| Address | Beds | Baths | Sqft | Rent | $/sqft | DOM | Units | Dist |
|---|---|---|---|---|---|---|---|---|
| 903 La Laguna Rd Mission, TX | 3.0 | 2.0 | 1579 | $2,000 | $1.27 | 45d | 1 | 0.16mi |
| 1506 Debby Ln Mission, TX | 3.0 | 2.5 | 2506 | $1,395 | $0.56 | 45d | 1 | 0.41mi |
| 304 S Tecate Dr Mission, TX | 3.0 | 2.0 | 1378 | $1,700 | $1.23 | 45d | 1 | 0.59mi |
| 2041 Lake View Dr #5 Mission, TX | 3.0 | 2.5 | 1612 | $1,800 | $1.12 | 16d | 1 | 0.79mi |
Listing history 24 events
-
2026-06-16status $199,000 Pending 55 DOM
-
2026-06-15days on market $199,000 Option 55 DOM
-
2026-06-14days on market $199,000 Option 53 DOM
-
2026-06-10days on market $199,000 Option 50 DOM
-
2026-06-09days on market $199,000 Option 49 DOM
-
2026-06-09status $199,000 Option 48 DOM
-
2026-06-08days on market $199,000 Active 48 DOM
-
2026-06-07days on market $199,000 Active 47 DOM
-
2026-06-03days on market $199,000 Active 43 DOM
-
2026-06-02days on market $199,000 Active 42 DOM
-
2026-06-01days on market $199,000 Active 41 DOM
-
2026-05-31days on market $199,000 Active 40 DOM
-
2026-05-31days on market $199,000 Active 39 DOM
-
2026-05-07price $199,000 949-char remark
-
2026-04-21$209,000 Active 949-char remark
-
2026-03-10$209,000 Active
-
2026-01-29price $219,000
-
2026-01-12price $226,900
-
2025-12-11$228,900 Active
-
2011-02-01soldstatus
-
2010-06-08soldstatus
-
2007-07-27soldstatus
-
2003-05-19soldstatus
-
2001-04-03soldstatus
ⓘ Source: listings_history table (triggers on properties + properties_extension) + one-shot
backfill from property_details.listing_events for pre-trigger history.
Tax reassessment forecast TX · Resets to sale price
- Current annual tax
- $5,897 · $491/mo
- Projected year-2 tax
- $5,897 · $491/mo
- Expected delta
- $0/yr ($0/mo · 0.0%)
ⓘ Screening estimate from a state-policy table — verify with the county assessor before closing.
Climate risk First Street
- Flood 1/10 Low FEMA zone X (shaded) · 0% chance over 30 yrs
- Wildfire 5/10 Major
- Heat 9/10 Extreme 7 d/yr ≥112°F today · 23 d/yr by 30 yrs out
- Wind 8/10 Severe 96% chance of damaging wind over 30 yrs
- Air quality 1/10 Low 0 unhealthy d/yr today · 0 by 30 yrs out
Nearby sold comps map
Loading sold comps map…
Walkable amenities ~0.75 mi
Loading nearby amenities…
Taxation est. · year 1
- Rental income
- $22,144
- − Mortgage interest
- −$11,147
- − Property taxes
- −$5,897
- − Insurance
- −$995
- − Repairs & maintenance
- −$1,772
- − Management
- −$1,772
- − Depreciation
- −$5,789
- Taxable loss
- −$5,227
- Est. tax savings @ 24.0%
- +$1,255
- After-tax cash flow
- $-667/yr
For passive investors: Depreciation is non-cash, so a rental often shows a tax loss while cash-flowing — sheltering income. Rental losses are passive: they offset passive income freely, and up to $25,000/yr can offset ordinary (W-2) income if you actively participate and your MAGI is under $100k (phasing out to $0 by $150k); unused losses carry forward. On sale, claimed depreciation is recaptured at up to 25%, and gains may owe capital-gains tax (a 1031 exchange can defer both). Figures are a year-1 estimate at your 24.0% rate — not tax advice; consult a CPA.
Schools (NCES district)
- District
- Mission CISD
- NCES district ID
- 4831040
- Math proficiency
- 15% ▼ -35.00%
- Reading proficiency
- 28% ▼ -15.00%
- Median HH income
- $32,855
- Composite
- 17.47/100
- National rank
- #9061
- State rank
- #775 of 826 in TX
Livability — Mission
- Score
- 75/100
- State rank
- #148
- US rank
- #4155
Category grades
Schools grade is shown separately in the Schools card above.
Census & demographics
- Census place
- Mission, TX
- County
- Hidalgo County · 623,128 people
- City population
- 78,024
- Metro
- McAllen-Edinburg-Mission, TX
- Population (ZIP)
- 78,024
- Household income
- $54,298
- Rent vs Own
- Severe rent burden
- 1714.0
Population outlook (Hidalgo County) Hauer SSP2
- Today (2025)
- 955,232 people
- By 2030
- 1,009,774 · +5.7%
- By 2040
- 1,120,332 · +17.3%
- By 2050
- 1,225,036 · +28.2%
- By 2075
- 1,439,189 · +50.7%
- By 2100
- 1,533,429 · +60.5%
Race, ethnicity, and origin ACS 2023
- Neighborhood character
- Predominantly Hispanic (85%)
- Race & ethnicity
- Hispanic / Latino 85% Two or more races 47% White 12% Asian 2%
- Hispanic origin (detail)
- Mexican 80%
- Common ancestry
- Slovak 1% Portuguese 0%
- Foreign-born
- 28% · Canada, South Korea
- Languages at home
- 22% English-only · Spanish 76%
Political lean MEDSL · Hidalgo
- 2024 margin
- Toss-up / Even · D 48.1% · R 51.0%
- 2008→2024 swing
- -41.6pp toward R · 2008: 38.7pp · 2024: -2.9pp
- All cycles
- 2024: R+2.9 2020: D+17.1 2016: D+40.5 2012: D+41.8 2008: D+38.7
Not yet ingested
- Civics
- —
Market trends
- HPI YoY
- ▼ -62.35%
- Current HPI
- 209.3573
- Rent YoY
- ▲ 0.93%
- Metro
- McAllen-Edinburg-Mission, TX
- State GDP YoY
- ▲ 3.95%
- F500 in state
- 110
Industry mix (Fortune 500 HQ in TX)
| Industry | F500 HQs | Revenue |
|---|---|---|
| Energy | 16 | $1,198B |
|
||
| Technology | 5 | $198B |
|
||
| Engineering / Construction | 4 | $72B |
|
||
| Energy Services | 3 | $60B |
|
||
| Utilities | 3 | $41B |
|
||
| Healthcare | 2 | $330B |
|
||
Price history
-13.1% since first listed13 events — show timeline
- 2026-06-16 Pending — MCALLENMLS
- 2026-06-08 Contingent — MCALLENMLS
- 2026-05-07 Price Changed $199,000 MCALLENMLS
- 2026-04-21 Listed $209,000 MCALLENMLS
- 2026-03-10 Listed $209,000 MCALLENMLS
- 2026-01-29 Price Changed $219,000 MCALLENMLS
- 2026-01-12 Price Changed $226,900 MCALLENMLS
- 2025-12-11 Listed $228,900 MCALLENMLS
- 2011-02-01 Sold (Public Records) — Public Records
- 2010-06-08 Sold (Public Records) — Public Records
- 2007-07-27 Sold (Public Records) — Public Records
- 2003-05-19 Sold (Public Records) — Public Records
- 2001-04-03 Sold (Public Records) — Public Records
Property tax history
+4.4%/yrLatest (2025): $5,897 · +20.0% YoY. Source: county tax records.
Cash-flow waterfall
monthlySold comps — $/sqft
last 12 mo · ≤1 miLoading sold comps…