1101 Colony Point Cir #108 · Pembroke Pines, FL
Flood risk 1/10 · Minimal
- FEMA flood zone
- X (shaded)
- Chance of flooding over 30 yrs
- 0.0%
- Est. flood insurance / yr
- $507 – $1,088
Fire risk 1/10 · Minimal
- Est. fire insurance / yr
- $947 – $1,759
Heat risk 9/10 · Severe
- Hot days now (above 105°F)
- 6 days/yr
- Hot days in 30 yrs
- 22 days/yr
Wind risk 10/10 · Severe
- Chance of severe wind over 30 yrs
- 99.0%
Air-quality risk 2/10 · Minimal
- Unhealthy air days now
- 2 days/yr
- Unhealthy air days in 30 yrs
- 2 days/yr
Risk factors via First Street. Map © Google.
Why this score? — see what drove the D grade
The composite is a weighted blend of 9 inputs, each scored 0–100. Each bar is that input's sub-score; the figure is the points it added to the 100-point composite (weight × sub-score).
- Cash flow +9.4/30.0
- ARV discount +7.5/15.0
- 1% rule +6.8/10.0
- Livability +4.2/5.0
- Schools +4.1/10.0
- Rent growth +2.9/5.0
- DSCR +2.6/10.0
- Condition / age +2.5/5.0
- Appreciation +0.0/10.0
$199,900
🖨 Deal sheet 📄 Offer letter ✓ Due diligence
Listing remarks
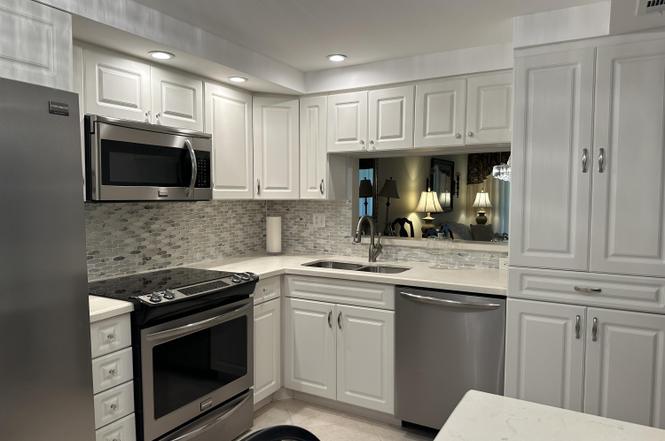
Wake up each morning to peaceful lake views in the highly desirable Colony Point community. This beautifully updated 55+ condo offers the perfect blend of comfort, convenience, and active living. Located just minutes from shopping, grocery stores, dining, and Memorial West Campus, everything you need is close by while still enjoying a quiet lakeside setting. Inside, you'll find upgraded flooring throughout, including elegant rectified edge tile and warm wood floors. The updated kitchen and baths create a move-in ready experience, while the enclosed den offers flexible space for guests, a home office, or additional bedroom. Just a short walk to the clubhouse and mail center, you'll love the
Key facts
- Wood flooring
- Rectified edge tile
- Lake views
Tags
Property features AI
Finance
- Other: Home warranty included
- HOA & community: Monthly association fee; Association amenities include pool, spa/hot tub, fitness center, clubhouse, tennis courts, shuffleboard court, billiard and game rooms, community room, library, private beach pavilion, trails, parking, manager on site, street lights, and on-site management; HOA covers cable TV, insurance, grounds maintenance, security, trash, common areas, elevator and recreation facilities; Senior community
Exterior
- Parking: Assigned parking; One open parking space
- Security: Gated community with guard; Security lights; Security patrol
- Utilities: Public water; Public sewer; Three-phase electric; Cable available
- Home design: Condominium; 6-story building; Resale; Unit faces south; Accessible entrance and customized wheelchair access
- Construction: Concrete and stucco construction; Flat roof
- Exterior features: Covered patio; Screened patio; Patio and porch; Porch; Waterfront property
Interior
- Kitchen: Dishwasher; Electric range; Microwave; Refrigerator
- Bedrooms: 2 bedrooms on the main level
- Flooring: Marble flooring; Wood flooring
- Bathrooms: 2 full bathrooms
- Heating & cooling: Central heating; Central air conditioning
- Interior features: Built-in features; Walk-in closets; Blinds and drapes on windows
Neighborhood map
What this means for you Summary
Snapshot
- This is a 2-bed/2.0-bath condo listed at $200k.
Deal economics
- At list price, monthly cash flow is $-142 ($-2k/yr) — negative.
- To cash-flow at today's rent, offer at most $175k (12.6% below list).
- Meets the 1% rule at list price ($2k rent vs $200k).
- Recommended offer: $175k (12.6% below list) — sets the bar for cash-flow.
- Cap rate 5.4% vs local median 4.0% in Pembroke Pines — top-decile yield for the area; either an underpriced asset or a hidden risk that comps aren't pricing in. Stress-test before assuming the spread holds.
Location & tenants
- Location reads 83/100 on livability (#54 in FL, #933 nationally) — a professional / high-income tenant draw. Strengths: housing A+, health & safety A+, schools A-; Watch: amenities D+, cost of living D+.
- Broward (suburban): math 42% / reading 53% proficiency, ranked #46 of 73 in FL (top 63%) — families likely to look elsewhere, expect single-tenant / working-renter base with shorter leases.
- Market conditions: Rents rising (+1.6%/yr); 222 active listings in the ZIP; 40 comparable units currently listed for rent nearby; rentals at typical pace (median 21d on market — plan ~3-4 weeks tenant-placement turnaround); solid renter incomes; 2,111 units permitted in Broward County in 2024 (1,265 in 5+ unit buildings).
- This rent runs 32% of the median local income ($89k/yr) — at the standard rent-burdened threshold; future hikes will face affordability resistance.
Forward outlook
- Local home prices are declining (-3.0%/yr); year-one equity from $1k of loan paydown is wiped out by about $6k of value loss. Plan a longer hold.
- Broward County population projected at +34% by 2050 — long-run rental-demand tailwind backs the buy-and-hold thesis.
Negotiation context
- It's been on market 132 days — a 12% lower offer ($176k) is reasonable based on typical stale-listing flexibility.
- 2 sale attempts with the ask held roughly flat each time — persistent listings suggest the price (not the market) is what's stuck; bring a comps-based counter.
- Current owner paid $57k; list at $200k implies a 251% gain — meaningful room to come down on a strong offer.
Risks & watch-outs
- Watch-outs: HOA is 35% of rent.
- Climate carrying-cost: severe wind risk, 99% chance of damaging wind over 30y; extreme-heat days projected 6→22/yr by 2055 (HVAC capex compounding) — expect insurance premiums to compound above CPI over the hold.
Questions for the listing agent
- What do current leases actually rent for vs. the listed asking? Can we see a recent rent roll and the last 12 months of T-12 income?
- It's been on market 132 days. Have you received any prior offers? Is the seller open to a 13% concession, seller financing, or rate buy-down credit?
- What does the HOA fee cover, when was the last increase, and are there any pending special assessments or reserve-fund shortfalls?
- Any open or pending special assessments — roof, HVAC, plumbing, elevator, façade? What's the per-unit balance and payoff schedule, and is the seller paying it off at close or rolling it to the buyer?
- Why hasn't it sold? Are there any deal-killer items the seller is aware of (foundation, flood, title, zoning, code violations)?
- Is there a deadline driving the sale (1031 exchange, divorce, estate, relocation)? That informs how much negotiation room exists.
- Schools are A-rated — typically a magnet for longer-tenancy family renters. What's the average tenant stay here, and is there a school-zone premium baked into asking?
- The area grade is low — what's the realistic commute time and amenity access for the typical tenant pool here? Any planned neighborhood developments (good or bad) we should know about?
- What's the average days-on-market for RENTAL listings here right now (not sales)? A rising rental-DOM trend means longer vacancies and softer asking-rent achievability than the comps imply.
- What's the recent tenant-quality profile in this submarket — average credit score on applications, eviction rate, late-payment / NSF rate, and stable-employment percentage? A property-management company in the area should have these aggregated.
- How much new apartment / multifamily construction is in the pipeline within 1–3 miles? Heavy new supply (>2% of stock underway) typically softens rents 12–24 months out; light construction supports rent growth.
Investment metrics
- 1% rule
- 1.18% ✓
- Cap rate
- 5.44%
- Cash-on-cash
- -3.05%
- DSCR
- 0.86
- GRM
- 7.0
CMA / ARV
No comps found within radius.
Projected returns pro-forma
-3.0% appreciation · 1.58% rent growth · sell at horizon
- IRR
- -23.5%
- Equity multiple
- 0.21×
- Total profit
- $-44,367
- Equity at exit
- $29,806
- IRR
- -24.5%
- Equity multiple
- -0.11×
- Total profit
- $-61,882
- Equity at exit
- $17,284
Cash invested: $55,972 (down + closing). Projections, not guarantees.
Landlord ↔ Tenant lean methodology
- Overall (STATE)
- 87 Strongly Landlord-Friendly
- State Florida
- 87 Strongly Landlord-Friendly · R+3
- County
- — inherits STATE
- City
- — inherits STATE
ZIP-level market 33026
- Rents YoY
- 1.6%
- Active inventory
- 222
- Price-to-rent
- 7.0×
Monthly cashflow live
- Estimated rent
- $2,366 high interval (Pro) →
- Mortgage (P&I)
- −$1,048
- Tax from tax record
- −$46 /mo · $554/yr
- Insurance
- −$83
- HOA
- −$834
- Vacancy / Maint / Mgmt
- −$497
- Net cashflow
- $-142
Break-even live
UW: 25.0% down · 7.5% · 30yr · 1.5% tax · 5.0% vac · 8.0% maint · 8.0% mgmt
Financing live
Cash to close
- Down payment
- $49,975
- Closing costs
- $5,997
- Reserves months
- —
- Total cash needed
- —
Loan-product check · same deal, 3 products live
Conventional
25% down · 7.5% · 30yr
- Down + closing
- —
- Monthly P&I
- —
- Monthly cashflow
- —
- DSCR
- —
- Eligible?
- —
Personal DTI + credit; lowest rate.
DSCR
20% down · 8.5% · 30yr
- Down + closing
- —
- Monthly P&I
- —
- Monthly cashflow
- —
- DSCR
- —
- Eligible?
- —
No personal income docs; deal must DSCR.
Hard money
10% down · 12.0% · 12mo
- Down + closing
- —
- Monthly P&I
- —
- Monthly cashflow
- —
- DSCR
- —
- Eligible?
- —
Short-term bridge; refi at stabilization.
Rent comps 40 comps
| Address | Beds | Baths | Sqft | Rent | $/sqft | DOM | Units | Dist |
|---|---|---|---|---|---|---|---|---|
| 11905 NW 11th St #11905 Pembroke Pines, FL | 2.0 | 2.0 | 900 | $2,500 | $2.78 | 24d | 1 | 0.39mi |
| 11931 NW 11th St #11931 Pembroke Pines, FL | 2.0 | 2.0 | 900 | $2,400 | $2.67 | 5d | 1 | 0.39mi |
| 10851 NW 3rd Ct Unit 18A2L Pembroke Pines, FL | 1.0 | 1.0 | 610 | $1,850 | $3.03 | 21d | 1 | 0.46mi |
| 11992 NW 11th St #11992 Pembroke Pines, FL | 2.0 | 2.0 | 900 | $2,400 | $2.67 | 8d | 1 | 0.46mi |
| 11969 NW 11th St #11969 Pembroke Pines, FL | 2.0 | 2.0 | 970 | $2,400 | $2.47 | 3d | 1 | 0.46mi |
| 11969 NW 11th St #11969 Pembroke Pines, FL | 2.0 | 2.0 | 970 | $2,400 | $2.47 | 24d | 1 | 0.46mi |
| 10813 NW 3rd Ct Unit 2L Pembroke Pines, FL | 1.0 | 1.0 | 610 | $1,875 | $3.07 | 8d | 1 | 0.49mi |
| 10813 NW 3rd Ct Unit 2L Pembroke Pines, FL | 1.0 | 1.0 | 610 | $1,850 | $3.03 | 24d | 1 | 0.49mi |
| 12060 NW 11th St #12060 Pembroke Pines, FL | 2.0 | 2.0 | 970 | $2,350 | $2.42 | 8d | 1 | 0.50mi |
| 1014 NW 107th Ave Pembroke Pines, FL | 2.0 | 1.5 | 1044 | $2,600 | $2.49 | 24d | 1 | 0.59mi |
| 1220 NW 122nd Ter Pembroke Pines, FL | 2.0 | 2.0 | 1017 | $2,700 | $2.65 | 24d | 1 | 0.63mi |
| 120 NW 108th Ter Pembroke Pines, FL | 1.0–3.0 | 1.0–2.0 | 1101 | $2,534 | $2.30 | 3d | 10 | 0.68mi |
| 131 SW 117th Ave #8304 Pembroke Pines, FL | 1.0 | 1.0 | 810 | $1,800 | $2.22 | 17d | 1 | 0.69mi |
| 151 SW 117th Ave #9306 Pembroke Pines, FL | 1.0 | 1.0 | 690 | $1,900 | $2.75 | 24d | 1 | 0.72mi |
| 140 SW 117th Ave Pembroke Pines, FL | 1.0 | 1.0 | 810 | $2,100 | $2.59 | 19d | 1 | 0.72mi |
| 1072 NW 106th Ter #205 Pembroke Pines, FL | 2.0 | 2.0 | 806 | $2,100 | $2.61 | 17d | 1 | 0.72mi |
| 11631 SW 2nd St #20103 Pembroke Pines, FL | 1.0 | 1.0 | 810 | $1,950 | $2.41 | 24d | 1 | 0.73mi |
| 11361 SW 3rd St #11361 Pembroke Pines, FL | 2.0 | 2.0 | 978 | $2,450 | $2.51 | 15d | 1 | 0.74mi |
| 10613 NW 11th St #205 Pembroke Pines, FL | 2.0 | 2.0 | 806 | $2,100 | $2.61 | 24d | 1 | 0.76mi |
| 10633 NW 10th St #102 Pembroke Pines, FL | 2.0 | 2.0 | 806 | $2,200 | $2.73 | 10d | 1 | 0.76mi |
| 10633 NW 10th St #102 Pembroke Pines, FL | 2.0 | 2.0 | 806 | $2,200 | $2.73 | 24d | 1 | 0.76mi |
| 1148 NW 106th Ter Pembroke Pines, FL | 2.0 | 2.0 | 806 | $2,500 | $3.10 | 24d | 1 | 0.76mi |
| 10616 NW 10th St #104 Pembroke Pines, FL | 2.0 | 2.0 | 806 | $2,200 | $2.73 | 21d | 1 | 0.77mi |
| 220 SW 116th Ave #15203 Pembroke Pines, FL | 1.0 | 1.0 | 690 | $2,000 | $2.90 | 24d | 1 | 0.78mi |
| 220 SW 116th Ave #15203 Pembroke Pines, FL | 1.0 | 1.0 | 690 | $2,000 | $2.90 | 5d | 1 | 0.78mi |
| 10608 NW 6th St Unit 10608 Pembroke Pines, FL | 2.0 | 1.5 | 1008 | $2,395 | $2.38 | 22d | 1 | 0.79mi |
| 11730 SW 2nd St #12103 Pembroke Pines, FL | 1.0 | 1.0 | 690 | $2,200 | $3.19 | 21d | 1 | 0.84mi |
| 11730 SW 2nd St #12204 Pembroke Pines, FL | 1.0 | 1.0 | 690 | $2,100 | $3.04 | 24d | 1 | 0.84mi |
| 11730 SW 2nd St #12103 Pembroke Pines, FL | 1.0 | 1.0 | 690 | $2,100 | $3.04 | 8d | 1 | 0.84mi |
| 10468 NW 10th St #204 Pembroke Pines, FL | 2.0 | 2.0 | 806 | $2,150 | $2.67 | 24d | 1 | 0.84mi |
| 10409 NW 11th St Pembroke Pines, FL | 2.0 | 2.0 | 806 | $2,000 | $2.48 | 24d | 1 | 0.85mi |
| 526 SW 113th Way #526 Pembroke Pines, FL | 1.0 | 1.0 | 770 | $1,950 | $2.53 | 24d | 1 | 0.86mi |
| 940 NW 104th Ave #203 Pembroke Pines, FL | 2.0 | 2.0 | 806 | $2,100 | $2.61 | 8d | 1 | 0.86mi |
| 11301 SW 4th St Pembroke Pines, FL | 2.0 | 2.0 | 1058 | $3,685 | $3.48 | 24d | 1 | 0.86mi |
| 4300 SW 113th Ter Miramar, FL | 1.0–3.0 | 1.0–2.0 | 1086 | $2,682 | $2.47 | 2d | 1 | 0.89mi |
| 2321 NW 114th Ter Unit 1442058P Pembroke Pines, FL | 1.0 | 1.0 | 699 | $3,028 | $4.33 | 2d | 1 | 0.91mi |
| 10329 NW 11th St #201 Pembroke Pines, FL | 2.0 | 2.0 | 806 | $2,100 | $2.61 | 24d | 1 | 0.91mi |
| 900 Saint Charles Pl #708 Pembroke Pines, FL | 2.0 | 2.0 | 1100 | $1,999 | $1.82 | 3d | 1 | 0.92mi |
| 900 Saint Charles Pl #708 Pembroke Pines, FL | 2.0 | 2.0 | 1100 | $1,999 | $1.82 | 4d | 1 | 0.92mi |
| 11185 SW 6th St #301 Pembroke Pines, FL | 2.0 | 2.0 | 1065 | $2,250 | $2.11 | 24d | 1 | 0.92mi |
HOA detail condo
- Monthly dues
- $834 · $10,008/yr
- Assessments
- None detected in remarks — confirm with the listing agent.
Listing history 19 events
-
2026-06-18days on market $199,900 Active 132 DOM
-
2026-06-17days on market $199,900 Active 131 DOM
-
2026-06-16days on market $199,900 Active 130 DOM
-
2026-06-15days on market $199,900 Active 129 DOM
-
2026-06-13days on market $199,900 Active 127 DOM
-
2026-06-09days on market $199,900 Active 123 DOM
-
2026-06-07days on market $199,900 Active 121 DOM
-
2026-06-04days on market $199,900 Active 118 DOM
-
2026-06-03days on market $199,900 Active 117 DOM
-
2026-06-02days on market $199,900 Active 116 DOM
-
2026-06-01days on market $199,900 Active 115 DOM
-
2026-05-31days on market $199,900 Active 114 DOM
-
2026-05-08price $199,900
-
2026-02-06$210,000 Active
-
2026-01-01historical
-
2025-09-19price $210,000
-
2025-07-25$220,000 Active
-
1996-12-16soldstatus $57,000
-
1980-04-01soldstatus $60,000
ⓘ Source: listings_history table (triggers on properties + properties_extension) + one-shot
backfill from property_details.listing_events for pre-trigger history.
Tax reassessment forecast FL · Resets to sale price
- Current annual tax
- $554 · $46/mo
- Projected year-2 tax
- $1,659 · $138/mo
- Expected delta
- +$1,105/yr (+$92/mo · 199.6%)
ⓘ Screening estimate from a state-policy table — verify with the county assessor before closing.
Climate risk First Street
- Flood 1/10 Low FEMA zone X (shaded) · 0% chance over 30 yrs
- Wildfire 1/10 Low
- Heat 9/10 Extreme 6 d/yr ≥105°F today · 22 d/yr by 30 yrs out
- Wind 10/10 Extreme 99% chance of damaging wind over 30 yrs
- Air quality 2/10 Low 2 unhealthy d/yr today · 2 by 30 yrs out
Nearby sold comps map
Loading sold comps map…
Walkable amenities ~0.75 mi
Loading nearby amenities…
Taxation est. · year 1
- Rental income
- $28,396
- − Mortgage interest
- −$11,198
- − Property taxes
- −$554
- − Insurance
- −$1,000
- − Repairs & maintenance
- −$2,272
- − Management
- −$2,272
- − HOA
- −$10,008
- − Depreciation
- −$5,815
- Taxable loss
- −$4,721
- Est. tax savings @ 24.0%
- +$1,133
- After-tax cash flow
- $-575/yr
For passive investors: Depreciation is non-cash, so a rental often shows a tax loss while cash-flowing — sheltering income. Rental losses are passive: they offset passive income freely, and up to $25,000/yr can offset ordinary (W-2) income if you actively participate and your MAGI is under $100k (phasing out to $0 by $150k); unused losses carry forward. On sale, claimed depreciation is recaptured at up to 25%, and gains may owe capital-gains tax (a 1031 exchange can defer both). Figures are a year-1 estimate at your 24.0% rate — not tax advice; consult a CPA.
Schools (NCES district)
- District
- Broward
- NCES district ID
- 1200180
- Math proficiency
- 42% ▼ -18.00%
- Reading proficiency
- 53% ▼ -5.00%
- Median HH income
- $52,139
- Composite
- 40.88/100
- National rank
- #3621
- State rank
- #46 of 73 in FL
Livability — Pembroke Pines
- Score
- 83/100
- State rank
- #54
- US rank
- #933
Category grades
Schools grade is shown separately in the Schools card above.
Census & demographics
- Census place
- Pembroke Pines, FL
- County
- Broward County · 1,963,430 people
- City population
- 180,224
- Metro
- Miami-Fort Lauderdale-Pompano Beach, FL
- Population (ZIP)
- 31,172
- Household income
- $89,306
- Rent vs Own
- Severe rent burden
- 517.0
Population outlook (Broward County) Hauer SSP2
- Today (2025)
- 2,207,033 people
- By 2030
- 2,360,704 · +7.0%
- By 2040
- 2,661,208 · +20.6%
- By 2050
- 2,946,698 · +33.5%
- By 2075
- 3,602,273 · +63.2%
- By 2100
- 3,970,984 · +79.9%
Race, ethnicity, and origin ACS 2023
- Neighborhood character
- Diverse neighborhood (Simpson 0.69)
- Race & ethnicity
- Hispanic / Latino 41% White 35% Two or more races 23% Black 15% Asian 4%
- Hispanic origin (detail)
- Puerto Rican 5% Cuban 13% Dominican 2%
- Common ancestry
- Hispanic 5% Romanian 3% Scotch-Irish 2%
- Foreign-born
- 35% · Canada, Jamaica, China
- Languages at home
- 52% English-only · Spanish 35% French/Haitian/Cajun 5% Other Indo-European 4%
Political lean MEDSL · Broward
- 2024 margin
- D (+17.0) · D 58.0% · R 41.0%
- 2008→2024 swing
- -17.8pp toward R · 2008: 34.7pp · 2024: 17.0pp
- All cycles
- 2024: D+17.0 2020: D+29.8 2016: D+35.0 2012: D+34.9 2008: D+34.7
Not yet ingested
- Civics
- —
Market trends
- HPI YoY
- ▼ -248.72%
- Current HPI
- 380.7596
- Rent YoY
- ▲ 1.58%
- Metro
- Miami-Fort Lauderdale-Pompano Beach, FL
- State GDP YoY
- ▲ 3.28%
- F500 in state
- 36
Industry mix (Fortune 500 HQ in FL)
| Industry | F500 HQs | Revenue |
|---|---|---|
| Industrial Technology | 2 | $29B |
|
||
| Insurance | 2 | $17B |
|
||
| Retail | 1 | $60B |
|
||
| Technology Distribution | 1 | $58B |
|
||
| Homebuilding | 1 | $35B |
|
||
| Technology Manufacturing | 1 | $35B |
|
||
Price history
+233.2% since first listed7 events — show timeline
- 2026-05-08 Price Changed $199,900 Beaches MLS
- 2026-02-06 Listed $210,000 Beaches MLS
- 2026-01-01 Listing Removed — Beaches MLS
- 2025-09-19 Price Changed $210,000 Beaches MLS
- 2025-07-25 Listed $220,000 Beaches MLS
- 1996-12-16 Sold (Public Records) $57,000 Public Records
- 1980-04-01 Sold (Public Records) $60,000 Public Records
Property tax history
+0.5%/yrLatest (2025): $554 · +2.1% YoY. Source: county tax records.
Cash-flow waterfall
monthlySold comps — $/sqft
last 12 mo · ≤1 miLoading sold comps…