403 Lafitte Blvd · Cameron, LA
Flood risk 10/10 · Severe
- FEMA flood zone
- VE
- Chance of flooding over 30 yrs
- 0.99%
- Est. flood insurance / yr
- $5,013 – $11,043
Fire risk 4/10 · Minor
- Est. fire insurance / yr
- $1,269 – $2,357
Heat risk 10/10 · Severe
- Hot days now (above 108°F)
- 7 days/yr
- Hot days in 30 yrs
- 27 days/yr
Wind risk 10/10 · Severe
- Chance of severe wind over 30 yrs
- 99.0%
Air-quality risk 2/10 · Minimal
- Unhealthy air days now
- 1 days/yr
- Unhealthy air days in 30 yrs
- 1 days/yr
Risk factors via First Street. Map © Google.
Why this score? — see what drove the D- grade
The composite is a weighted blend of 9 inputs, each scored 0–100. Each bar is that input's sub-score; the figure is the points it added to the 100-point composite (weight × sub-score).
- Appreciation +7.8/10.0
- ARV discount +7.5/15.0
- Cash flow +7.4/30.0
- Schools +3.9/10.0
- Livability +3.1/5.0
- Rent growth +2.5/5.0
- Condition / age +2.5/5.0
- DSCR +1.5/10.0
- 1% rule +1.1/10.0
$360,000
🖨 Deal sheet 📄 Offer letter ✓ Due diligence
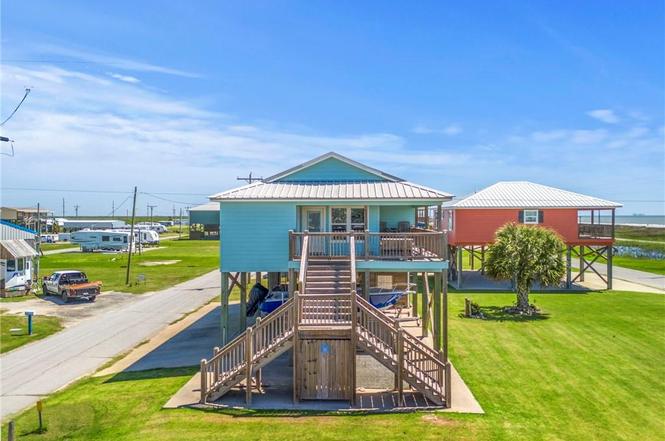
Listing remarks
Welcome to your own personal coastal paradise in Holly Beach! This stunning property offers the perfect blend of relaxation, comfort, and breathtaking Gulf views. Step inside and be greeted by the spaciousness and charm of this 3 bedroom, 2 bath home. The open layout creates a warm and inviting atmosphere, perfect for relaxing after a day in the sun. The heart of the home is the kitchen, complete with a huge peninsula that can seat up to 7 people comfortably and a walk in pantry/laundry room. Plus, there is a kitchen table that can accommodate 6 people, ensuring everyone has a seat at the table. Convenience is key with this property, as it comes fully furnished with furniture, refrigerator,
Key facts
- Private shower
- Huge peninsula
- Balcony area
Tags
Property features AI
Exterior
- Utilities: Public water; Electricity connected; Sewer connected; Water connected; Private sewer on property
- Home design: Single-family house; One story; Raised foundation with pillar/post/pier; No shared/common walls; Common interest: none
- Construction: HardiPlank-type siding; Metal roof
- Exterior features: Balcony; Deck; Patio; Porch; Screened porch; Beach access; Has a view; Rectangular lot
Interior
- Kitchen: Dishwasher; Microwave; Oven; Range; Refrigerator
- Bedrooms: 3 bedrooms on the main level
- Bathrooms: 2 full bathrooms (both on the main level)
- Heating & cooling: Central heating; Central air; Ceiling fans
- Interior features: Ceiling fans; Granite counters; Kitchen island; Open floor plan; Pantry; Recessed lighting; Storage
- Laundry & utility: Washer; Dryer
Neighborhood map
What this means for you Summary
Snapshot
- This is a 3-bed/2.0-bath single-family listed at $360k.
Deal economics
- At list price, monthly cash flow is $-1k ($-14k/yr) — negative.
- To cash-flow at today's rent, offer at most $160k (55.5% below list).
- To meet the 1% rule (rent ≥ 1% of price), the offer needs to be $219k (39.3% below list).
- Recommended offer: $160k (55.5% below list) — sets the bar for cash-flow.
Location & tenants
- Location reads 62/100 on livability (#211 in LA) — a middle-class / working-renter tenant base. Strengths: cost of living A+, health & safety A+, crime A; Watch: amenities F, commute F, employment D-.
- Cameron Parish (rural): math 36% / reading 52% proficiency, ranked #16 of 98 in LA (top 16%) — families likely to look elsewhere, expect single-tenant / working-renter base with shorter leases.
- Market conditions: 43 active listings in the ZIP; 27 units permitted in Cameron Parish in 2024 (0 in 5+ unit buildings).
Forward outlook
- In year one you build about $22k of equity ($2k loan paydown + $20k appreciation (5.5% local appreciation)).
- By year 2, paydown + projected appreciation supports a ~$36k cash-out refi (75% LTV) — recoverable capital for the next deal without selling this one.
Negotiation context
- It's been on market 268 days — a 12% lower offer ($317k) is reasonable based on typical stale-listing flexibility.
- Current owner paid $10k; list at $360k implies a 3500% gain — meaningful room to come down on a strong offer.
Risks & watch-outs
- Watch-outs: flood insurance adds $669/mo.
- Climate carrying-cost: in FEMA flood zone VE (mandatory federal flood insurance); severe wind risk, 99% chance of damaging wind over 30y; extreme-heat days projected 7→27/yr by 2055 (HVAC capex compounding) — expect insurance premiums to compound above CPI over the hold.
Questions for the listing agent
- What do current leases actually rent for vs. the listed asking? Can we see a recent rent roll and the last 12 months of T-12 income?
- It's been on market 268 days. Have you received any prior offers? Is the seller open to a 56% concession, seller financing, or rate buy-down credit?
- What's the actual annual flood-insurance premium (NFIP or private), and is the property in a SFHA with mandatory coverage?
- Why hasn't it sold? Are there any deal-killer items the seller is aware of (foundation, flood, title, zoning, code violations)?
- Is there a deadline driving the sale (1031 exchange, divorce, estate, relocation)? That informs how much negotiation room exists.
- Schools are A-rated — typically a magnet for longer-tenancy family renters. What's the average tenant stay here, and is there a school-zone premium baked into asking?
- The area grade is low — what's the realistic commute time and amenity access for the typical tenant pool here? Any planned neighborhood developments (good or bad) we should know about?
- What's the average days-on-market for RENTAL listings here right now (not sales)? A rising rental-DOM trend means longer vacancies and softer asking-rent achievability than the comps imply.
- What's the recent tenant-quality profile in this submarket — average credit score on applications, eviction rate, late-payment / NSF rate, and stable-employment percentage? A property-management company in the area should have these aggregated.
- How much new for-sale + rental construction is in the pipeline within 1–3 miles? Heavy new supply typically softens prices + rents 12–24 months out; constrained supply supports both.
Investment metrics
- 1% rule
- 0.61% ✗
- Cap rate
- 4.75%
- Cash-on-cash
- -5.51%
- DSCR
- 0.75
- GRM
- 13.7
CMA / ARV
No comps found within radius.
Projected returns pro-forma
5.52% appreciation · 3.0% rent growth · sell at horizon
- IRR
- 3.2%
- Equity multiple
- 1.22×
- Total profit
- $21,865
- Equity at exit
- $215,415
- IRR
- 6.2%
- Equity multiple
- 2.23×
- Total profit
- $124,295
- Equity at exit
- $381,571
Cash invested: $100,800 (down + closing). Projections, not guarantees.
Landlord ↔ Tenant lean methodology
- Overall (STATE)
- 90 Strongly Landlord-Friendly
- State Louisiana
- 90 Strongly Landlord-Friendly · R+12
- County
- — inherits STATE
- City
- — inherits STATE
ZIP-level market 70631
- Home prices YoY
- 5.3%
- Active inventory
- 43
- Price-to-rent
- 13.7×
Monthly cashflow live
- Estimated rent
- $2,185 medium interval (Pro) →
- Mortgage (P&I)
- −$1,888
- Tax from tax record
- −$152 /mo · $1,819/yr
- Insurance
- −$150
- Flood insurance flood zone
- −$669 /mo · $8,028/yr
- HOA
- −$0
- Vacancy / Maint / Mgmt
- −$459
- Net cashflow
- $-1,132
Break-even live
UW: 25.0% down · 7.5% · 30yr · 1.5% tax · 5.0% vac · 8.0% maint · 8.0% mgmt
Financing live
Cash to close
- Down payment
- $90,000
- Closing costs
- $10,800
- Reserves months
- —
- Total cash needed
- —
Loan-product check · same deal, 3 products live
Conventional
25% down · 7.5% · 30yr
- Down + closing
- —
- Monthly P&I
- —
- Monthly cashflow
- —
- DSCR
- —
- Eligible?
- —
Personal DTI + credit; lowest rate.
DSCR
20% down · 8.5% · 30yr
- Down + closing
- —
- Monthly P&I
- —
- Monthly cashflow
- —
- DSCR
- —
- Eligible?
- —
No personal income docs; deal must DSCR.
Hard money
10% down · 12.0% · 12mo
- Down + closing
- —
- Monthly P&I
- —
- Monthly cashflow
- —
- DSCR
- —
- Eligible?
- —
Short-term bridge; refi at stabilization.
Listing history 3 events
-
2026-04-30status Pending
-
2025-02-24$360,000 Active
-
2004-08-02soldstatus $10,000
ⓘ Source: listings_history table (triggers on properties + properties_extension) + one-shot
backfill from property_details.listing_events for pre-trigger history.
Tax reassessment forecast LA · Resets to sale price
- Current annual tax
- $1,819 · $152/mo
- Projected year-2 tax
- $1,980 · $165/mo
- Expected delta
- +$161/yr (+$13/mo · 8.8%)
ⓘ Screening estimate from a state-policy table — verify with the county assessor before closing.
Climate risk First Street
- Flood 10/10 Extreme FEMA zone VE · 99% chance over 30 yrs
- Wildfire 4/10 Moderate
- Heat 10/10 Extreme 7 d/yr ≥108°F today · 27 d/yr by 30 yrs out
- Wind 10/10 Extreme 99% chance of damaging wind over 30 yrs
- Air quality 2/10 Low 1 unhealthy d/yr today · 1 by 30 yrs out
Nearby sold comps map
Loading sold comps map…
Walkable amenities ~0.75 mi
Loading nearby amenities…
Taxation est. · year 1
- Rental income
- $26,226
- − Mortgage interest
- −$20,166
- − Property taxes
- −$1,819
- − Insurance
- −$9,828
- − Repairs & maintenance
- −$2,098
- − Management
- −$2,098
- − Depreciation
- −$10,473
- Taxable loss
- −$20,256
- Est. tax savings @ 24.0%
- +$4,861
- After-tax cash flow
- $-8,722/yr
For passive investors: Depreciation is non-cash, so a rental often shows a tax loss while cash-flowing — sheltering income. Rental losses are passive: they offset passive income freely, and up to $25,000/yr can offset ordinary (W-2) income if you actively participate and your MAGI is under $100k (phasing out to $0 by $150k); unused losses carry forward. On sale, claimed depreciation is recaptured at up to 25%, and gains may owe capital-gains tax (a 1031 exchange can defer both). Figures are a year-1 estimate at your 24.0% rate — not tax advice; consult a CPA.
Schools (NCES district)
- District
- Cameron Parish
- NCES district ID
- 2200390
- Math proficiency
- 36% ▼ -45.00%
- Reading proficiency
- 52% ▼ -29.00%
- Median HH income
- $59,171
- Composite
- 38.62/100
- National rank
- #4156
- State rank
- #16 of 98 in LA
Livability — Cameron
- Score
- 62/100
- State rank
- #211
- US rank
- #16390
Category grades
Schools grade is shown separately in the Schools card above.
Census & demographics
- Population (ZIP)
- 326
Population outlook (Cameron County) Hauer SSP2
- Today (2025)
- 6,800 people
- By 2030
- 6,766 · -0.5%
- By 2040
- 6,676 · -1.8%
- By 2050
- 6,608 · -2.8%
- By 2075
- 7,007 · +3.0%
- By 2100
- 7,526 · +10.7%
Race, ethnicity, and origin ACS 2023
- Neighborhood character
- Predominantly White (86%)
- Race & ethnicity
- White 86% Two or more races 7% Native American 3% Black 2%
- Common ancestry
- Lithuanian 7% Italian 1%
- Foreign-born
- 1% · Canada
Political lean MEDSL · Cameron
- 2024 margin
- Solid R (+86.3) · D 6.5% · R 92.8%
- 2008→2024 swing
- -21.0pp toward R · 2008: -65.3pp · 2024: -86.3pp
- All cycles
- 2024: R+86.3 2020: R+82.9 2016: R+79.4 2012: R+76.2 2008: R+65.3
Not yet ingested
- Civics
- —
Market trends
- HPI YoY
- ▲ 5.52%
- Current HPI
- 109.8454
- Rent YoY
- —
- Metro
- —
- State GDP YoY
- ▲ 3.29%
- F500 in state
- 10
Industry mix (Fortune 500 HQ in LA)
| Industry | F500 HQs | Revenue |
|---|---|---|
| Telecommunications | 2 | $23B |
|
||
| Utilities | 1 | $12B |
|
||
| Wholesale / Distribution | 1 | $5B |
|
||
| Advertising | 1 | $2B |
|
||
Price history
+3500.0% since first listed3 events — show timeline
- 2026-04-30 Pending — SWLAR
- 2025-02-24 Listed $360,000 SWLAR
- 2004-08-02 Sold (Public Records) $10,000 Public Records
Property tax history
+51.3%/yrLatest (2025): $1,819 · +3.6% YoY. Source: county tax records.
Cash-flow waterfall
monthlySold comps — $/sqft
last 12 mo · ≤1 miLoading sold comps…