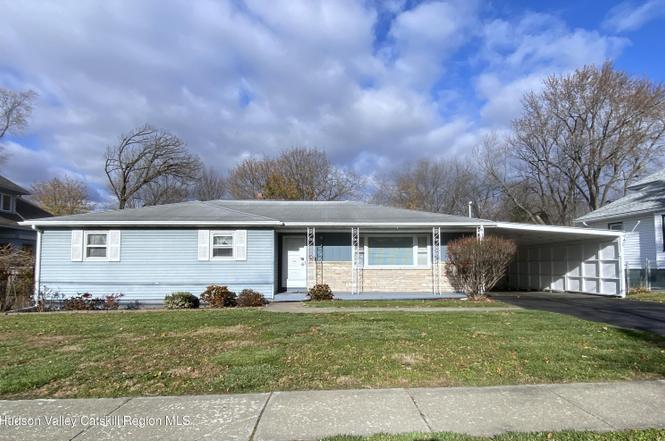
64 Glenwood Blvd · Hudson, NY
Flood risk 1/10 · Minimal
- FEMA flood zone
- X
- Chance of flooding over 30 yrs
- 0.0%
- Est. flood insurance / yr
- $473 – $860
Fire risk 4/10 · Minor
- Est. fire insurance / yr
- $691 – $1,283
Heat risk 4/10 · Minor
- Hot days now (above 98°F)
- 7 days/yr
- Hot days in 30 yrs
- 16 days/yr
Wind risk 3/10 · Minor
- Chance of severe wind over 30 yrs
- 8.0%
Air-quality risk 2/10 · Minimal
- Unhealthy air days now
- 0 days/yr
- Unhealthy air days in 30 yrs
- 1 days/yr
Risk factors via First Street. Map © Google.
Why this score? — see what drove the C grade
The composite is a weighted blend of 9 inputs, each scored 0–100. Each bar is that input's sub-score; the figure is the points it added to the 100-point composite (weight × sub-score).
- Cash flow +13.6/30.0
- ARV discount +12.2/15.0
- Appreciation +10.0/10.0
- Rent growth +5.0/5.0
- DSCR +4.1/10.0
- Schools +3.6/10.0
- Livability +3.5/5.0
- 1% rule +2.6/10.0
- Condition / age +2.5/5.0
$459,000
🖨 Deal sheet 📄 Offer letter ✓ Due diligence
Listing remarks
You've waited ever-so-patiently for a lovingly tended Hudson mid-century modern gem. .. and at long last, the home of your dreams has arrived! Originally crafted from the owner's own imagination and brought to life by a skilled local builder, this 1963 treasure has been pampered and adored for decades. Step through the formal foyer and see a vintage mural leading you into a bright, living room that flows effortlessly into the formal dining room and kitchen. An enchanting enclosed porch and inviting deck overlook the back yard—perfect for morning tea or chats with friends on summer nights. Down the hallway awaits a trio of bedrooms and a full bath bursting with authentic mid-century
Key facts
- Trio of bedrooms
- Inviting deck
- Full bath
Tags
Property features AI
Exterior
- Parking: Carport
- Utilities: Public water; Public sewer; Natural gas available and connected; Electricity connected (100 Amp service with circuit breakers and fuses); Cable available and connected
- Home design: Single Family Residence; One level / 1 story; Residential property
- Construction: Aluminum siding; Concrete perimeter foundation; Built with asphalt roofing
- Exterior features: Deck; Enclosed rear porch; Shed(s); Has a view; Asphalt roof
Interior
- Kitchen: Dishwasher; Range; Refrigerator; Freezer; Eat-in kitchen
- Bedrooms: 6 total rooms (bedroom count not specified)
- Flooring: Carpet; Hardwood; Linoleum; Tile; Vinyl
- Bathrooms: 1 full bathroom
- Heating & cooling: Ceiling fan(s); Wall/window unit(s); Baseboard heating; Hot water heating; Natural gas heating; Steam heating
- Interior features: Chandelier; Eat-in kitchen; Open floorplan; Insulated windows with blinds, drapes and screens; Double-pane windows; Window treatments
- Laundry & utility: Washer and Dryer; Laundry located in basement; Basement includes storage space and sump pump
Neighborhood map
What this means for you Summary
Snapshot
- This is a 3-bed/1.0-bath single-family listed at $459k.
Deal economics
- At list price, monthly cash flow is $25 ($304/yr) — positive.
- The deal already cash-flows at list — no discount required.
- To meet the 1% rule (rent ≥ 1% of price), the offer needs to be $350k (23.9% below list).
- Recommended offer: $350k (23.9% below list) — sets the bar for 1% rule.
- Cap rate 6.4% vs local median 3.3% in Hudson — top-decile yield for the area; either an underpriced asset or a hidden risk that comps aren't pricing in. Stress-test before assuming the spread holds.
Location & tenants
- Location reads 70/100 on livability (#430 in NY) — a middle-class / working-renter tenant base. Strengths: amenities A+, health & safety A+; Watch: schools C-, commute F, employment F.
- Hudson City School District (town): math 38% / reading 47% proficiency, ranked #494 of 590 in NY (top 84%) — families likely to look elsewhere, expect single-tenant / working-renter base with shorter leases.
- Market conditions: Rents rising fast (+10.9%/yr); 161 active listings in the ZIP; 4 comparable units currently listed for rent nearby; rentals at typical pace (median 24d on market — plan ~3-4 weeks tenant-placement turnaround); 136 units permitted in Columbia County in 2024 (0 in 5+ unit buildings).
- At $3,495/mo this rent would consume 58% of the median local household income ($73k/yr) (locally 1083% of renters already pay >50% of income on rent) — very limited rent-growth headroom before tenants either downsize or default.
Forward outlook
- In year one you build about $49k of equity ($3k loan paydown + $46k appreciation (10.0% local appreciation)).
- Columbia County population projected at -22% by 2050 — secular population decline; favor cash flow + early exit over multi-decade hold.
- At projected returns (10.0% appreciation + 8.0% rent growth), your $129k cash investment doubles in ~3 years — after that, you're playing with house money.
- By year 2, paydown + projected appreciation supports a ~$79k cash-out refi (75% LTV) — recoverable capital for the next deal without selling this one.
Negotiation context
- It's been on market 204 days — a 12% lower offer ($404k) is reasonable based on typical stale-listing flexibility.
Questions for the listing agent
- It's been on market 204 days. Have you received any prior offers? Is the seller open to a 24% concession, seller financing, or rate buy-down credit?
- Built in 1963 — when were the roof, HVAC, electrical panel, plumbing, and water heater last replaced?
- Why hasn't it sold? Are there any deal-killer items the seller is aware of (foundation, flood, title, zoning, code violations)?
- Is there a deadline driving the sale (1031 exchange, divorce, estate, relocation)? That informs how much negotiation room exists.
- What's the average days-on-market for RENTAL listings here right now (not sales)? A rising rental-DOM trend means longer vacancies and softer asking-rent achievability than the comps imply.
- What's the recent tenant-quality profile in this submarket — average credit score on applications, eviction rate, late-payment / NSF rate, and stable-employment percentage? A property-management company in the area should have these aggregated.
- How much new for-sale + rental construction is in the pipeline within 1–3 miles? Heavy new supply typically softens prices + rents 12–24 months out; constrained supply supports both.
Investment metrics
- 1% rule
- 0.76% ✗
- Cap rate
- 6.36%
- Cash-on-cash
- 0.24%
- DSCR
- 1.01
- GRM
- 10.9
CMA / ARV
- ARV (on-the-fly)
- $512,064
- Comps found
- 12
Show comp detail 12 sales within ~0.75 mi
| Address | Dist | Beds/Ba | Sqft | Sold | Price | $/sf | Match |
|---|---|---|---|---|---|---|---|
| 55-59 Fairview Ave | 0.22mi | 3/2.0 | 1,803 (+1%) | 6mo | $450,000 | $250 | 78 |
| 1 Carole Ln | 0.34mi | 3/2.5 | 1,781 (+0%) | 6mo | $379,500 | $213 | 73 |
| 28 Janis St | 0.51mi | 3/1.5 | 1,836 (+3%) | 3mo | $390,000 | $212 | 66 |
| 19 Aitken Avenue Ave | 0.33mi | 3/2.0 | 1,917 (+8%) | 4mo | $535,000 | $279 | 64 |
| 517 - 519 Washington St | 0.43mi | 3/2.5 | 1,864 (+5%) | 10mo | $787,500 | $422 | 58 |
| 517-519 Washington St | 0.44mi | 3/2.5 | 1,864 (+5%) | 10mo | $787,500 | $422 | 57 |
| 16 Oakwood Blvd | 0.23mi | 4/1.5 (+1) | 1,570 (-12%) | 8mo | $350,000 | $223 | 56 |
| 7 Mckinstry Pl | 0.35mi | 4/2.0 (+1) | 1,973 (+11%) | 7mo | $615,000 | $312 | 51 |
| 53 James Street St | 0.65mi | 4/2.5 (+1) | 1,825 (+3%) | 6mo | $396,718 | $217 | 49 |
| 5 Van Winkle Rd | 0.63mi | 2/3.0 (-1) | 1,820 (+2%) | 8mo | $525,000 | $288 | 47 |
| 24 8th St | 0.50mi | 3/1.0 | 1,528 (-14%) | 9mo | $595,000 | $389 | 46 |
| 445-447 Union St | 0.73mi | 3/2.5 | 2,000 (+12%) | 7mo | $1,435,000 | $718 | 33 |
Match score weights: distance 35% · size 25% · config 20% · recency 20%. Top-matched comps best support the ARV.
Projected returns pro-forma
10.0% appreciation · 8.0% rent growth · sell at horizon
- IRR
- 25.9%
- Equity multiple
- 3.10×
- Total profit
- $269,854
- Equity at exit
- $413,504
- IRR
- 24.0%
- Equity multiple
- 7.53×
- Total profit
- $838,740
- Equity at exit
- $891,736
Cash invested: $128,520 (down + closing). Projections, not guarantees.
Landlord ↔ Tenant lean methodology
- Overall (STATE)
- 15 Strongly Tenant-Friendly
- State New York
- 15 Strongly Tenant-Friendly · D+10
- County
- — inherits STATE
- City
- — inherits STATE
ZIP-level market 12534
- Home prices YoY
- 5.6%
- Rents YoY
- 10.9%
- Active inventory
- 161
- Price-to-rent
- 10.9×
Monthly cashflow live
- Estimated rent
- $3,495 medium interval (Pro) →
- Mortgage (P&I)
- −$2,407
- Tax from tax record
- −$138 /mo · $1,652/yr
- Insurance
- −$191
- HOA
- −$0
- Vacancy / Maint / Mgmt
- −$734
- Net cashflow
- $25
Break-even live
UW: 25.0% down · 7.5% · 30yr · 1.5% tax · 5.0% vac · 8.0% maint · 8.0% mgmt
Financing live
Cash to close
- Down payment
- $114,750
- Closing costs
- $13,770
- Reserves months
- —
- Total cash needed
- —
Loan-product check · same deal, 3 products live
Conventional
25% down · 7.5% · 30yr
- Down + closing
- —
- Monthly P&I
- —
- Monthly cashflow
- —
- DSCR
- —
- Eligible?
- —
Personal DTI + credit; lowest rate.
DSCR
20% down · 8.5% · 30yr
- Down + closing
- —
- Monthly P&I
- —
- Monthly cashflow
- —
- DSCR
- —
- Eligible?
- —
No personal income docs; deal must DSCR.
Hard money
10% down · 12.0% · 12mo
- Down + closing
- —
- Monthly P&I
- —
- Monthly cashflow
- —
- DSCR
- —
- Eligible?
- —
Short-term bridge; refi at stabilization.
Rent comps 4 comps
| Address | Beds | Baths | Sqft | Rent | $/sqft | DOM | Units | Dist |
|---|---|---|---|---|---|---|---|---|
| 437 State St Hudson, NY | 3.0 | 3.0 | 1800 | $8,000 | $4.44 | 43d | 1 | 0.61mi |
| 258 Warren St Hudson, NY | 3.0 | 2.0 | 2464 | $5,300 | $2.15 | 23d | 1 | 0.89mi |
| 227 Warren St Unit 3 Hudson, NY | 3.0 | 1.0 | 1400 | $2,600 | $1.86 | 23d | 1 | 0.96mi |
| 210 Allen St Hudson, NY | 2.0 | 1.0 | 1400 | $2,900 | $2.07 | 23d | 1 | 1.05mi |
Listing history 13 events
-
2026-06-12statusdays on market $459,000 Pending 204 DOM
-
2026-06-09days on market $459,000 Active Under Contract 203 DOM
-
2026-06-08days on market $459,000 Active Under Contract 202 DOM
-
2026-06-07days on market $459,000 Active Under Contract 201 DOM
-
2026-06-04days on market $459,000 Active Under Contract 197 DOM
-
2026-06-02days on market $459,000 Active Under Contract 196 DOM
-
2026-06-01days on market $459,000 Active Under Contract 195 DOM
-
2026-05-31days on market $459,000 Active Under Contract 194 DOM
-
2026-05-31days on market $459,000 Active Under Contract 193 DOM
-
2026-04-22historical Active Under Contract
-
2026-03-27price $459,000
-
2026-01-06price $479,000
-
2025-11-18$499,000 Active
ⓘ Source: listings_history table (triggers on properties + properties_extension) + one-shot
backfill from property_details.listing_events for pre-trigger history.
Tax reassessment forecast NY · Partial reset (capped growth)
- Current annual tax
- $1,652 · $138/mo
- Projected year-2 tax
- $4,704 · $392/mo
- Expected delta
- +$3,053/yr (+$254/mo · 184.8%)
ⓘ Screening estimate from a state-policy table — verify with the county assessor before closing.
Climate risk First Street
- Flood 1/10 Low FEMA zone X · 0% chance over 30 yrs
- Wildfire 4/10 Moderate
- Heat 4/10 Moderate 7 d/yr ≥98°F today · 16 d/yr by 30 yrs out
- Wind 3/10 Moderate 8% chance of damaging wind over 30 yrs
- Air quality 2/10 Low 0 unhealthy d/yr today · 1 by 30 yrs out
Nearby sold comps map
Loading sold comps map…
Walkable amenities ~0.75 mi
Loading nearby amenities…
Taxation est. · year 1
- Rental income
- $41,943
- − Mortgage interest
- −$25,711
- − Property taxes
- −$1,652
- − Insurance
- −$2,295
- − Repairs & maintenance
- −$3,355
- − Management
- −$3,355
- − Depreciation
- −$13,353
- Taxable loss
- −$7,778
- Est. tax savings @ 24.0%
- +$1,867
- After-tax cash flow
- $2,171/yr
For passive investors: Depreciation is non-cash, so a rental often shows a tax loss while cash-flowing — sheltering income. Rental losses are passive: they offset passive income freely, and up to $25,000/yr can offset ordinary (W-2) income if you actively participate and your MAGI is under $100k (phasing out to $0 by $150k); unused losses carry forward. On sale, claimed depreciation is recaptured at up to 25%, and gains may owe capital-gains tax (a 1031 exchange can defer both). Figures are a year-1 estimate at your 24.0% rate — not tax advice; consult a CPA.
Schools (NCES district)
- District
- Hudson City School District
- NCES district ID
- 3614940
- Math proficiency
- 38% ▲ 4.00%
- Reading proficiency
- 47% ▲ 7.00%
- Median HH income
- $44,663
- Composite
- 36.03/100
- National rank
- #4779
- State rank
- #494 of 590 in NY
Livability — Hudson
- Score
- 70/100
- State rank
- #430
- US rank
- #7443
Category grades
Schools grade is shown separately in the Schools card above.
Census & demographics
- Census place
- Hudson, NY
- County
- Columbia County · 17,176 people
- City population
- 17,176
- Metro
- Hudson, NY
- Population (ZIP)
- 17,176
- Household income
- $72,741
- Rent vs Own
- Severe rent burden
- 1083.0
Population outlook (Columbia County) Hauer SSP2
- Today (2025)
- 58,662 people
- By 2030
- 56,557 · -3.6%
- By 2040
- 51,324 · -12.5%
- By 2050
- 45,790 · -21.9%
- By 2075
- 35,232 · -39.9%
- By 2100
- 25,846 · -55.9%
Race, ethnicity, and origin ACS 2023
- Neighborhood character
- Predominantly White (74%)
- Race & ethnicity
- White 74% Two or more races 7% Black 7% Hispanic / Latino 7% Asian 6%
- Hispanic origin (detail)
- Mexican 2% Puerto Rican 1%
- Common ancestry
- Lithuanian 4% Romanian 4% Iranian 3%
- Foreign-born
- 10% · Canada, China
- Languages at home
- 88% English-only · Spanish 5% Other Indo-European 3% Chinese 1%
Political lean MEDSL · Columbia
- 2024 margin
- D (+14.7) · D 57.4% · R 42.6%
- 2008→2024 swing
- +1.3pp toward D · 2008: 13.4pp · 2024: 14.7pp
- All cycles
- 2024: D+14.7 2020: D+16.7 2016: D+1.4 2012: D+11.7 2008: D+13.4
Not yet ingested
- Civics
- —
Market trends
- HPI YoY
- ▲ 25.98%
- Current HPI
- 490.0412
- Rent YoY
- ▲ 10.88%
- Metro
- Hudson, NY
- State GDP YoY
- ▲ 2.60%
- F500 in state
- 92
Industry mix (Fortune 500 HQ in NY)
| Industry | F500 HQs | Revenue |
|---|---|---|
| Financial Services | 10 | $950B |
|
||
| Consumer Goods | 9 | $162B |
|
||
| Insurance | 4 | $225B |
|
||
| Telecommunications | 2 | $144B |
|
||
| Pharmaceuticals | 2 | $112B |
|
||
| Media / Entertainment | 2 | $69B |
|
||
Price history
-8.0% since first listed4 events — show timeline
- 2026-04-22 Contingent — HVCRMLS
- 2026-03-27 Price Changed $459,000 HVCRMLS
- 2026-01-06 Price Changed $479,000 HVCRMLS
- 2025-11-18 Listed $499,000 HVCRMLS
Property tax history
+17.5%/yrLatest (2025): $1,652 · -3.9% YoY. Source: county tax records.
Cash-flow waterfall
monthlySold comps — $/sqft
last 12 mo · ≤1 miLoading sold comps…