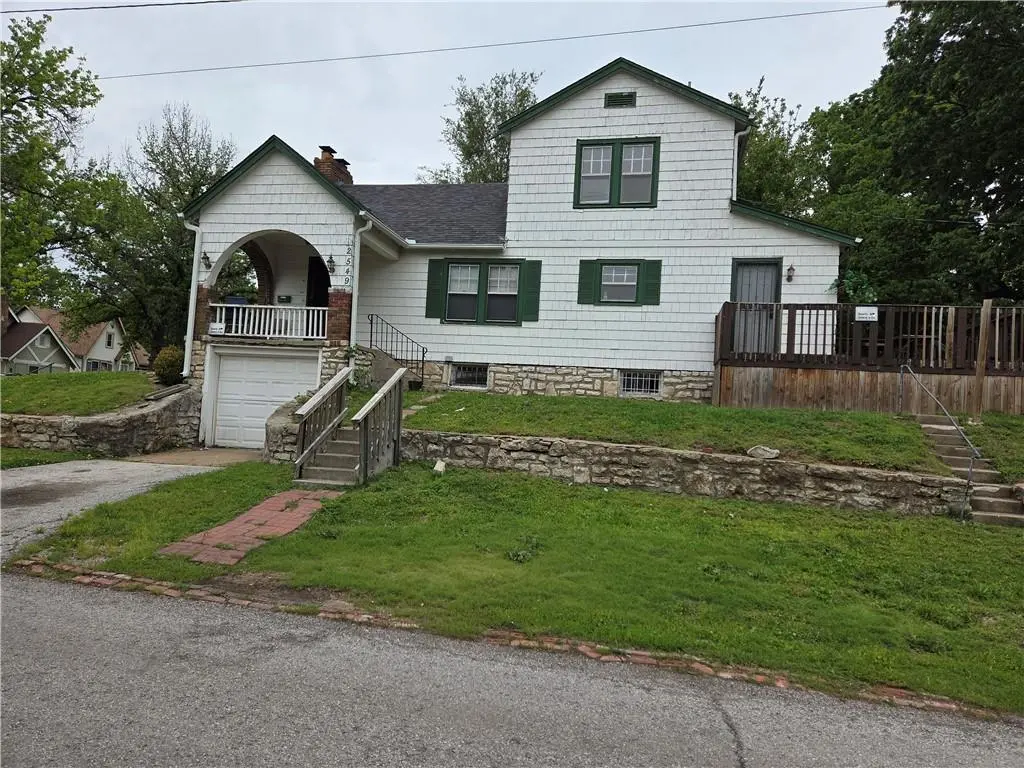
2549 Drury Ave · Kansas City, MO
Flood risk 1/10 · Minimal
- FEMA flood zone
- X (unshaded)
- Chance of flooding over 30 yrs
- 0.0%
- Est. flood insurance / yr
- $473 – $860
Fire risk 1/10 · Minimal
- Est. fire insurance / yr
- $1,054 – $1,958
Heat risk 4/10 · Minor
- Hot days now (above 106°F)
- 7 days/yr
- Hot days in 30 yrs
- 17 days/yr
Wind risk 2/10 · Minimal
- Chance of severe wind over 30 yrs
- —
Air-quality risk 3/10 · Minor
- Unhealthy air days now
- 2 days/yr
- Unhealthy air days in 30 yrs
- 3 days/yr
Risk factors via First Street. Map © Google.
Why this score? — see what drove the B grade
The composite is a weighted blend of 9 inputs, each scored 0–100. Each bar is that input's sub-score; the figure is the points it added to the 100-point composite (weight × sub-score).
- Cash flow +30.0/30.0
- ARV discount +11.0/15.0
- DSCR +10.0/10.0
- 1% rule +8.3/10.0
- Livability +3.9/5.0
- Rent growth +2.7/5.0
- Condition / age +2.5/5.0
- Schools +1.5/10.0
- Appreciation +1.1/10.0
$99,000
🖨 Deal sheet 📄 Offer letter ✓ Due diligence
Listing remarks MLS
Great investment opportunity! Property Sold AS-IS. .. Need a little TLC.
Key facts
- 6,100 sq ft lot
- Garage
- Built 1933
Property features AI
Finance
- Financial info: Annual tax amount reported (not included in output per instructions)
Exterior
- Parking: Off-street parking; Basement garage entrance; 1-car garage
- Utilities: Public water; Public sewer
- Home design: Single-family residence; 1.5-story floor plan
- Construction: Board & batten siding; Composition roof
- Exterior features: Deck; Corner lot in city limits; Property listed as fixer / fixer-up condition; Fireplace screen
Interior
- Kitchen: Kitchen with adjacent breakfast room and formal dining area
- Bedrooms: 3 bedrooms (main and second levels; main floor primary bedroom included)
- Flooring: Laminate flooring; Wood flooring
- Bathrooms: 1 full bathroom; 1 half bathroom
- Heating & cooling: Forced air heating; Electric cooling
- Interior features: Expandable attic; Living room with fireplace (1 fireplace)
- Laundry & utility: Laundry in basement
Neighborhood map
What this means for you Summary
Snapshot
- This is a 3-bed/1.5-bath single-family listed at $99k.
Deal economics
- At list price, monthly cash flow is $428 ($5k/yr) — positive.
- The deal already cash-flows at list — no discount required.
- Meets the 1% rule at list price ($1k rent vs $99k).
- Recommended offer: $98k (1.5% below list) — sets the bar for market timing.
- Cap rate 11.5% vs local median 3.9% in Kansas City — top-decile yield for the area; either an underpriced asset or a hidden risk that comps aren't pricing in. Stress-test before assuming the spread holds.
Location & tenants
- Location reads 78/100 on livability (#28 in MO, #2,671 nationally) — a middle-class / working-renter tenant base. Strengths: amenities A+, commute A+, cost of living A+; Watch: schools C-, crime F.
- Kansas City 33 (urban): math 12% / reading 24% proficiency, ranked #308 of 324 in MO (top 95%) — low school quality limits family demand, transient renter base, plan for 1-2y turnover; 75% free/reduced lunch — lower-income household profile, screen leases tightly.
- Market conditions: Rents flat; 108 active listings in the ZIP; 17 comparable units currently listed for rent nearby; rentals at typical pace (median 16d on market — plan ~3-4 weeks tenant-placement turnaround); lower-income renter base — watch delinquency; 4,002 units permitted in Jackson County in 2024 (2,271 in 5+ unit buildings).
- At $1,318/mo this rent would consume 48% of the median local household income ($33k/yr) (locally 1943% of renters already pay >50% of income on rent) — very limited rent-growth headroom before tenants either downsize or default.
Forward outlook
- Local home prices are declining (-3.0%/yr); year-one equity from $684 of loan paydown is wiped out by about $3k of value loss. Plan a longer hold.
- Jackson County population projected at +4% by 2050 — modest demand growth; plan on rents tracking national, not racing it.
- At projected returns (-3.0% appreciation + 0.9% rent growth), your $28k cash investment doubles in ~8 years — after that, you're playing with house money.
Negotiation context
- It's been on market 23 days — a 2% lower offer ($98k) is reasonable based on typical stale-listing flexibility.
- 5 sale attempts since 15y ago with the ask held roughly flat each time — persistent listings suggest the price (not the market) is what's stuck; bring a comps-based counter.
- Current owner paid $45k; list at $99k implies a 118% gain — meaningful room to come down on a strong offer.
Risks & watch-outs
- Watch-outs: built in 1933 — expect roof / HVAC / electrical / plumbing capex.
Questions for the listing agent
- Built in 1933 — when were the roof, HVAC, electrical panel, plumbing, and water heater last replaced?
- Is there a deadline driving the sale (1031 exchange, divorce, estate, relocation)? That informs how much negotiation room exists.
- Crime grade is F in this area — have there been break-ins, vandalism, or insurance claims at this property in the last 3 years? What carrier currently insures it and at what premium?
- What's the average days-on-market for RENTAL listings here right now (not sales)? A rising rental-DOM trend means longer vacancies and softer asking-rent achievability than the comps imply.
- What's the recent tenant-quality profile in this submarket — average credit score on applications, eviction rate, late-payment / NSF rate, and stable-employment percentage? A property-management company in the area should have these aggregated.
- How much new for-sale + rental construction is in the pipeline within 1–3 miles? Heavy new supply typically softens prices + rents 12–24 months out; constrained supply supports both.
Investment metrics
- 1% rule
- 1.33% ✓
- Cap rate
- 11.49%
- Cash-on-cash
- 18.55%
- DSCR
- 1.83
- GRM
- 6.3
CMA / ARV
- ARV (median comp)
- $107,250
- List price
- $99,000
- Delta
- -7.69%
- Verdict
- FAIR
- Comps
- 20 within 1.0 mi
Show comp detail 12 sales within ~0.75 mi
| Address | Dist | Beds/Ba | Sqft | Sold | Price | $/sf | Match |
|---|---|---|---|---|---|---|---|
| 2604 Drury Ave | 0.04mi | 3/1.5 | 1,287 (-2%) | 7mo | $70,000 | $54 | 89 |
| 2457 Poplar Ave | 0.38mi | 3/1.0 | 1,350 (+3%) | 2mo | $115,000 | $85 | 73 |
| 2831 Van Brunt Blvd | 0.32mi | 3/2.0 | 1,344 (+2%) | 9mo | $139,900 | $104 | 71 |
| 2542 Drury St | 0.03mi | 2/1.0 (-1) | 1,184 (-10%) | 9mo | $86,500 | $73 | 68 |
| 5414 E 23rd St | 0.38mi | 3/1.0 | 1,292 (-1%) | 13mo | $79,500 | $62 | 67 |
| 2451 Chelsea Ave | 0.45mi | 3/1.0 | 1,156 (-12%) | 5mo | $59,000 | $51 | 53 |
| 5410 E 28th St | 0.23mi | 3/2.0 | 1,126 (-14%) | 14mo | $166,000 | $147 | 52 |
| 2722 Brighton Ave | 0.39mi | 4/1.5 (+1) | 1,168 (-11%) | 9mo | $120,000 | $103 | 51 |
| 2416 Brighton Ave | 0.41mi | 3/1.5 | 1,122 (-14%) | 9mo | $90,000 | $80 | 50 |
| 2424 Cypress Ave | 0.69mi | 3/1.0 | 1,169 (-11%) | 5mo | $110,000 | $94 | 44 |
| 2739 Elmwood Ave | 0.61mi | 4/1.5 (+1) | 1,200 (-8%) | 15mo | $135,000 | $113 | 40 |
| 3021 Topping Ave | 0.62mi | 2/1.0 (-1) | 1,140 (-13%) | 10mo | $139,000 | $122 | 34 |
Match score weights: distance 35% · size 25% · config 20% · recency 20%. Top-matched comps best support the ARV.
Projected returns pro-forma
-3.0% appreciation · 0.94% rent growth · sell at horizon
- IRR
- 8.0%
- Equity multiple
- 1.31×
- Total profit
- $8,542
- Equity at exit
- $14,761
- IRR
- 15.6%
- Equity multiple
- 2.15×
- Total profit
- $31,933
- Equity at exit
- $8,560
Cash invested: $27,720 (down + closing). Projections, not guarantees.
Landlord ↔ Tenant lean methodology
- Overall (STATE)
- 81 Strongly Landlord-Friendly
- State Missouri
- 81 Strongly Landlord-Friendly · R+10
- County
- — inherits STATE
- City
- — inherits STATE
ZIP-level market 64127
- Home prices YoY
- -2.6%
- Rents YoY
- 0.9%
- Active inventory
- 108
- Price-to-rent
- 6.3×
Monthly cashflow live
- Estimated rent
- $1,318 high interval (Pro) →
- Mortgage (P&I)
- −$519
- Tax from tax record
- −$53 /mo · $632/yr
- Insurance
- −$41
- HOA
- −$0
- Vacancy / Maint / Mgmt
- −$277
- Net cashflow
- $428
Break-even live
UW: 25.0% down · 7.5% · 30yr · 1.5% tax · 5.0% vac · 8.0% maint · 8.0% mgmt
Financing live
Cash to close
- Down payment
- $24,750
- Closing costs
- $2,970
- Reserves months
- —
- Total cash needed
- —
Loan-product check · same deal, 3 products live
Conventional
25% down · 7.5% · 30yr
- Down + closing
- —
- Monthly P&I
- —
- Monthly cashflow
- —
- DSCR
- —
- Eligible?
- —
Personal DTI + credit; lowest rate.
DSCR
20% down · 8.5% · 30yr
- Down + closing
- —
- Monthly P&I
- —
- Monthly cashflow
- —
- DSCR
- —
- Eligible?
- —
No personal income docs; deal must DSCR.
Hard money
10% down · 12.0% · 12mo
- Down + closing
- —
- Monthly P&I
- —
- Monthly cashflow
- —
- DSCR
- —
- Eligible?
- —
Short-term bridge; refi at stabilization.
Rent comps 17 comps
| Address | Beds | Baths | Sqft | Rent | $/sqft | DOM | Units | Dist |
|---|---|---|---|---|---|---|---|---|
| 5108 E 30th St Kansas City, MO | 3.0 | 1.0 | 960 | $1,400 | $1.46 | 3d | 1 | 0.54mi |
| 5852 E 20th St Unit TOP-1724 Kansas City, MO | 3.0 | 1.5 | 1482 | $1,075 | $0.73 | 3d | 1 | 0.67mi |
| 3032 Elmwood Ave Kansas City, MO | 3.0 | 1.0 | 1027 | $1,275 | $1.24 | 7d | 1 | 0.82mi |
| 3243 Denver Dr Kansas City, MO | 1.0–3.0 | 1.0 | 862 | $1,226 | $1.42 | 43d | 1 | 0.83mi |
| 2424 Norton Ave Unit B Kansas City, MO | 3.0 | 1.0 | 982 | $1,150 | $1.17 | 16d | 1 | 0.90mi |
| 1812 Elmwood Ave Kansas City, MO | 3.0 | 1.0 | 1650 | $1,600 | $0.97 | 16d | 1 | 0.97mi |
| 1905 Kensington Ave Kansas City, MO | 3.0 | 2.0 | 1285 | $1,325 | $1.03 | 23d | 1 | 0.97mi |
| 2846 Myrtle Ave Kansas City, MO | 3.0 | 2.0 | 1705 | $1,350 | $0.79 | 16d | 1 | 1.02mi |
| 1805 Jackson Ave Kansas City, MO | 4.0 | 2.0 | 1250 | $1,250 | $1.00 | 43d | 1 | 1.11mi |
| 1603 Elmwood Ave Kansas City, MO | 2.0 | 1.0 | 1064 | $1,031 | $0.97 | 12d | 1 | 1.12mi |
| 3414 Elmwood Ave Kansas City, MO | 4.0 | 1.0 | 1109 | $1,300 | $1.17 | 16d | 1 | 1.19mi |
| 2419 Bales Ave Kansas City, MO | 3.0 | 1.5 | 1116 | $1,500 | $1.34 | 3d | 1 | 1.24mi |
| 3332 Norton Ave Kansas City, MO | 3.0 | 1.0 | 1272 | $1,350 | $1.06 | 43d | 1 | 1.31mi |
| 2413 College Ave Kansas City, MO | 2.0 | 2.0 | 1022 | $1,225 | $1.20 | 23d | 1 | 1.38mi |
| 6237 E 12th St Kansas City, MO | 2.0 | 1.0 | 1580 | $1,150 | $0.73 | 43d | 1 | 1.45mi |
| 3305 Askew Ave Kansas City, MO | 3.0 | 1.5 | 1428 | $1,450 | $1.02 | 23d | 1 | 1.47mi |
| 3220 E 30th St Unit 1A Kansas City, MO | 2.0 | 1.0 | 1214 | $950 | $0.78 | 43d | 1 | 1.47mi |
Listing history 19 events
-
2026-06-18days on market $99,000 Active 23 DOM
-
2026-06-17days on market $99,000 Active 22 DOM
-
2026-06-16days on market $99,000 Active 21 DOM
-
2026-06-16status $99,000 Active 20 DOM
-
2026-05-09$99,000 Active 653-char remark
-
2026-05-07historical $99,000 653-char remark
-
2018-04-24soldstatus
-
2018-04-23soldstatus Sold 72-char remark
Show marketing remark (72 chars)
Great investment opportunity! Property Sold AS-IS. .. Need a little TLC.
-
2018-04-17status Pending 72-char remark
Show marketing remark (72 chars)
Great investment opportunity! Property Sold AS-IS. .. Need a little TLC.
-
2018-02-28status Active 72-char remark
Show marketing remark (72 chars)
Great investment opportunity! Property Sold AS-IS. .. Need a little TLC.
-
2018-01-04historical 72-char remark
Show marketing remark (72 chars)
Great investment opportunity! Property Sold AS-IS. .. Need a little TLC.
-
2017-12-27price $37,000 72-char remark
Show marketing remark (72 chars)
Great investment opportunity! Property Sold AS-IS. .. Need a little TLC.
-
2017-12-12$40,000 Active 72-char remark
Show marketing remark (72 chars)
Great investment opportunity! Property Sold AS-IS. .. Need a little TLC.
-
2011-03-24soldstatus
Show marketing remark (237 chars)
3 Bedrooms, 1 Full Bath and 1 Half bath. Basement and One Car Garage with Deck Off the Back. Could be Great Home with Some Repairs needed on Exterior and Interior. Property selling AS-IS. Inspections Welcome, but No Repairs Will Be Made.
-
2011-02-23soldstatus
-
2011-02-04$17,900
Show marketing remark (237 chars)
3 Bedrooms, 1 Full Bath and 1 Half bath. Basement and One Car Garage with Deck Off the Back. Could be Great Home with Some Repairs needed on Exterior and Interior. Property selling AS-IS. Inspections Welcome, but No Repairs Will Be Made.
-
2003-08-18soldstatus $45,400
-
2003-08-18soldstatus
-
1989-09-14soldstatus
ⓘ Source: listings_history table (triggers on properties + properties_extension) + one-shot
backfill from property_details.listing_events for pre-trigger history.
Tax reassessment forecast MO · Resets to sale price
- Current annual tax
- $632 · $53/mo
- Projected year-2 tax
- $960 · $80/mo
- Expected delta
- +$328/yr (+$27/mo · 51.9%)
ⓘ Screening estimate from a state-policy table — verify with the county assessor before closing.
Climate risk First Street
- Flood 1/10 Low FEMA zone X (unshaded) · 0% chance over 30 yrs
- Wildfire 1/10 Low
- Heat 4/10 Moderate 7 d/yr ≥106°F today · 17 d/yr by 30 yrs out
- Wind 2/10 Low
- Air quality 3/10 Moderate 2 unhealthy d/yr today · 3 by 30 yrs out
Nearby sold comps map
Loading sold comps map…
Walkable amenities ~0.75 mi
Loading nearby amenities…
Taxation est. · year 1
- Rental income
- $15,820
- − Mortgage interest
- −$5,546
- − Property taxes
- −$632
- − Insurance
- −$495
- − Repairs & maintenance
- −$1,266
- − Management
- −$1,266
- − Depreciation
- −$2,880
- Taxable income
- $3,736
- Est. tax owed @ 24.0%
- −$897
- After-tax cash flow
- $4,244/yr
For passive investors: Depreciation is non-cash, so a rental often shows a tax loss while cash-flowing — sheltering income. Rental losses are passive: they offset passive income freely, and up to $25,000/yr can offset ordinary (W-2) income if you actively participate and your MAGI is under $100k (phasing out to $0 by $150k); unused losses carry forward. On sale, claimed depreciation is recaptured at up to 25%, and gains may owe capital-gains tax (a 1031 exchange can defer both). Figures are a year-1 estimate at your 24.0% rate — not tax advice; consult a CPA.
Schools (NCES district)
- District
- Kansas City 33
- NCES district ID
- 2916400
- Math proficiency
- 12% ▼ -8.00%
- Reading proficiency
- 24% ▬ 0.00%
- Median HH income
- $35,227
- Composite
- 14.8/100
- National rank
- #9387
- State rank
- #308 of 324 in MO
Livability — Kansas City
- Score
- 78/100
- State rank
- #28
- US rank
- #2671
Category grades
Schools grade is shown separately in the Schools card above.
Census & demographics
- Census place
- Kansas City, MO
- County
- Jackson County · 687,798 people
- City population
- 439,467
- Metro
- Kansas City, MO-KS
- Population (ZIP)
- 17,668
- Household income
- $33,111
- Rent vs Own
- Severe rent burden
- 1943.0
Population outlook (Jackson County) Hauer SSP2
- Today (2025)
- 719,589 people
- By 2030
- 731,456 · +1.6%
- By 2040
- 746,689 · +3.8%
- By 2050
- 749,289 · +4.1%
- By 2075
- 736,227 · +2.3%
- By 2100
- 668,210 · -7.1%
Race, ethnicity, and origin ACS 2023
- Neighborhood character
- Diverse neighborhood (Simpson 0.65)
- Race & ethnicity
- Black 42% Hispanic / Latino 40% Two or more races 13% White 12% Native American 1%
- Hispanic origin (detail)
- Mexican 28%
- Foreign-born
- 20% · Canada, Vietnam
- Languages at home
- 67% English-only · Spanish 29%
Political lean MEDSL · Jackson
- 2024 margin
- D (+19.3) · D 58.9% · R 39.5% · Other 1.6%
- 2008→2024 swing
- -6.1pp toward R · 2008: 25.4pp · 2024: 19.3pp
- All cycles
- 2024: D+19.3 2020: D+22.0 2016: D+16.6 2012: D+19.0 2008: D+25.4
Not yet ingested
- Civics
- —
Market trends
- HPI YoY
- ▼ -7.88%
- Current HPI
- 289.2468
- Rent YoY
- ▲ 0.94%
- Metro
- Kansas City, MO-KS
- State GDP YoY
- ▲ 1.84%
- F500 in state
- 20
Industry mix (Fortune 500 HQ in MO)
| Industry | F500 HQs | Revenue |
|---|---|---|
| Healthcare | 1 | $163B |
|
||
| Insurance | 1 | $21B |
|
||
| Industrial Technology | 1 | $17B |
|
||
| Retail | 1 | $16B |
|
||
| Industrial Distribution | 1 | $10B |
|
||
| Utilities | 1 | $9B |
|
||
Price history
+118.1% since first listed17 events — show timeline
- 2026-06-15 Relisted — Heartland MLS as Distributed by MLS Grid
- 2026-05-28 Pending — Heartland MLS as Distributed by MLS Grid
- 2026-05-09 Listed $99,000 Heartland MLS as Distributed by MLS Grid
- 2026-05-07 Coming Soon $99,000 Heartland MLS as Distributed by MLS Grid
- 2018-04-24 Sold (Public Records) — Public Records
- 2018-04-23 Sold (MLS) — Heartland MLS as Distributed by MLS Grid
- 2018-04-17 Pending — Heartland MLS as Distributed by MLS Grid
- 2018-02-28 Relisted — Heartland MLS as Distributed by MLS Grid
- 2018-01-04 Listing Removed — Heartland MLS as Distributed by MLS Grid
- 2017-12-27 Price Changed $37,000 Heartland MLS as Distributed by MLS Grid
- 2017-12-12 Listed $40,000 Heartland MLS as Distributed by MLS Grid
- 2011-03-24 Sold (MLS) — Heartland MLS as Distributed by MLS Grid
- 2011-02-23 Sold (Public Records) — Public Records
- 2011-02-04 Listed $17,900 Heartland MLS as Distributed by MLS Grid
- 2003-08-18 Sold (Public Records) — Public Records
- 2003-08-18 Sold (Public Records) $45,400 Public Records
- 1989-09-14 Sold (Public Records) — Public Records
Property tax history
+3.8%/yrLatest (2025): $632 · -6.7% YoY. Source: county tax records.
Cash-flow waterfall
monthlySold comps — $/sqft
last 12 mo · ≤1 miLoading sold comps…