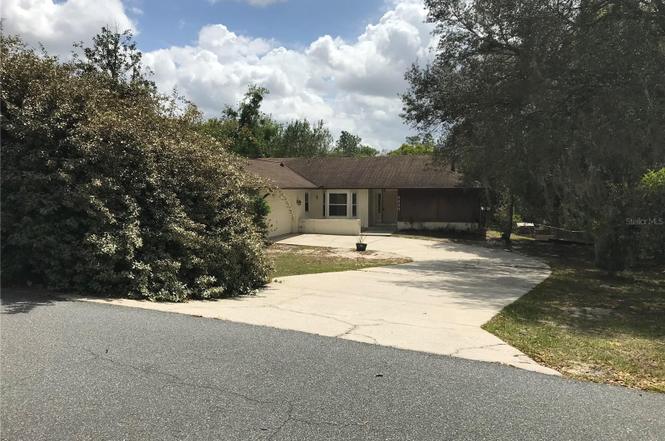
5830 W Spicey Hill Dr · Homosassa Springs, FL
Flood risk 1/10 · Minimal
- FEMA flood zone
- X (unshaded)
- Chance of flooding over 30 yrs
- 0.0%
- Est. flood insurance / yr
- $507 – $1,088
Fire risk 6/10 · Moderate
- Est. fire insurance / yr
- $947 – $1,759
Heat risk 9/10 · Severe
- Hot days now (above 108°F)
- 7 days/yr
- Hot days in 30 yrs
- 24 days/yr
Wind risk 9/10 · Severe
- Chance of severe wind over 30 yrs
- 99.0%
Air-quality risk 1/10 · Minimal
- Unhealthy air days now
- 0 days/yr
- Unhealthy air days in 30 yrs
- 0 days/yr
Risk factors via First Street. Map © Google.
Why this score? — see what drove the B- grade
The composite is a weighted blend of 9 inputs, each scored 0–100. Each bar is that input's sub-score; the figure is the points it added to the 100-point composite (weight × sub-score).
- Cash flow +25.7/30.0
- ARV discount +15.0/15.0
- DSCR +8.6/10.0
- 1% rule +6.0/10.0
- Schools +4.1/10.0
- Livability +3.6/5.0
- Rent growth +2.5/5.0
- Condition / age +2.5/5.0
- Appreciation +0.0/10.0
$189,900
🖨 Deal sheet 📄 Offer letter ✓ Due diligence
Listing remarks
CASH or HARD MONEY only! INVESTOR opportunity to turn this fixer-upper into a lovely 3/2 pool home. Property sits on over half acre lot in quiet subdivision. View from the back deck overlooks large in ground concrete pool, big back yard and beyond that woods. The kitchen features a granite island and elsewhere tile counter tops. There is a breakfast area and also a formal dining room. The large great room leads out to an enclosed sunroom all with a view of the woods and large pool. Garage has been partially converted, but can easily be turned back into a functioning 2 car garage. HVAC replaced 2017.Some windows replaced 2020. Solar panels installed 2017 and they are owned NOT LEASED. There
Key facts
- Tile counter tops
- Enclosed sunroom
- Granite island
Tags
Property features AI
Finance
- Other: Property type: Residential — Single family residence; Lot size approximately 0.8 acres (72 x 280); Private in-ground gunite pool; Zoning: LDR
- HOA & community: Pets allowed
Exterior
- Parking: Attached 2-car garage
- Utilities: Public water; Septic tank; Cable available; Broadband/high-speed internet available; Electricity available
- Home design: Single family residence; One story; Faces southeast; Condition: Fixer
- Construction: Block and concrete construction; Shingle roof; Block foundation; Built as single-level home
- Exterior features: Deck; Sliding doors; Chain link fencing; Shed(s); Mature landscaping with trees; Oversized, landscaped and paved lot (in county)
Interior
- Kitchen: Dishwasher; Eat-in kitchen with stone counters
- Bedrooms: 3 bedrooms
- Flooring: Ceramic tile; Concrete; Laminate
- Bathrooms: 2 full bathrooms
- Heating & cooling: Central heating (electric); Central air conditioning
- Interior features: Ceiling fans; Eat-in kitchen; Stone counters; Walk-in closets; Blinds on windows; Family room; Formal dining room (separate); Great room; Inside utility
- Laundry & utility: Inside laundry
Neighborhood map
What this means for you Summary
Snapshot
- This is a 3-bed/2.0-bath single-family listed at $190k.
Deal economics
- At list price, monthly cash flow is $453 ($5k/yr) — positive.
- The deal already cash-flows at list — no discount required.
- Meets the 1% rule at list price ($2k rent vs $190k).
- Cap rate 9.2% vs local median 5.9% in Homosassa Springs — top-decile yield for the area; either an underpriced asset or a hidden risk that comps aren't pricing in. Stress-test before assuming the spread holds.
Location & tenants
- Location reads 71/100 on livability (#391 in FL) — a middle-class / working-renter tenant base. Strengths: cost of living A+, housing A+, health & safety A+; Watch: crime C-, amenities F, commute F.
- Citrus (rural): math 49% / reading 50% proficiency, ranked #44 of 73 in FL (top 60%) — families likely to look elsewhere, expect single-tenant / working-renter base with shorter leases.
- Zoned schools: Rock Crusher Elementary School (math 70% / reading 56%, grade B, #582 of 2,144 statewide, top 28%, 665 students, 68% FRL); Crystal River High School (math 31% / reading 44%, grade F, #336 of 667 statewide, top 51%, 1,249 students, 56% FRL) — zoned schools at 62% FRL track the district average.
- Market conditions: 307 active listings in the ZIP; 3 comparable units currently listed for rent nearby; rentals at typical pace (median 21d on market — plan ~3-4 weeks tenant-placement turnaround); 2,443 units permitted in Citrus County in 2024 (0 in 5+ unit buildings).
- At $2,089/mo this rent would consume 55% of the median local household income ($46k/yr) (locally 113% of renters already pay >50% of income on rent) — very limited rent-growth headroom before tenants either downsize or default.
Forward outlook
- Local home prices are declining (-3.0%/yr); year-one equity from $1k of loan paydown is wiped out by about $6k of value loss. Plan a longer hold.
- Citrus County population projected to shrink 10% by 2050 — rents likely to lag national; underwrite the cash flow, not the appreciation.
Negotiation context
- Only 9 days on market — expect competitive offers; lowballing is unlikely to land.
- 3 sale attempts since 22y ago with the ask held roughly flat each time — persistent listings suggest the price (not the market) is what's stuck; bring a comps-based counter.
- Current owner paid $134k; 42% above their basis — modest negotiation headroom, anchor on the comps not their cost.
Risks & watch-outs
- Climate carrying-cost: severe wind risk, 99% chance of damaging wind over 30y; major wildfire risk; extreme-heat days projected 7→24/yr by 2055 (HVAC capex compounding) — expect insurance premiums to compound above CPI over the hold.
Questions for the listing agent
- Is there a deadline driving the sale (1031 exchange, divorce, estate, relocation)? That informs how much negotiation room exists.
- Schools are F-rated, which usually means shorter tenancies and higher turnover. Who's the typical renter profile here, and what's been the actual vacancy rate?
- What's the average days-on-market for RENTAL listings here right now (not sales)? A rising rental-DOM trend means longer vacancies and softer asking-rent achievability than the comps imply.
- What's the recent tenant-quality profile in this submarket — average credit score on applications, eviction rate, late-payment / NSF rate, and stable-employment percentage? A property-management company in the area should have these aggregated.
- How much new for-sale + rental construction is in the pipeline within 1–3 miles? Heavy new supply typically softens prices + rents 12–24 months out; constrained supply supports both.
Investment metrics
- 1% rule
- 1.10% ✓
- Cap rate
- 9.16%
- Cash-on-cash
- 10.23%
- DSCR
- 1.46
- GRM
- 7.6
CMA / ARV
- ARV (on-the-fly)
- $298,566
- Comps found
- 9
Show comp detail 9 sales within ~0.75 mi
| Address | Dist | Beds/Ba | Sqft | Sold | Price | $/sf | Match |
|---|---|---|---|---|---|---|---|
| 5717 W Nobis Cir | 0.15mi | 3/2.0 | 2,060 (+12%) | 2mo | $385,000 | $187 | 72 |
| 5543 W Nobis Cir | 0.29mi | 3/2.0 | 1,791 (-3%) | 12mo | $475,000 | $265 | 72 |
| 5638 W Paprika Loop | 0.13mi | 3/2.0 | 1,631 (-12%) | 6mo | $325,000 | $199 | 69 |
| 5594 W Nobis Cir | 0.31mi | 3/2.5 | 1,735 (-6%) | 14mo | $425,000 | $245 | 62 |
| 5612 W Paprika Loop | 0.17mi | 3/3.0 | 2,040 (+11%) | 11mo | $305,000 | $150 | 61 |
| 5835 W Allspice Pl | 0.10mi | 3/2.0 | 1,605 (-13%) | 15mo | $240,000 | $150 | 61 |
| 5618 W Hesse Ct | 0.62mi | 3/2.0 | 1,764 (-4%) | 11mo | $228,000 | $129 | 54 |
| 5581 W Chive Loop | 0.34mi | 3/2.0 | 2,078 (+13%) | 24mo | $337,000 | $162 | 43 |
| 5750 W Irving Ct | 0.66mi | 3/2.0 | 1,620 (-12%) | 20mo | $235,000 | $145 | 32 |
Match score weights: distance 35% · size 25% · config 20% · recency 20%. Top-matched comps best support the ARV.
Projected returns pro-forma
-3.0% appreciation · 3.0% rent growth · sell at horizon
- IRR
- -1.0%
- Equity multiple
- 0.96×
- Total profit
- $-1,943
- Equity at exit
- $28,315
- IRR
- 8.7%
- Equity multiple
- 1.66×
- Total profit
- $35,322
- Equity at exit
- $16,419
Cash invested: $53,172 (down + closing). Projections, not guarantees.
Landlord ↔ Tenant lean methodology
- Overall (STATE)
- 87 Strongly Landlord-Friendly
- State Florida
- 87 Strongly Landlord-Friendly · R+3
- County
- — inherits STATE
- City
- — inherits STATE
ZIP-level market 34448
- Home prices YoY
- -26.1%
- Active inventory
- 307
- Price-to-rent
- 7.6×
Monthly cashflow live
- Estimated rent
- $2,089 medium interval (Pro) →
- Mortgage (P&I)
- −$996
- Tax from tax record
- −$122 /mo · $1,465/yr
- Insurance
- −$79
- HOA
- −$0
- Vacancy / Maint / Mgmt
- −$439
- Net cashflow
- $453
Break-even live
UW: 25.0% down · 7.5% · 30yr · 1.5% tax · 5.0% vac · 8.0% maint · 8.0% mgmt
Financing live
Cash to close
- Down payment
- $47,475
- Closing costs
- $5,697
- Reserves months
- —
- Total cash needed
- —
Loan-product check · same deal, 3 products live
Conventional
25% down · 7.5% · 30yr
- Down + closing
- —
- Monthly P&I
- —
- Monthly cashflow
- —
- DSCR
- —
- Eligible?
- —
Personal DTI + credit; lowest rate.
DSCR
20% down · 8.5% · 30yr
- Down + closing
- —
- Monthly P&I
- —
- Monthly cashflow
- —
- DSCR
- —
- Eligible?
- —
No personal income docs; deal must DSCR.
Hard money
10% down · 12.0% · 12mo
- Down + closing
- —
- Monthly P&I
- —
- Monthly cashflow
- —
- DSCR
- —
- Eligible?
- —
Short-term bridge; refi at stabilization.
Rent comps 3 comps
| Address | Beds | Baths | Sqft | Rent | $/sqft | DOM | Units | Dist |
|---|---|---|---|---|---|---|---|---|
| 31 N Pizarro Pt Lecanto, FL | 2.0 | 2.0 | 2011 | $2,395 | $1.19 | 20d | 1 | 1.20mi |
| 5085 W Kristina Loop Lecanto, FL | 2.0 | 2.0 | 1227 | $1,800 | $1.47 | 20d | 1 | 1.32mi |
| 271 N Lombardy Pt Lecanto, FL | 2.0 | 2.0 | 1809 | $1,500 | $0.83 | 20d | 1 | 1.41mi |
Listing history 8 events
-
2026-06-19days on market $189,900 Active 9 DOM
-
2026-06-18days on market $189,900 Active 8 DOM
-
2026-06-17days on market $189,900 Active 7 DOM
-
2026-06-16days on market $189,900 Active 6 DOM
-
2026-06-15days on market $189,900 Active 5 DOM
-
2026-06-14days on market $189,900 Active 3 DOM
-
2026-06-13remarks 699-char remark
-
2026-06-13$189,900 Active 2 DOM
ⓘ Source: listings_history table (triggers on properties + properties_extension) + one-shot
backfill from property_details.listing_events for pre-trigger history.
Tax reassessment forecast FL · Resets to sale price
- Current annual tax
- $1,465 · $122/mo
- Projected year-2 tax
- $1,576 · $131/mo
- Expected delta
- +$111/yr (+$9/mo · 7.6%)
ⓘ Screening estimate from a state-policy table — verify with the county assessor before closing.
Climate risk First Street
- Flood 1/10 Low FEMA zone X (unshaded) · 0% chance over 30 yrs
- Wildfire 6/10 Major
- Heat 9/10 Extreme 7 d/yr ≥108°F today · 24 d/yr by 30 yrs out
- Wind 9/10 Extreme 99% chance of damaging wind over 30 yrs
- Air quality 1/10 Low 0 unhealthy d/yr today · 0 by 30 yrs out
Nearby sold comps map
Loading sold comps map…
Walkable amenities ~0.75 mi
Loading nearby amenities…
Taxation est. · year 1
- Rental income
- $25,068
- − Mortgage interest
- −$10,637
- − Property taxes
- −$1,465
- − Insurance
- −$950
- − Repairs & maintenance
- −$2,005
- − Management
- −$2,005
- − Depreciation
- −$5,524
- Taxable income
- $2,481
- Est. tax owed @ 24.0%
- −$595
- After-tax cash flow
- $4,844/yr
For passive investors: Depreciation is non-cash, so a rental often shows a tax loss while cash-flowing — sheltering income. Rental losses are passive: they offset passive income freely, and up to $25,000/yr can offset ordinary (W-2) income if you actively participate and your MAGI is under $100k (phasing out to $0 by $150k); unused losses carry forward. On sale, claimed depreciation is recaptured at up to 25%, and gains may owe capital-gains tax (a 1031 exchange can defer both). Figures are a year-1 estimate at your 24.0% rate — not tax advice; consult a CPA.
Schools (NCES district)
- District
- Citrus
- NCES district ID
- 1200270
- Math proficiency
- 49% ▼ -10.00%
- Reading proficiency
- 50% ▼ -6.00%
- Median HH income
- $38,618
- Composite
- 41.28/100
- National rank
- #3519
- State rank
- #44 of 73 in FL
Livability — Homosassa Springs
- Score
- 71/100
- State rank
- #391
- US rank
- #6877
Category grades
Schools grade is shown separately in the Schools card above.
Census & demographics
- Census place
- Homosassa Springs, FL
- County
- Citrus County · 111,314 people
- Metro
- Homosassa Springs, FL
- Population (ZIP)
- 10,817
- Household income
- $45,916
- Rent vs Own
- Severe rent burden
- 113.0
Population outlook (Citrus County) Hauer SSP2
- Today (2025)
- 138,622 people
- By 2030
- 136,886 · -1.3%
- By 2040
- 132,009 · -4.8%
- By 2050
- 125,196 · -9.7%
- By 2075
- 108,570 · -21.7%
- By 2100
- 84,454 · -39.1%
Race, ethnicity, and origin ACS 2023
- Neighborhood character
- Predominantly White (94%)
- Race & ethnicity
- White 94% Two or more races 3% Hispanic / Latino 3% Black 1%
- Common ancestry
- Slovak 3% Scotch-Irish 2% Lithuanian 2%
- Foreign-born
- 2% · Canada
- Languages at home
- 96% English-only · Spanish 2% Russian/Polish/Slavic 1%
Political lean MEDSL · Citrus
- 2024 margin
- Solid R (+45.9) · D 26.8% · R 72.6%
- 2008→2024 swing
- -29.8pp toward R · 2008: -16.1pp · 2024: -45.9pp
- All cycles
- 2024: R+45.9 2020: R+41.0 2016: R+39.7 2012: R+21.9 2008: R+16.1
Not yet ingested
- Civics
- —
Market trends
- HPI YoY
- ▼ -110.27%
- Current HPI
- 312.4302
- Rent YoY
- —
- Metro
- Homosassa Springs, FL
- State GDP YoY
- ▲ 3.28%
- F500 in state
- 36
Industry mix (Fortune 500 HQ in FL)
| Industry | F500 HQs | Revenue |
|---|---|---|
| Industrial Technology | 2 | $29B |
|
||
| Insurance | 2 | $17B |
|
||
| Retail | 1 | $60B |
|
||
| Technology Distribution | 1 | $58B |
|
||
| Homebuilding | 1 | $35B |
|
||
| Technology Manufacturing | 1 | $35B |
|
||
Price history
+603.3% since first listed12 events — show timeline
- 2026-06-10 Listed $189,900 Stellar MLS as Distributed by MLS Grid
- 2025-08-27 Price Changed $265,000 RACC
- 2025-08-27 Price Changed $265,000 Stellar MLS as Distributed by MLS Grid
- 2025-08-27 Price Changed $250,000 RACC
- 2015-03-16 Sold (Public Records) $134,000 Public Records
- 2015-03-11 Sold (MLS) $134,000 RACC
- 2014-09-01 Listed $139,900 RACC
- 2004-11-01 Sold (Public Records) $129,900 Public Records
- 2004-10-29 Sold (MLS) $129,900 RACC
- 2004-06-25 Listed $139,900 RACC
- 1987-11-01 Sold (Public Records) $62,200 Public Records
- 1987-02-01 Sold (Public Records) $27,000 Public Records
Property tax history
+4.4%/yrLatest (2025): $1,465 · +6.6% YoY. Source: county tax records.
Cash-flow waterfall
monthlySold comps — $/sqft
last 12 mo · ≤1 miLoading sold comps…