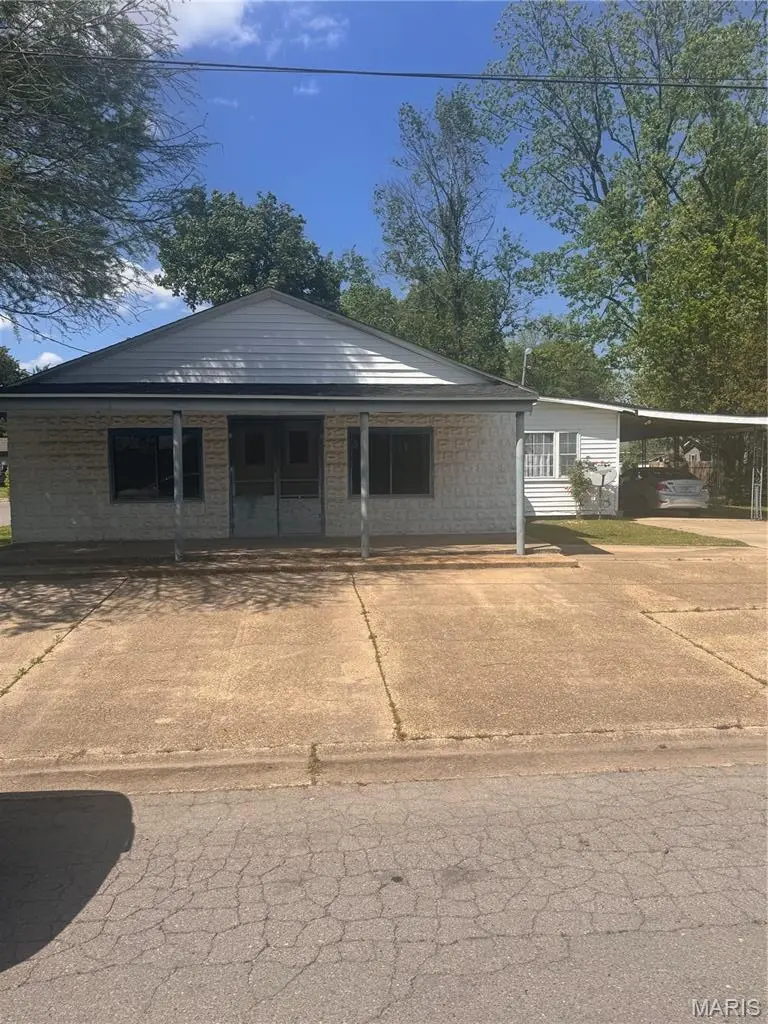
115 West Tom Brown · Charleston, MO
Flood risk 5/10 · Moderate
- FEMA flood zone
- X (shaded)
- Chance of flooding over 30 yrs
- 0.66%
- Est. flood insurance / yr
- $507 – $1,088
Fire risk 1/10 · Minimal
- Est. fire insurance / yr
- $1,054 – $1,958
Heat risk 6/10 · Moderate
- Hot days now (above 109°F)
- 7 days/yr
- Hot days in 30 yrs
- 21 days/yr
Wind risk 3/10 · Minor
- Chance of severe wind over 30 yrs
- 6.0%
Air-quality risk 3/10 · Minor
- Unhealthy air days now
- 3 days/yr
- Unhealthy air days in 30 yrs
- 3 days/yr
Risk factors via First Street. Map © Google.
Why this score? — see what drove the C- grade
The composite is a weighted blend of 9 inputs, each scored 0–100. Each bar is that input's sub-score; the figure is the points it added to the 100-point composite (weight × sub-score).
- Cash flow +19.1/30.0
- Appreciation +8.3/10.0
- ARV discount +7.7/15.0
- DSCR +6.0/10.0
- 1% rule +4.2/10.0
- Livability +2.7/5.0
- Rent growth +2.5/5.0
- Condition / age +2.5/5.0
- Schools +1.3/10.0
$65,000
🖨 Deal sheet 📄 Offer letter ✓ Due diligence
Listing remarks
Endless potential meets solid bones! This 3-bedroom, 1 bath home features a roof just 2 years young. And a structure built to stand the test of time. While it could use some updating, the real opportunity lies in its unique bonus space, formerly a laundromat-- ready to be reimagined for your next business venture or creative use. Live, Work, and invest all in one property. Don't miss this rare chance to make it your own!
Key facts
- Parking
- Built 1950
- Listed 51 days
Property features AI
Finance
- Financial info: Lease not considered
Exterior
- Parking: Carport with 1 space
- Utilities: Public water; Public sewer; Electricity connected; Cable available
- Home design: Single-family residence; One-story
- Construction: Vinyl siding
- Exterior features: Front yard
Interior
- Kitchen: Range; Refrigerator
- Bedrooms: 3 bedrooms, all on the main level
- Bathrooms: 1 full bathroom
- Heating & cooling: Forced air heating; Central air conditioning
- Interior features: Range; Refrigerator
Neighborhood map
What this means for you Summary
Snapshot
- This is a 2-bed/1.0-bath other listed at $65k.
Deal economics
- At list price, monthly cash flow is $68 ($821/yr) — positive.
- The deal already cash-flows at list — no discount required.
- To meet the 1% rule (rent ≥ 1% of price), the offer needs to be $60k (7.7% below list).
- Recommended offer: $60k (7.7% below list) — sets the bar for 1% rule.
Location & tenants
- Location reads 53/100 on livability (#842 in MO) — a working-class tenant base; expect higher turnover. Strengths: cost of living A+, housing A+; Watch: crime F, amenities F, commute F.
- Charleston R-I (town): math 11% / reading 23% proficiency, ranked #310 of 324 in MO (top 96%) — low school quality limits family demand, transient renter base, plan for 1-2y turnover; 78% free/reduced lunch — lower-income household profile, screen leases tightly.
- Zoned schools: Charleston High (math 15% / reading 37%, grade F, #430 of 521 statewide, top 83%, 331 students, 97% FRL) — zoned schools average 97% FRL vs 78% district-wide (19 pts higher); higher-poverty schools than district average — tighter screening recommended.
- Market conditions: 21 active listings in the ZIP; 1 comparable units currently listed for rent nearby; 7 units permitted in Mississippi County in 2024 (0 in 5+ unit buildings).
Forward outlook
- In year one you build about $5k of equity ($449 loan paydown + $4k appreciation (6.7% local appreciation)).
- Mississippi County population projected to shrink 9% by 2050 — rents likely to lag national; underwrite the cash flow, not the appreciation.
- At projected returns (6.7% appreciation + 3.0% rent growth), your $18k cash investment doubles in ~3 years — after that, you're playing with house money.
- By year 7, paydown + projected appreciation supports a ~$32k cash-out refi (75% LTV) — recoverable capital for the next deal without selling this one.
Negotiation context
- It's been on market 52 days — a 3% lower offer ($63k) is reasonable based on typical stale-listing flexibility.
Risks & watch-outs
- Watch-outs: built in 1950 — expect roof / HVAC / electrical / plumbing capex.
- Climate carrying-cost: moderate flood risk; extreme-heat days projected 7→21/yr by 2055 (HVAC capex compounding) — expect insurance premiums to compound above CPI over the hold.
Questions for the listing agent
- It's been on market 52 days. Have you received any prior offers? Is the seller open to a 8% concession, seller financing, or rate buy-down credit?
- Built in 1950 — when were the roof, HVAC, electrical panel, plumbing, and water heater last replaced?
- Is there a deadline driving the sale (1031 exchange, divorce, estate, relocation)? That informs how much negotiation room exists.
- Schools are F-rated, which usually means shorter tenancies and higher turnover. Who's the typical renter profile here, and what's been the actual vacancy rate?
- Crime grade is F in this area — have there been break-ins, vandalism, or insurance claims at this property in the last 3 years? What carrier currently insures it and at what premium?
- What's the average days-on-market for RENTAL listings here right now (not sales)? A rising rental-DOM trend means longer vacancies and softer asking-rent achievability than the comps imply.
- What's the recent tenant-quality profile in this submarket — average credit score on applications, eviction rate, late-payment / NSF rate, and stable-employment percentage? A property-management company in the area should have these aggregated.
- How much new for-sale + rental construction is in the pipeline within 1–3 miles? Heavy new supply typically softens prices + rents 12–24 months out; constrained supply supports both.
Investment metrics
- 1% rule
- 0.92% ✗
- Cap rate
- 7.56%
- Cash-on-cash
- 4.51%
- DSCR
- 1.20
- GRM
- 9.0
CMA / ARV
- ARV (median comp)
- $65,240
- List price
- $65,000
- Delta
- -0.37%
- Verdict
- FAIR
- Comps
- 20 within 1.0 mi
Projected returns pro-forma
6.65% appreciation · 3.0% rent growth · sell at horizon
- IRR
- 20.5%
- Equity multiple
- 2.41×
- Total profit
- $25,642
- Equity at exit
- $43,559
- IRR
- 19.4%
- Equity multiple
- 4.92×
- Total profit
- $71,410
- Equity at exit
- $81,431
Cash invested: $18,200 (down + closing). Projections, not guarantees.
Landlord ↔ Tenant lean methodology
- Overall (STATE)
- 81 Strongly Landlord-Friendly
- State Missouri
- 81 Strongly Landlord-Friendly · R+10
- County
- — inherits STATE
- City
- — inherits STATE
ZIP-level market 63834
- Home prices YoY
- 5.3%
- Active inventory
- 21
- Price-to-rent
- 9.0×
Monthly cashflow live
- Estimated rent
- $600 medium interval (Pro) →
- Mortgage (P&I)
- −$341
- Tax from tax record
- −$38 /mo · $451/yr
- Insurance
- −$27
- HOA
- −$0
- Vacancy / Maint / Mgmt
- −$126
- Net cashflow
- $68
Break-even live
UW: 25.0% down · 7.5% · 30yr · 1.5% tax · 5.0% vac · 8.0% maint · 8.0% mgmt
Financing live
Cash to close
- Down payment
- $16,250
- Closing costs
- $1,950
- Reserves months
- —
- Total cash needed
- —
Loan-product check · same deal, 3 products live
Conventional
25% down · 7.5% · 30yr
- Down + closing
- —
- Monthly P&I
- —
- Monthly cashflow
- —
- DSCR
- —
- Eligible?
- —
Personal DTI + credit; lowest rate.
DSCR
20% down · 8.5% · 30yr
- Down + closing
- —
- Monthly P&I
- —
- Monthly cashflow
- —
- DSCR
- —
- Eligible?
- —
No personal income docs; deal must DSCR.
Hard money
10% down · 12.0% · 12mo
- Down + closing
- —
- Monthly P&I
- —
- Monthly cashflow
- —
- DSCR
- —
- Eligible?
- —
Short-term bridge; refi at stabilization.
Rent comps 1 comps
| Address | Beds | Baths | Sqft | Rent | $/sqft | DOM | Units | Dist |
|---|---|---|---|---|---|---|---|---|
| 712 Warren St Charleston, MO | 1.0 | 1.0 | 713 | $600 | $0.84 | 43d | 1 | 0.56mi |
Listing history 15 events
-
2026-06-18days on market $65,000 Active 52 DOM
-
2026-06-17days on market $65,000 Active 51 DOM
-
2026-06-16days on market $65,000 Active 50 DOM
-
2026-06-15days on market $65,000 Active 49 DOM
-
2026-06-13days on market $65,000 Active 47 DOM
-
2026-06-12days on market $65,000 Active 46 DOM
-
2026-06-09days on market $65,000 Active 43 DOM
-
2026-06-08days on market $65,000 Active 42 DOM
-
2026-06-07days on market $65,000 Active 41 DOM
-
2026-06-05days on market $65,000 Active 39 DOM
-
2026-06-04days on market $65,000 Active 37 DOM
-
2026-06-02days on market $65,000 Active 36 DOM
-
2026-06-01days on market $65,000 Active 35 DOM
-
2026-05-31days on market $65,000 Active 34 DOM
-
2026-04-27$65,000 Active 424-char remark
ⓘ Source: listings_history table (triggers on properties + properties_extension) + one-shot
backfill from property_details.listing_events for pre-trigger history.
Tax reassessment forecast MO · Resets to sale price
- Current annual tax
- $451 · $38/mo
- Projected year-2 tax
- $630 · $53/mo
- Expected delta
- +$179/yr (+$15/mo · 39.7%)
ⓘ Screening estimate from a state-policy table — verify with the county assessor before closing.
Climate risk First Street
- Flood 5/10 Major FEMA zone X (shaded) · 66% chance over 30 yrs
- Wildfire 1/10 Low
- Heat 6/10 Major 7 d/yr ≥109°F today · 21 d/yr by 30 yrs out
- Wind 3/10 Moderate 6% chance of damaging wind over 30 yrs
- Air quality 3/10 Moderate 3 unhealthy d/yr today · 3 by 30 yrs out
Nearby sold comps map
Loading sold comps map…
Walkable amenities ~0.75 mi
Loading nearby amenities…
Taxation est. · year 1
- Rental income
- $7,200
- − Mortgage interest
- −$3,641
- − Property taxes
- −$451
- − Insurance
- −$325
- − Repairs & maintenance
- −$576
- − Management
- −$576
- − Depreciation
- −$1,891
- Taxable loss
- −$260
- Est. tax savings @ 24.0%
- +$62
- After-tax cash flow
- $884/yr
For passive investors: Depreciation is non-cash, so a rental often shows a tax loss while cash-flowing — sheltering income. Rental losses are passive: they offset passive income freely, and up to $25,000/yr can offset ordinary (W-2) income if you actively participate and your MAGI is under $100k (phasing out to $0 by $150k); unused losses carry forward. On sale, claimed depreciation is recaptured at up to 25%, and gains may owe capital-gains tax (a 1031 exchange can defer both). Figures are a year-1 estimate at your 24.0% rate — not tax advice; consult a CPA.
Schools (NCES district)
- District
- Charleston R-I
- NCES district ID
- 2908670
- Math proficiency
- 11% ▲ 2.00%
- Reading proficiency
- 23% ▼ -1.00%
- Median HH income
- $29,019
- Composite
- 13.37/100
- National rank
- #9531
- State rank
- #310 of 324 in MO
Livability — Charleston
- Score
- 53/100
- State rank
- #842
- US rank
- #24671
Category grades
Schools grade is shown separately in the Schools card above.
Census & demographics
- Census place
- Charleston, MO
- Population (ZIP)
- 5,218
Population outlook (Mississippi County) Hauer SSP2
- Today (2025)
- 13,403 people
- By 2030
- 13,101 · -2.3%
- By 2040
- 12,626 · -5.8%
- By 2050
- 12,233 · -8.7%
- By 2075
- 10,704 · -20.1%
- By 2100
- 8,345 · -37.7%
Race, ethnicity, and origin ACS 2023
- Neighborhood character
- Diverse neighborhood (Simpson 0.56)
- Race & ethnicity
- Black 49% White 45% Two or more races 6%
- Common ancestry
- Iranian 1% Slovak 1% Portuguese 1%
- Foreign-born
- 0% · Canada
- Languages at home
- 98% English-only · Spanish 1%
Political lean MEDSL · Mississippi
- 2024 margin
- Solid R (+53.7) · D 22.8% · R 76.5%
- 2008→2024 swing
- -39.0pp toward R · 2008: -14.7pp · 2024: -53.7pp
- All cycles
- 2024: R+53.7 2020: R+49.6 2016: R+41.5 2012: R+23.2 2008: R+14.7
Not yet ingested
- Civics
- —
Market trends
- HPI YoY
- ▲ 6.65%
- Current HPI
- 131.78
- Rent YoY
- —
- Metro
- —
- State GDP YoY
- ▲ 1.84%
- F500 in state
- 20
Industry mix (Fortune 500 HQ in MO)
| Industry | F500 HQs | Revenue |
|---|---|---|
| Healthcare | 1 | $163B |
|
||
| Insurance | 1 | $21B |
|
||
| Industrial Technology | 1 | $17B |
|
||
| Retail | 1 | $16B |
|
||
| Industrial Distribution | 1 | $10B |
|
||
| Utilities | 1 | $9B |
|
||
Price history
1 event — show timeline
- 2026-04-27 Listed $65,000 MARIS as Distributed by MLS Grid
Property tax history
-0.8%/yrLatest (2025): $451 · +3.7% YoY. Source: county tax records.
Cash-flow waterfall
monthlySold comps — $/sqft
last 12 mo · ≤1 miLoading sold comps…