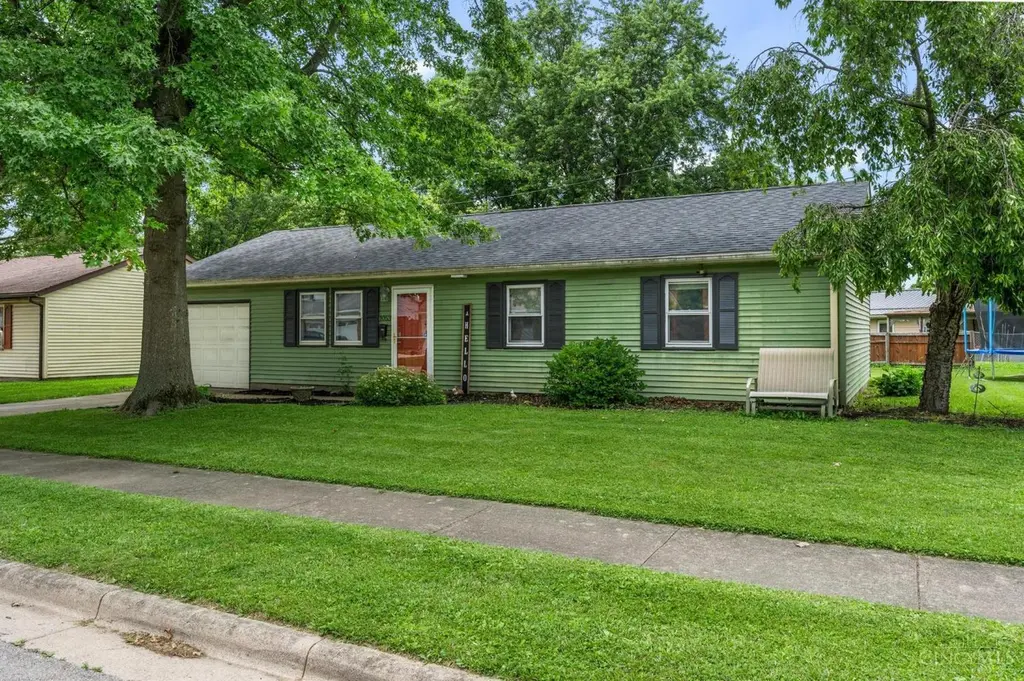
1053 Linhof Rd · Wilmington, OH
Flood risk 1/10 · Minimal
- FEMA flood zone
- X (unshaded)
- Chance of flooding over 30 yrs
- 0.0%
- Est. flood insurance / yr
- $507 – $1,088
Fire risk 1/10 · Minimal
- Est. fire insurance / yr
- $713 – $1,323
Heat risk 3/10 · Minor
- Hot days now (above 100°F)
- 7 days/yr
- Hot days in 30 yrs
- 19 days/yr
Wind risk 2/10 · Minimal
- Chance of severe wind over 30 yrs
- 1.0%
Air-quality risk 2/10 · Minimal
- Unhealthy air days now
- 1 days/yr
- Unhealthy air days in 30 yrs
- 2 days/yr
Risk factors via First Street. Map © Google.
Why this score? — see what drove the B- grade
The composite is a weighted blend of 9 inputs, each scored 0–100. Each bar is that input's sub-score; the figure is the points it added to the 100-point composite (weight × sub-score).
- Cash flow +30.0/30.0
- 1% rule +10.0/10.0
- DSCR +10.0/10.0
- ARV discount +4.3/15.0
- Schools +3.9/10.0
- Livability +3.9/5.0
- Rent growth +2.5/5.0
- Condition / age +2.5/5.0
- Appreciation +0.0/10.0
$195,000
🖨 Deal sheet 📄 Offer letter ✓ Due diligence
Listing remarks MLS
Don't miss this inviting ranch home at 1053 Linhof Rd! With 3 bedrooms, a full bath, and a spacious living room, this property offers easy, affordable living. The kitchen opens into a sun-filled 4 seasons room, ideal for morning coffee or cozy evenings. Recent updates include a new roof (complete tear off), and the one-car garage with opener adds everyday convenience. This home is perfect for first-time buyers or those looking to downsize without compromising on comfort.
Key facts
- One car garage
- Spacious living room
- 7,275 sq ft lot
Tags
Property features AI
Finance
- HOA & community: No HOA
Exterior
- Parking: Attached garage (1 car); Driveway parking; On-street parking
- Utilities: Public water; Public sewer; Electric water heater; Electric for heating (baseboard) and window-unit cooling
- Home design: Ranch-style single family home; One level
- Construction: Vinyl siding; Shingle roof; Slab foundation
- Exterior features: Privacy fencing; Above-ground pool; Shed on property; City street access
Interior
- Kitchen: Wood cabinets; Laminate floor; Dishwasher; Oven/Range; Refrigerator
- Bedrooms: Three bedrooms total; Primary bedroom (13 x 12) on level 1; Bedroom 2 (11 x 10) on level 1; Bedroom 3 (10 x 9) on level 1
- Flooring: Laminate flooring
- Bathrooms: One full bathroom on level 1
- Heating & cooling: Baseboard heating; Window unit cooling
- Interior features: Laminate flooring in living areas; Wood cabinets in the kitchen; Walkout family room; 4-season room
Neighborhood map
What this means for you Summary
Snapshot
- This is a 3-bed/1.0-bath single-family listed at $195k.
Deal economics
- At list price, monthly cash flow is $2k ($23k/yr) — positive.
- The deal already cash-flows at list — no discount required.
- Meets the 1% rule at list price ($4k rent vs $195k).
- Cap rate 18.2% vs local median 6.2% in Wilmington — top-decile yield for the area; either an underpriced asset or a hidden risk that comps aren't pricing in. Stress-test before assuming the spread holds.
Location & tenants
- Location reads 77/100 on livability (#202 in OH, #3,127 nationally) — a middle-class / working-renter tenant base. Strengths: cost of living A+, housing A+, health & safety A+; Watch: schools C-, amenities D, commute F.
- Wilmington City (town): math 42% / reading 51% proficiency, ranked #492 of 656 in OH (top 75%) — families likely to look elsewhere, expect single-tenant / working-renter base with shorter leases.
- Market conditions: 107 active listings in the ZIP; 3 comparable units currently listed for rent nearby; rentals leasing fast (median 3d on market — plan ~1-2 weeks tenant-placement turnaround); 119 units permitted in Clinton County in 2024 (0 in 5+ unit buildings).
- At $4,009/mo this rent would consume 68% of the median local household income ($70k/yr) — very limited rent-growth headroom before tenants either downsize or default.
Forward outlook
- Local home prices are declining (-3.0%/yr); year-one equity from $1k of loan paydown is wiped out by about $6k of value loss. Plan a longer hold.
- Clinton County population projected at -12% by 2050 — secular population decline; favor cash flow + early exit over multi-decade hold.
- At projected returns (-3.0% appreciation + 3.0% rent growth), your $55k cash investment doubles in ~3 years — after that, you're playing with house money.
Negotiation context
- Only 6 days on market — expect competitive offers; lowballing is unlikely to land.
- 4 sale attempts since 24y ago with the ask held roughly flat each time — persistent listings suggest the price (not the market) is what's stuck; bring a comps-based counter.
Questions for the listing agent
- Is there a deadline driving the sale (1031 exchange, divorce, estate, relocation)? That informs how much negotiation room exists.
- What's the average days-on-market for RENTAL listings here right now (not sales)? A rising rental-DOM trend means longer vacancies and softer asking-rent achievability than the comps imply.
- What's the recent tenant-quality profile in this submarket — average credit score on applications, eviction rate, late-payment / NSF rate, and stable-employment percentage? A property-management company in the area should have these aggregated.
- How much new for-sale + rental construction is in the pipeline within 1–3 miles? Heavy new supply typically softens prices + rents 12–24 months out; constrained supply supports both.
Investment metrics
- 1% rule
- 2.06% ✓
- Cap rate
- 18.18%
- Cash-on-cash
- 42.45%
- DSCR
- 2.89
- GRM
- 4.1
CMA / ARV
- ARV (on-the-fly)
- $182,000
- Comps found
- 12
Show comp detail 12 sales within ~0.75 mi
| Address | Dist | Beds/Ba | Sqft | Sold | Price | $/sf | Match |
|---|---|---|---|---|---|---|---|
| 1053 Linhof Rd | 0.00mi | 3/1.0 | 1,040 (0%) | 12mo | $179,500 | $173 | 90 |
| 329 Burdel Dr | 0.11mi | 3/1.5 | 1,084 (+4%) | 9mo | $192,000 | $177 | 79 |
| 1052 Linhof Rd | 0.02mi | 3/1.0 | 936 (-10%) | 5mo | $185,000 | $198 | 78 |
| 995 Linhof Rd | 0.05mi | 3/1.0 | 1,128 (+8%) | 9mo | $179,500 | $159 | 76 |
| 1175 Southridge Ave | 0.12mi | 3/1.0 | 936 (-10%) | 6mo | $190,000 | $203 | 72 |
| 116 Woodland Dr | 0.35mi | 3/1.5 | 984 (-5%) | 8mo | $217,500 | $221 | 66 |
| 724 Norman St | 0.24mi | 2/1.0 (-1) | 1,000 (-4%) | 14mo | $174,500 | $175 | 66 |
| 640 Lytle Pl | 0.36mi | 3/2.0 | 1,004 (-4%) | 12mo | $260,000 | $259 | 63 |
| 252 Randolph St | 0.20mi | 3/1.0 | 896 (-14%) | 9mo | $155,900 | $174 | 60 |
| 352 S Mulberry St | 0.66mi | 3/1.0 | 1,025 (-1%) | 13mo | $122,650 | $120 | 56 |
| 149 W Truesdell St | 0.69mi | 2/1.0 (-1) | 1,026 (-1%) | 8mo | $178,000 | $173 | 53 |
| 369 S South St | 0.67mi | 2/2.0 (-1) | 1,116 (+7%) | 14mo | $189,500 | $170 | 36 |
Match score weights: distance 35% · size 25% · config 20% · recency 20%. Top-matched comps best support the ARV.
Projected returns pro-forma
-3.0% appreciation · 3.0% rent growth · sell at horizon
- IRR
- 39.2%
- Equity multiple
- 2.67×
- Total profit
- $91,416
- Equity at exit
- $29,075
- IRR
- 45.6%
- Equity multiple
- 5.36×
- Total profit
- $237,981
- Equity at exit
- $16,860
Cash invested: $54,600 (down + closing). Projections, not guarantees.
Landlord ↔ Tenant lean methodology
- Overall (STATE)
- 73 Landlord-Friendly
- State Ohio
- 73 Landlord-Friendly · R+6
- County
- — inherits STATE
- City
- — inherits STATE
ZIP-level market 45177
- Active inventory
- 107
- Price-to-rent
- 4.1×
Monthly cashflow live
- Estimated rent
- $4,009 medium interval (Pro) →
- Mortgage (P&I)
- −$1,023
- Tax from tax record
- −$131 /mo · $1,577/yr
- Insurance
- −$81
- HOA
- −$0
- Vacancy / Maint / Mgmt
- −$842
- Net cashflow
- $1,932
Break-even live
UW: 25.0% down · 7.5% · 30yr · 1.5% tax · 5.0% vac · 8.0% maint · 8.0% mgmt
Financing live
Cash to close
- Down payment
- $48,750
- Closing costs
- $5,850
- Reserves months
- —
- Total cash needed
- —
Loan-product check · same deal, 3 products live
Conventional
25% down · 7.5% · 30yr
- Down + closing
- —
- Monthly P&I
- —
- Monthly cashflow
- —
- DSCR
- —
- Eligible?
- —
Personal DTI + credit; lowest rate.
DSCR
20% down · 8.5% · 30yr
- Down + closing
- —
- Monthly P&I
- —
- Monthly cashflow
- —
- DSCR
- —
- Eligible?
- —
No personal income docs; deal must DSCR.
Hard money
10% down · 12.0% · 12mo
- Down + closing
- —
- Monthly P&I
- —
- Monthly cashflow
- —
- DSCR
- —
- Eligible?
- —
Short-term bridge; refi at stabilization.
Rent comps 3 comps
| Address | Beds | Baths | Sqft | Rent | $/sqft | DOM | Units | Dist |
|---|---|---|---|---|---|---|---|---|
| 109 Southwind Blvd Wilmington, OH | 3.0 | 2.0 | 1344 | $4,995 | $3.72 | 2d | 1 | 1.08mi |
| 121 Southwind Blvd Wilmington, OH | 3.0 | 2.0 | 1344 | $4,995 | $3.72 | 2d | 1 | 1.09mi |
| 229 Taylor Dr Wilmington, OH | 3.0 | 2.0 | 1242 | $2,000 | $1.61 | 11d | 1 | 1.20mi |
Listing history 6 events
-
2026-06-18days on market $195,000 Active 6 DOM
-
2026-06-17days on market $195,000 Active 5 DOM
-
2026-06-16days on market $195,000 Active 4 DOM
-
2026-06-15days on market $195,000 Active 3 DOM
-
2026-06-14remarks 287-char remark
-
2026-06-14$195,000 Active 1 DOM
ⓘ Source: listings_history table (triggers on properties + properties_extension) + one-shot
backfill from property_details.listing_events for pre-trigger history.
Tax reassessment forecast OH · Partial reset (capped growth)
- Current annual tax
- $1,577 · $131/mo
- Projected year-2 tax
- $2,309 · $192/mo
- Expected delta
- +$733/yr (+$61/mo · 46.5%)
ⓘ Screening estimate from a state-policy table — verify with the county assessor before closing.
Climate risk First Street
- Flood 1/10 Low FEMA zone X (unshaded) · 0% chance over 30 yrs
- Wildfire 1/10 Low
- Heat 3/10 Moderate 7 d/yr ≥100°F today · 19 d/yr by 30 yrs out
- Wind 2/10 Low 100% chance of damaging wind over 30 yrs
- Air quality 2/10 Low 1 unhealthy d/yr today · 2 by 30 yrs out
Nearby sold comps map
Loading sold comps map…
Walkable amenities ~0.75 mi
Loading nearby amenities…
Taxation est. · year 1
- Rental income
- $48,104
- − Mortgage interest
- −$10,923
- − Property taxes
- −$1,577
- − Insurance
- −$975
- − Repairs & maintenance
- −$3,848
- − Management
- −$3,848
- − Depreciation
- −$5,673
- Taxable income
- $21,260
- Est. tax owed @ 24.0%
- −$5,102
- After-tax cash flow
- $18,077/yr
For passive investors: Depreciation is non-cash, so a rental often shows a tax loss while cash-flowing — sheltering income. Rental losses are passive: they offset passive income freely, and up to $25,000/yr can offset ordinary (W-2) income if you actively participate and your MAGI is under $100k (phasing out to $0 by $150k); unused losses carry forward. On sale, claimed depreciation is recaptured at up to 25%, and gains may owe capital-gains tax (a 1031 exchange can defer both). Figures are a year-1 estimate at your 24.0% rate — not tax advice; consult a CPA.
Schools (NCES district)
- District
- Wilmington City
- NCES district ID
- 3904511
- Math proficiency
- 42% ▼ -16.00%
- Reading proficiency
- 51% ▼ -6.00%
- Median HH income
- $43,201
- Composite
- 39.2/100
- National rank
- #4020
- State rank
- #492 of 656 in OH
Livability — Wilmington
- Score
- 77/100
- State rank
- #202
- US rank
- #3127
Category grades
Schools grade is shown separately in the Schools card above.
Census & demographics
- Census place
- Wilmington, OH
- County
- Clinton · 46,911 people
- Population (ZIP)
- 22,442
- Household income
- $70,483
- Rent vs Own
- Severe rent burden
- 9.5
Population outlook (Clinton County) Hauer SSP2
- Today (2025)
- 41,352 people
- By 2030
- 40,831 · -1.3%
- By 2040
- 39,049 · -5.6%
- By 2050
- 36,408 · -12.0%
- By 2075
- 29,652 · -28.3%
- By 2100
- 20,736 · -49.9%
Race, ethnicity, and origin ACS 2023
- Neighborhood character
- Predominantly White (91%)
- Race & ethnicity
- White 91% Two or more races 3% Black 3% Hispanic / Latino 2% Asian 1%
- Common ancestry
- Lithuanian 2% Slovak 2% Romanian 2%
- Foreign-born
- 3% · Canada, Jamaica
- Languages at home
- 97% English-only · Spanish 1% Other Asian/Pacific 1%
Political lean MEDSL · Clinton
- 2024 margin
- Solid R (+54.6) · D 22.3% · R 76.9%
- 2008→2024 swing
- -24.3pp toward R · 2008: -30.3pp · 2024: -54.6pp
- All cycles
- 2024: R+54.6 2020: R+52.6 2016: R+52.6 2012: R+35.2 2008: R+30.3
Not yet ingested
- Civics
- —
Market trends
- HPI YoY
- ▼ -150.35%
- Current HPI
- 238.9182
- Rent YoY
- —
- Metro
- —
- State GDP YoY
- ▲ 1.98%
- F500 in state
- 48
Industry mix (Fortune 500 HQ in OH)
| Industry | F500 HQs | Revenue |
|---|---|---|
| Insurance | 3 | $145B |
|
||
| Industrial Machinery | 3 | $49B |
|
||
| Financial Services | 3 | $24B |
|
||
| Consumer Goods | 2 | $93B |
|
||
| Aerospace / Defense | 2 | $47B |
|
||
| Utilities | 2 | $33B |
|
||
Price history
+254.5% since first listed13 events — show timeline
- 2026-06-12 Listed $195,000 Cincy MLS
- 2025-07-14 Sold (Public Records) $180,000 Public Records
- 2025-06-30 Sold (MLS) $179,500 Cincy MLS
- 2025-05-29 Contingent — Cincy MLS
- 2025-04-30 Listed $179,000 Cincy MLS
- 2019-10-24 Sold (Public Records) $114,500 Public Records
- 2019-10-18 Sold (MLS) $114,500 Cincy MLS
- 2019-09-07 Contingent — Cincy MLS
- 2019-09-05 Listed $114,500 Cincy MLS
- 2002-06-25 Sold (Public Records) $90,000 Public Records
- 2002-06-03 Sold (MLS) $90,000 Cincy MLS
- 2002-03-19 Listed $89,900 Cincy MLS
- 1993-08-10 Sold (Public Records) $55,000 Public Records
Property tax history
+5.4%/yrLatest (2025): $1,577 · -3.5% YoY. Source: county tax records.
Cash-flow waterfall
monthlySold comps — $/sqft
last 12 mo · ≤1 miLoading sold comps…