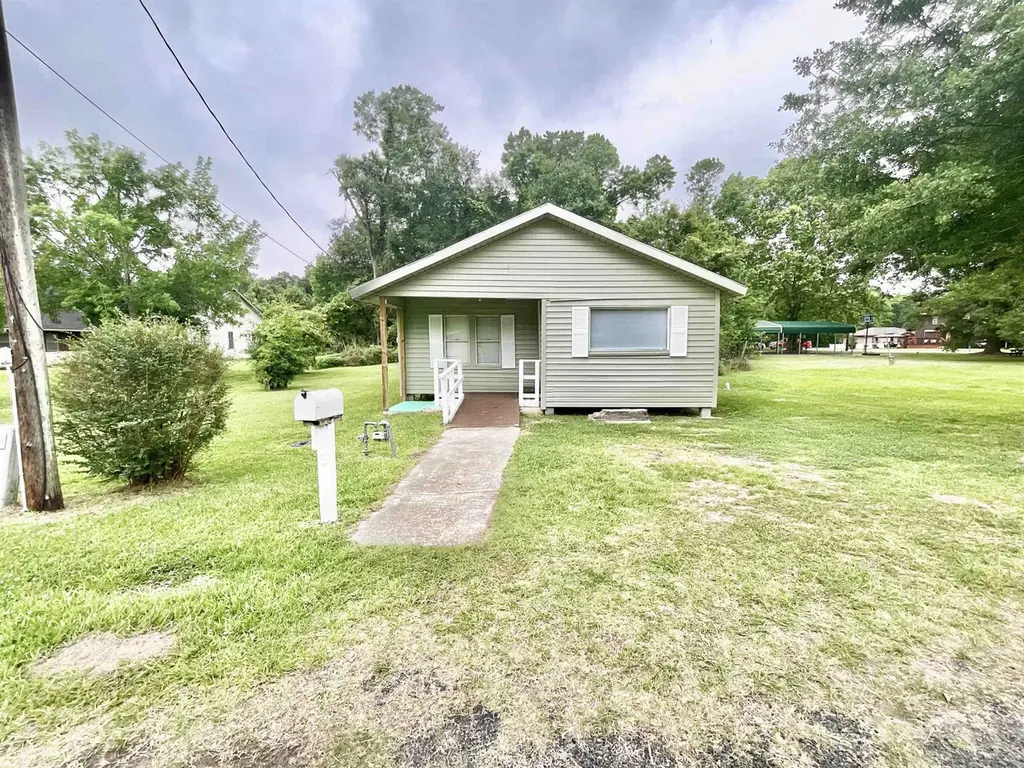
655 North 2nd St · Silsbee, TX
Flood risk 6/10 · Moderate
- FEMA flood zone
- X (unshaded)
- Chance of flooding over 30 yrs
- 0.69%
- Est. flood insurance / yr
- $507 – $1,088
Fire risk 2/10 · Minimal
- Est. fire insurance / yr
- $1,222 – $2,270
Heat risk 9/10 · Severe
- Hot days now (above 112°F)
- 7 days/yr
- Hot days in 30 yrs
- 23 days/yr
Wind risk 9/10 · Severe
- Chance of severe wind over 30 yrs
- 99.0%
Air-quality risk 2/10 · Minimal
- Unhealthy air days now
- 0 days/yr
- Unhealthy air days in 30 yrs
- 1 days/yr
Risk factors via First Street. Map © Google.
Why this score? — see what drove the C+ grade
The composite is a weighted blend of 9 inputs, each scored 0–100. Each bar is that input's sub-score; the figure is the points it added to the 100-point composite (weight × sub-score).
- Cash flow +27.2/30.0
- DSCR +9.4/10.0
- ARV discount +9.2/15.0
- 1% rule +7.0/10.0
- Livability +3.6/5.0
- Schools +2.6/10.0
- Rent growth +2.5/5.0
- Condition / age +2.5/5.0
- Appreciation +0.0/10.0
$119,900
🖨 Deal sheet (PDF) 📄 Offer letter ✓ Due diligence
Listing remarks
Beautifully Remodeled 3-Bedroom Home on Quiet Dead-End Street in Silsbee Completely remodeled and move-in ready, this charming 3-bedroom, 1-bathroom home offers comfort, privacy, and modern updates throughout. Situated on a quiet dead-end street, the home features a spacious living area, updated kitchen with electric stove and refrigerator, and includes a washer and dryer for added convenience. Window units are installed in every room, ensuring year-round comfort. This home is perfect for first-time buyers or those looking to downsize in a peaceful neighborhood. Schedule your private showing today!
Key facts
- Washer and dryer
- Updated kitchen
- 0.23 acre lot
Tags
Property features AI
Finance
- Other: Public maintained road
Exterior
- Security: Smoke detectors
- Utilities: Public water; Public sewer
- Home design: Single-family residence; Residential property
- Construction: Frame construction with vinyl siding
- Exterior features: Composition roof
Interior
- Kitchen: Gas cooktop; Range; Refrigerator; Dishwasher not listed
- Flooring: Vinyl flooring
- Bathrooms: One full bathroom
- Heating & cooling: Window unit(s) for cooling
- Interior features: Washer and dryer included; Refrigerator included; Gas cooktop and range; Vinyl flooring
- Laundry & utility: Washer; Dryer
Neighborhood map
What this means for you Summary
Snapshot
- This is a 3-bed/1.0-bath single-family listed at $120k.
Deal economics
- At list price, monthly cash flow is $342 ($4k/yr) — positive.
- The deal already cash-flows at list — no discount required.
- Meets the 1% rule at list price ($1k rent vs $120k).
- Recommended offer: $116k (3.0% below list) — sets the bar for market timing.
- Cap rate 9.7% vs local median 5.2% in Silsbee — top-decile yield for the area; either an underpriced asset or a hidden risk that comps aren't pricing in. Stress-test before assuming the spread holds.
Location & tenants
- Location reads 72/100 on livability (#263 in TX) — a middle-class / working-renter tenant base. Strengths: cost of living A+, housing A+, health & safety A+; Watch: schools C-, amenities F, commute F.
- Silsbee ISD (town): math 25% / reading 36% proficiency, ranked #614 of 826 in TX (top 74%) — families likely to look elsewhere, expect single-tenant / working-renter base with shorter leases.
- Market conditions: 127 active listings in the ZIP; 5 comparable units currently listed for rent nearby; rentals at typical pace (median 22d on market — plan ~3-4 weeks tenant-placement turnaround); 40% of comp listings sitting > 30 days — soft ceiling on asking rent; 358 units permitted in Hardin County in 2024 (0 in 5+ unit buildings).
Forward outlook
- Local home prices are declining (-3.0%/yr); year-one equity from $829 of loan paydown is wiped out by about $4k of value loss. Plan a longer hold.
- At projected returns (-3.0% appreciation + 3.0% rent growth), your $34k cash investment doubles in ~10 years — after that, you're playing with house money.
Negotiation context
- It's been on market 37 days — a 3% lower offer ($116k) is reasonable based on typical stale-listing flexibility.
- 9 sale attempts since 2y ago with the ask held roughly flat each time — persistent listings suggest the price (not the market) is what's stuck; bring a comps-based counter.
Risks & watch-outs
- Watch-outs: built in 1938 — expect roof / HVAC / electrical / plumbing capex.
- Climate carrying-cost: major flood risk; severe wind risk, 99% chance of damaging wind over 30y; extreme-heat days projected 7→23/yr by 2055 (HVAC capex compounding) — expect insurance premiums to compound above CPI over the hold.
Questions for the listing agent
- It's been on market 37 days. Have you received any prior offers? Is the seller open to a 3% concession, seller financing, or rate buy-down credit?
- Built in 1938 — when were the roof, HVAC, electrical panel, plumbing, and water heater last replaced?
- Is there a deadline driving the sale (1031 exchange, divorce, estate, relocation)? That informs how much negotiation room exists.
- What's the average days-on-market for RENTAL listings here right now (not sales)? A rising rental-DOM trend means longer vacancies and softer asking-rent achievability than the comps imply.
- What's the recent tenant-quality profile in this submarket — average credit score on applications, eviction rate, late-payment / NSF rate, and stable-employment percentage? A property-management company in the area should have these aggregated.
- How much new for-sale + rental construction is in the pipeline within 1–3 miles? Heavy new supply typically softens prices + rents 12–24 months out; constrained supply supports both.
Investment metrics
- 1% rule
- 1.20% ✓
- Cap rate
- 9.71%
- Cash-on-cash
- 12.21%
- DSCR
- 1.54
- GRM
- 7.0
CMA / ARV
- ARV (median comp)
- $124,502
- List price
- $119,900
- Delta
- -3.70%
- Verdict
- FAIR
- Comps
- 13 within 1.0 mi
Show comp detail 3 sales within ~0.75 mi
| Address | Dist | Beds/Ba | Sqft | Sold | Price | $/sf | Match |
|---|---|---|---|---|---|---|---|
| 655 N 2nd St | 0.00mi | 3/1.0 | 1,128 (0%) | 19mo | $49,900 | $44 | 84 |
| 1153 Railroad St | 0.37mi | 2/1.0 (-1) | 1,046 (-7%) | 3mo | $147,000 | $141 | 64 |
| 410 S 7th St | 0.65mi | 2/1.0 (-1) | 1,116 (-1%) | 19mo | $85,000 | $76 | 47 |
Match score weights: distance 35% · size 25% · config 20% · recency 20%. Top-matched comps best support the ARV.
Projected returns pro-forma
-3.0% appreciation · 3.0% rent growth · sell at horizon
- IRR
- 1.8%
- Equity multiple
- 1.07×
- Total profit
- $2,335
- Equity at exit
- $17,877
- IRR
- 11.4%
- Equity multiple
- 1.90×
- Total profit
- $30,058
- Equity at exit
- $10,367
Cash invested: $33,572 (down + closing). Projections, not guarantees.
Landlord ↔ Tenant lean methodology
- Overall (STATE)
- 87 Strongly Landlord-Friendly
- State Texas
- 87 Strongly Landlord-Friendly · R+5
- County
- — inherits STATE
- City
- — inherits STATE
ZIP-level market 77656
- Active inventory
- 127
- Price-to-rent
- 7.0×
Monthly cashflow live
- Estimated rent
- $1,436 high interval (Pro) →
- Mortgage (P&I)
- −$629
- Tax from tax record
- −$114 /mo · $1,369/yr
- Insurance
- −$50
- HOA
- −$0
- Vacancy / Maint / Mgmt
- −$302
- Net cashflow
- $342
Break-even live
Sensitivity live
| Price | -10% $410 | -5% $376 | +0% $342 | +5% $308 | +10% $274 |
|---|---|---|---|---|---|
| Rent | -10% $228 | -5% $285 | +0% $342 | +5% $398 | +10% $455 |
| Rate | -1.0pp $402 | -0.5pp $372 | base $342 | +0.5pp $311 | +1.0pp $279 |
UW: 25.0% down · 7.5% · 30yr · 1.5% tax · 5.0% vac · 8.0% maint · 8.0% mgmt
Financing live
Cash to close
- Down payment
- $29,975
- Closing costs
- $3,597
- Reserves months
- —
- Total cash needed
- —
Loan-product check · same deal, 3 products live
Conventional
25% down · 7.5% · 30yr
- Down + closing
- —
- Monthly P&I
- —
- Monthly cashflow
- —
- DSCR
- —
- Eligible?
- —
Personal DTI + credit; lowest rate.
DSCR
20% down · 8.5% · 30yr
- Down + closing
- —
- Monthly P&I
- —
- Monthly cashflow
- —
- DSCR
- —
- Eligible?
- —
No personal income docs; deal must DSCR.
Hard money
10% down · 12.0% · 12mo
- Down + closing
- —
- Monthly P&I
- —
- Monthly cashflow
- —
- DSCR
- —
- Eligible?
- —
Short-term bridge; refi at stabilization.
Rent comps 5 comps
| Address | Beds | Baths | Sqft | Rent | $/sqft | DOM | Units | Dist |
|---|---|---|---|---|---|---|---|---|
| 1108 N 3rd St Silsbee, TX | 3.0 | 1.5 | 1500 | $1,500 | $1.00 | 22d | 1 | 0.25mi |
| 454 Winters St Silsbee, TX | 3.0 | 2.0 | 1330 | $1,695 | $1.27 | 22d | 1 | 0.66mi |
| 750 S 3rd St Unit 12 Silsbee, TX | 2.0 | 1.0 | 900 | $875 | $0.97 | 44d | 1 | 0.87mi |
| 1135 Texas 327 Unit T204 Silsbee, TX | 2.0 | 2.0 | 782 | $745 | $0.95 | 44d | 1 | 0.92mi |
| 1135 Texas 327 Unit T212 Silsbee, TX | 2.0 | 2.0 | 782 | $745 | $0.95 | 22d | 1 | 0.92mi |
Listing history 44 events
-
2026-06-18days on market $119,900 Active 37 DOM
-
2026-06-17days on market $119,900 Active 36 DOM
-
2026-06-16days on market $119,900 Active 35 DOM
-
2026-06-15days on market $119,900 Active 34 DOM
-
2026-06-14days on market $119,900 Active 32 DOM
-
2026-06-10days on market $119,900 Active 29 DOM
-
2026-06-09days on market $119,900 Active 28 DOM
-
2026-06-08days on market $119,900 Active 27 DOM
-
2026-06-07days on market $119,900 Active 26 DOM
-
2026-06-03days on market $119,900 Active 22 DOM
-
2026-06-02days on market $119,900 Active 21 DOM
-
2026-06-01days on market $119,900 Active 20 DOM
-
2026-05-31days on market $119,900 Active 19 DOM
-
2026-05-30days on market $119,900 Active 18 DOM
-
2026-05-12$120,000 Active 605-char remark
-
2025-08-27price $129,900
-
2025-07-12historical $1,100
-
2025-07-10$1,100
-
2025-07-10historical $1,100
-
2025-07-03price $129,999
-
2025-06-20price $1,100
-
2025-05-23price $1,195
-
2025-05-13price $1,260
-
2025-04-27$1,295
-
2025-04-17historical $1,295
-
2025-03-18price $1,295
-
2025-03-11historical $1,395
-
2025-03-09$1,395
-
2025-02-19$1,395
-
2025-02-19historical $1,495
-
2025-02-14$1,495
-
2025-02-13historical $1,495
-
2025-02-07$1,495
-
2024-12-03soldstatus
-
2024-11-26soldstatus Closed
-
2024-11-26soldstatus Sold
-
2024-11-21status Option Pending
-
2024-11-17status Pending
-
2024-10-31status Option Pending
-
2024-10-27status Pending
-
2024-09-26status Option Pending
-
2024-09-26status Pending
-
2024-09-17$49,900 Active
-
2024-09-14$49,900 Active
ⓘ Source: listings_history table (triggers on properties + properties_extension) + one-shot
backfill from property_details.listing_events for pre-trigger history.
Tax reassessment forecast TX · Resets to sale price
- Current annual tax
- $1,369 · $114/mo
- Projected year-2 tax
- $2,194 · $183/mo
- Expected delta
- +$826/yr (+$69/mo · 60.3%)
ⓘ Screening estimate from a state-policy table — verify with the county assessor before closing.
Climate risk First Street
- Flood 6/10 Major FEMA zone X (unshaded) · 69% chance over 30 yrs
- Wildfire 2/10 Low
- Heat 9/10 Extreme 7 d/yr ≥112°F today · 23 d/yr by 30 yrs out
- Wind 9/10 Extreme 99% chance of damaging wind over 30 yrs
- Air quality 2/10 Low 0 unhealthy d/yr today · 1 by 30 yrs out
Nearby sold comps map
Loading sold comps map…
Walkable amenities ~0.75 mi
Loading nearby amenities…
Taxation est. · year 1
- Rental income
- $17,233
- − Mortgage interest
- −$6,716
- − Property taxes
- −$1,369
- − Insurance
- −$600
- − Repairs & maintenance
- −$1,379
- − Management
- −$1,379
- − Depreciation
- −$3,488
- Taxable income
- $2,303
- Est. tax owed @ 24.0%
- −$553
- After-tax cash flow
- $3,548/yr
For passive investors: Depreciation is non-cash, so a rental often shows a tax loss while cash-flowing — sheltering income. Rental losses are passive: they offset passive income freely, and up to $25,000/yr can offset ordinary (W-2) income if you actively participate and your MAGI is under $100k (phasing out to $0 by $150k); unused losses carry forward. On sale, claimed depreciation is recaptured at up to 25%, and gains may owe capital-gains tax (a 1031 exchange can defer both). Figures are a year-1 estimate at your 24.0% rate — not tax advice; consult a CPA.
Schools (NCES district)
- District
- Silsbee ISD
- NCES district ID
- 4840230
- Math proficiency
- 25% ▼ -23.00%
- Reading proficiency
- 36% ▼ -11.00%
- Median HH income
- $44,907
- Composite
- 26.09/100
- National rank
- #7292
- State rank
- #614 of 826 in TX
Livability — Silsbee
- Score
- 72/100
- State rank
- #263
- US rank
- #6215
Category grades
Schools grade is shown separately in the Schools card above.
Census & demographics
- Census place
- Silsbee, TX
- County
- Hardin County · 39,783 people
- City population
- 17,525
- Metro
- Beaumont-Port Arthur, TX
- Population (ZIP)
- 17,525
- Household income
- $62,303
- Rent vs Own
- Severe rent burden
- 306.0
Population outlook (Hardin County) Hauer SSP2
- Today (2025)
- 57,780 people
- By 2030
- 58,296 · +0.9%
- By 2040
- 58,421 · +1.1%
- By 2050
- 57,391 · -0.7%
- By 2075
- 53,132 · -8.0%
- By 2100
- 44,905 · -22.3%
Race, ethnicity, and origin ACS 2023
- Neighborhood character
- Predominantly White (74%)
- Race & ethnicity
- White 74% Black 14% Two or more races 8% Hispanic / Latino 7%
- Hispanic origin (detail)
- Mexican 4%
- Common ancestry
- Lithuanian 4% Serbian 3% Italian 2%
- Foreign-born
- 3% · Canada
- Languages at home
- 96% English-only · Spanish 3% Other Indo-European 1%
Political lean MEDSL · Hardin
- 2024 margin
- Solid R (+75.8) · D 11.9% · R 87.7%
- 2008→2024 swing
- -14.6pp toward R · 2008: -61.2pp · 2024: -75.8pp
- All cycles
- 2024: R+75.8 2020: R+73.8 2016: R+73.9 2012: R+67.6 2008: R+61.2
Not yet ingested
- Civics
- —
Market trends
- HPI YoY
- ▼ -93.73%
- Current HPI
- 141.1371
- Rent YoY
- —
- Metro
- Beaumont-Port Arthur, TX
- State GDP YoY
- ▲ 3.95%
- F500 in state
- 110
Industry mix (Fortune 500 HQ in TX)
| Industry | F500 HQs | Revenue |
|---|---|---|
| Energy | 16 | $1,198B |
|
||
| Technology | 5 | $198B |
|
||
| Engineering / Construction | 4 | $72B |
|
||
| Energy Services | 3 | $60B |
|
||
| Utilities | 3 | $41B |
|
||
| Healthcare | 2 | $330B |
|
||
Price history
+140.3% since first listed31 events — show timeline
- 2026-05-28 Price Changed $119,900 BBOR
- 2026-05-12 Listed $120,000 BBOR
- 2025-08-27 Price Changed $129,900 BBOR
- 2025-07-12 Rental Removed $1,100 BUILDIUM
- 2025-07-10 Listed for Rent $1,100 BUILDIUM
- 2025-07-10 Rental Removed $1,100 BBOR
- 2025-07-03 Price Changed $129,999 BBOR
- 2025-06-20 Price Changed $1,100 BBOR
- 2025-05-23 Price Changed $1,195 BBOR
- 2025-05-13 Price Changed $1,260 BBOR
- 2025-04-27 Listed for Rent $1,295 BBOR
- 2025-04-17 Rental Removed $1,295 BBOR
- 2025-03-18 Price Changed $1,295 BBOR
- 2025-03-11 Rental Removed $1,395 BUILDIUM
- 2025-03-09 Listed for Rent $1,395 BUILDIUM
- 2025-02-19 Listed for Rent $1,395 BBOR
- 2025-02-19 Rental Removed $1,495 BUILDIUM
- 2025-02-14 Listed for Rent $1,495 BUILDIUM
- 2025-02-13 Rental Removed $1,495 BBOR
- 2025-02-07 Listed for Rent $1,495 BBOR
- 2024-12-03 Sold (Public Records) — Public Records
- 2024-11-26 Sold (MLS) — BBOR
- 2024-11-26 Sold (MLS) — HARMLS
- 2024-11-21 Pending — HARMLS
- 2024-11-17 Pending — HARMLS
- 2024-10-31 Pending — HARMLS
- 2024-10-27 Pending — HARMLS
- 2024-09-26 Pending — HARMLS
- 2024-09-26 Pending — BBOR
- 2024-09-17 Listed $49,900 HARMLS
- 2024-09-14 Listed $49,900 BBOR
Property tax history
+6.5%/yrLatest (2025): $1,369 · +31.8% YoY. Source: county tax records.
Cash-flow waterfall
monthlySold comps — $/sqft
last 12 mo · ≤1 miLoading sold comps…