 🏗️ New Construction
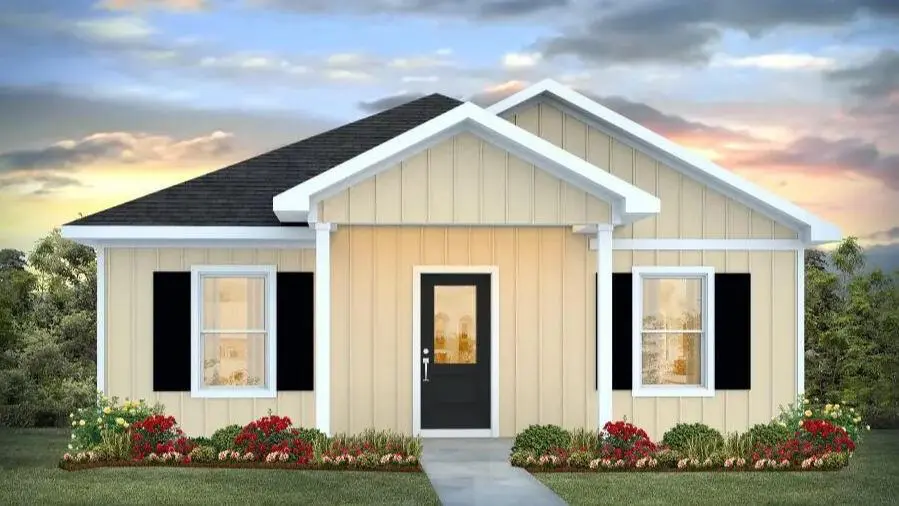
6537 Firefly Dr · Bagdad, FL
Flood risk No data
- FEMA flood zone
- —
- Chance of flooding over 30 yrs
- —
- Est. flood insurance / yr
- —
Fire risk No data
- Est. fire insurance / yr
- —
Heat risk No data
- Hot days now (above threshold)
- —
- Hot days in 30 yrs
- —
Wind risk No data
- Chance of severe wind over 30 yrs
- —
Air-quality risk No data
- Unhealthy air days now
- —
- Unhealthy air days in 30 yrs
- —
Risk factors via First Street. Map © Google.
Why this score? — see what drove the D grade
The composite is a weighted blend of 9 inputs, each scored 0–100. Each bar is that input's sub-score; the figure is the points it added to the 100-point composite (weight × sub-score).
- Cash flow +10.9/30.0
- ARV discount +7.5/15.0
- Schools +5.3/10.0
- Condition / age +4.0/5.0
- Rent growth +3.6/5.0
- 1% rule +3.5/10.0
- Livability +3.4/5.0
- DSCR +3.2/10.0
- Appreciation +0.0/10.0
$249,900
🖨 Deal sheet 📄 Offer letter ✓ Due diligence
Listing remarks MLS
The Rivers Cove community offers residents: Gorgeous Community Pool, Community Center and a nice Community Playground. The new 'CALLAWAY' floorplan is a charming Florida cottage style home with no wasted space, a desirable open design for relaxed living. 3 bedrooms and 2 bathrooms. Easy care beautiful wood-look flooring, delightful kitchen with stainless appliances, quiet dishwasher, smooth top range, built in microwave and pantry. Also included is Fabric hurricane door/window protection and a Smart Home 'Connect' system with several convenient Smart Home Devices you will enjoy. ALL LISTING pictures, colors, features, and size may vary. Square footages are approximate.
Key facts
- 6,534 sq ft lot
- Community pool
- Built 2026
Property features AI
Finance
- HOA & community: Homeowners association with annual fee (association-managed, fee paid annually); Community amenities include a pool, community room, and sidewalks
Exterior
- Parking: Driveway with open parking
- Security: Smoke detector(s)
- Utilities: Public water; Public sewer; Copper wiring with circuit breakers
- Home design: Single-story home; Detached (not attached to other properties); Under construction / new construction
- Construction: Frame construction; Slab foundation; Built as new construction
- Exterior features: Porch; Shingle roof; Interior lot; Paved road; Private maintained road
Interior
- Kitchen: Laminate counters; Pantry; Built-in microwave; Dishwasher; Electric water heater
- Bedrooms: Primary bedroom on the first floor (approx. 11.7' x 11.4')
- Flooring: Vinyl
- Bathrooms: 2 full bathrooms; New construction
- Heating & cooling: Central heating; Central air
- Interior features: Baseboards; Double-pane windows; Storm windows; Shutters
- Laundry & utility: Indoor laundry with washer/dryer hookups
Neighborhood map
What this means for you Summary
Snapshot
- This is a 3-bed/2.0-bath single-family listed at $250k. Condition is rated good.
Deal economics
- At list price, monthly cash flow is $-107 ($-1k/yr) — negative.
- To cash-flow at today's rent, offer at most $229k (8.3% below list).
- To meet the 1% rule (rent ≥ 1% of price), the offer needs to be $207k (17.0% below list).
- Recommended offer: $207k (17.0% below list) — sets the bar for 1% rule.
Location & tenants
- Location reads 67/100 on livability (#571 in FL) — a middle-class / working-renter tenant base. Strengths: crime A+, cost of living A+, housing A+; Watch: schools F, amenities F, commute F.
- Santa Rosa (suburban): math 63% / reading 60% proficiency, ranked #8 of 73 in FL (top 11%) — acceptable for families but not a draw, mixed tenant base, ~2y average lease.
- Market conditions: Rents rising fast (+4.5%/yr); 806 active listings in the ZIP; 3 comparable units currently listed for rent nearby; rentals at typical pace (median 21d on market — plan ~3-4 weeks tenant-placement turnaround); solid renter incomes; 1,983 units permitted in Santa Rosa County in 2024 (128 in 5+ unit buildings).
Forward outlook
- Local home prices are declining (-3.0%/yr); year-one equity from $2k of loan paydown is wiped out by about $7k of value loss. Plan a longer hold.
- Santa Rosa County population projected at +31% by 2050 — long-run rental-demand tailwind backs the buy-and-hold thesis.
Negotiation context
- It's been on market 44 days — a 3% lower offer ($242k) is reasonable based on typical stale-listing flexibility.
- 2 sale attempts with the ask held roughly flat each time — persistent listings suggest the price (not the market) is what's stuck; bring a comps-based counter.
Questions for the listing agent
- What do current leases actually rent for vs. the listed asking? Can we see a recent rent roll and the last 12 months of T-12 income?
- It's been on market 44 days. Have you received any prior offers? Is the seller open to a 17% concession, seller financing, or rate buy-down credit?
- What does the HOA fee cover, when was the last increase, and are there any pending special assessments or reserve-fund shortfalls?
- Is there a deadline driving the sale (1031 exchange, divorce, estate, relocation)? That informs how much negotiation room exists.
- Schools are F-rated, which usually means shorter tenancies and higher turnover. Who's the typical renter profile here, and what's been the actual vacancy rate?
- The area grade is low — what's the realistic commute time and amenity access for the typical tenant pool here? Any planned neighborhood developments (good or bad) we should know about?
- What's the average days-on-market for RENTAL listings here right now (not sales)? A rising rental-DOM trend means longer vacancies and softer asking-rent achievability than the comps imply.
- What's the recent tenant-quality profile in this submarket — average credit score on applications, eviction rate, late-payment / NSF rate, and stable-employment percentage? A property-management company in the area should have these aggregated.
- How much new for-sale + rental construction is in the pipeline within 1–3 miles? Heavy new supply typically softens prices + rents 12–24 months out; constrained supply supports both.
Investment metrics
- 1% rule
- 0.85% ✗
- Cap rate
- 5.77%
- Cash-on-cash
- -1.88%
- DSCR
- 0.92
- GRM
- 9.8
CMA / ARV
- ARV (on-the-fly)
- $244,615
- Comps found
- 12
Show comp detail 12 sales within ~0.75 mi
| Address | Dist | Beds/Ba | Sqft | Sold | Price | $/sf | Match |
|---|---|---|---|---|---|---|---|
| 6509 Firefly Dr | 0.00mi | 3/2.0 | 1,205 (0%) | 0mo | $244,900 | $203 | 100 |
| 6497 Firefly Dr | 0.00mi | 3/2.0 | 1,205 (0%) | 1mo | $239,900 | $199 | 99 |
| 6489 Firefly Dr | 0.01mi | 3/2.0 | 1,205 (0%) | 3mo | $249,900 | $207 | 97 |
| 6481 Firefly Dr | 0.01mi | 3/2.0 | 1,205 (0%) | 3mo | $245,000 | $203 | 97 |
| 6473 Firefly Dr | 0.01mi | 3/2.0 | 1,205 (0%) | 4mo | $244,900 | $203 | 97 |
| 6449 Firefly Dr | 0.01mi | 3/2.0 | 1,205 (0%) | 5mo | $245,000 | $203 | 95 |
| 6461 Firefly Dr | 0.01mi | 3/2.0 | 1,205 (0%) | 6mo | $240,000 | $199 | 95 |
| 6333 Firefly Dr | 0.01mi | 3/2.0 | 1,205 (0%) | 9mo | $254,900 | $212 | 92 |
| 6333 Firefly Dr | 0.28mi | 3/2.0 | 1,205 (0%) | 9mo | $254,900 | $212 | 79 |
| 4331 Audiss Rd | 0.28mi | 3/2.0 | 1,153 (-4%) | 2mo | $220,000 | $191 | 78 |
| 6349 Firefly Dr | 0.32mi | 3/2.0 | 1,205 (0%) | 9mo | $250,000 | $207 | 77 |
| 6333 Rice St | 0.72mi | 3/2.0 | 1,215 (+1%) | 4mo | $250,000 | $206 | 62 |
Match score weights: distance 35% · size 25% · config 20% · recency 20%. Top-matched comps best support the ARV.
Projected returns pro-forma
-3.0% appreciation · 4.53% rent growth · sell at horizon
- IRR
- -17.6%
- Equity multiple
- 0.37×
- Total profit
- $-43,155
- Equity at exit
- $36,473
- IRR
- -6.9%
- Equity multiple
- 0.53×
- Total profit
- $-32,378
- Equity at exit
- $21,150
Cash invested: $68,492 (down + closing). Projections, not guarantees.
Landlord ↔ Tenant lean methodology
- Overall (STATE)
- 87 Strongly Landlord-Friendly
- State Florida
- 87 Strongly Landlord-Friendly · R+3
- County
- — inherits STATE
- City
- — inherits STATE
ZIP-level market 32583
- Home prices YoY
- -11.3%
- Rents YoY
- 4.5%
- Active inventory
- 806
- Price-to-rent
- 10.0×
Monthly cashflow live
- Estimated rent
- $2,074 medium interval (Pro) →
- Mortgage (P&I)
- −$1,283
- Tax est. 1.5%
- −$306 /mo · $3,669/yr
- Insurance
- −$102
- HOA
- −$55
- Vacancy / Maint / Mgmt
- −$436
- Net cashflow
- $-107
Break-even live
UW: 25.0% down · 7.5% · 30yr · 1.5% tax · 5.0% vac · 8.0% maint · 8.0% mgmt
Financing live
Cash to close
- Down payment
- $61,154
- Closing costs
- $7,338
- Reserves months
- —
- Total cash needed
- —
Loan-product check · same deal, 3 products live
Conventional
25% down · 7.5% · 30yr
- Down + closing
- —
- Monthly P&I
- —
- Monthly cashflow
- —
- DSCR
- —
- Eligible?
- —
Personal DTI + credit; lowest rate.
DSCR
20% down · 8.5% · 30yr
- Down + closing
- —
- Monthly P&I
- —
- Monthly cashflow
- —
- DSCR
- —
- Eligible?
- —
No personal income docs; deal must DSCR.
Hard money
10% down · 12.0% · 12mo
- Down + closing
- —
- Monthly P&I
- —
- Monthly cashflow
- —
- DSCR
- —
- Eligible?
- —
Short-term bridge; refi at stabilization.
Rent comps 3 comps
| Address | Beds | Baths | Sqft | Rent | $/sqft | DOM | Units | Dist |
|---|---|---|---|---|---|---|---|---|
| 6317 Firefly Dr Milton, FL | 4.0 | 2.0 | 1439 | $2,000 | $1.39 | 21d | 1 | 0.24mi |
| 6478 Da Lisa Rd Milton, FL | 3.0 | 2.0 | 1120 | $1,900 | $1.70 | 23d | 1 | 0.88mi |
| 6436 Highway 90 Milton, FL | 2.0 | 1.0 | 512 | $1,395 | $2.72 | 14d | 8 | 1.38mi |
HOA detail
- Monthly dues
- $55 · $660/yr
- Likely covers
- pool
Listing history 17 events
-
2026-06-18days on market $249,900 Active 44 DOM
-
2026-06-17days on market $249,900 Active 43 DOM
-
2026-06-16days on market $249,900 Active 42 DOM
-
2026-06-15days on market $249,900 Active 41 DOM
-
2026-06-14days on market $249,900 Active 39 DOM
-
2026-06-10days on market $249,900 Active 36 DOM
-
2026-06-09days on market $249,900 Active 35 DOM
-
2026-06-08days on market $249,900 Active 34 DOM
-
2026-06-07days on market $249,900 Active 33 DOM
-
2026-06-05days on market $249,900 Active 30 DOM
-
2026-06-03pricedays on market $249,900 Active 29 DOM
-
2026-06-02days on market $255,900 Active 28 DOM
-
2026-06-01days on market $255,900 Active 27 DOM
-
2026-05-31days on market $255,900 Active 26 DOM
-
2026-05-31days on market $255,900 Active 25 DOM
-
2026-05-07$255,900 Active 677-char remark
Show marketing remark (677 chars)
The Rivers Cove community offers residents: Gorgeous Community Pool, Community Center and a nice Community Playground. The new 'CALLAWAY' floorplan is a charming Florida cottage style home with no wasted space, a desirable open design for relaxed living. 3 bedrooms and 2 bathrooms. Easy care beautiful wood-look flooring, delightful kitchen with stainless appliances, quiet dishwasher, smooth top range, built in microwave and pantry. Also included is Fabric hurricane door/window protection and a Smart Home 'Connect' system with several convenient Smart Home Devices you will enjoy. ALL LISTING pictures, colors, features, and size may vary. Square footages are approximate.
-
2026-05-05$255,900 Active
ⓘ Source: listings_history table (triggers on properties + properties_extension) + one-shot
backfill from property_details.listing_events for pre-trigger history.
Nearby sold comps map
Loading sold comps map…
Walkable amenities ~0.75 mi
Loading nearby amenities…
Taxation est. · year 1
- Rental income
- $24,886
- − Mortgage interest
- −$13,702
- − Property taxes
- −$3,669
- − Insurance
- −$1,223
- − Repairs & maintenance
- −$1,991
- − Management
- −$1,991
- − HOA
- −$660
- − Depreciation
- −$7,116
- Taxable loss
- −$5,466
- Est. tax savings @ 24.0%
- +$1,312
- After-tax cash flow
- $26/yr
For passive investors: Depreciation is non-cash, so a rental often shows a tax loss while cash-flowing — sheltering income. Rental losses are passive: they offset passive income freely, and up to $25,000/yr can offset ordinary (W-2) income if you actively participate and your MAGI is under $100k (phasing out to $0 by $150k); unused losses carry forward. On sale, claimed depreciation is recaptured at up to 25%, and gains may owe capital-gains tax (a 1031 exchange can defer both). Figures are a year-1 estimate at your 24.0% rate — not tax advice; consult a CPA.
Condition & rehab AI · 12 photos
This home is in excellent condition with a modern kitchen and well-maintained exterior. It's a great investment opportunity with potential for minor updates to enhance curb appeal and value.
Value-add opportunities
- Both Painting exterior siding — Enhances curb appeal and value
- Both Landscaping improvements — Enhances curb appeal and value
- Both Replace window treatments — Freshens up the interior and adds value
Renovation cost estimate screening
Value-add ROI direction
- Both Painting exterior siding — Enhances curb appeal and value ↑
- Both Landscaping improvements — Enhances curb appeal and value ↑
- Both Replace window treatments — Freshens up the interior and adds value ↑
ⓘ Cost ranges are severity-bucket heuristics (US national rule-of-thumb). Get contractor quotes + a written scope before underwriting a rehab budget.
Schools (NCES district)
- District
- Santa Rosa
- NCES district ID
- 1201650
- Math proficiency
- 63% ▼ -6.00%
- Reading proficiency
- 60% ▼ -5.00%
- Median HH income
- $58,161
- Composite
- 53.12/100
- National rank
- #1511
- State rank
- #8 of 73 in FL
Livability — Bagdad
- Score
- 67/100
- State rank
- #571
- US rank
- #10887
Category grades
Schools grade is shown separately in the Schools card above.
Census & demographics
- Census place
- Bagdad, FL
- County
- Santa Rosa County · 194,764 people
- Metro
- Pensacola-Ferry Pass-Brent, FL
- Population (ZIP)
- 31,828
- Household income
- $85,440
- Rent vs Own
- Severe rent burden
- 122.0
Population outlook (Santa Rosa County) Hauer SSP2
- Today (2025)
- 195,978 people
- By 2030
- 209,782 · +7.0%
- By 2040
- 235,293 · +20.1%
- By 2050
- 256,408 · +30.8%
- By 2075
- 298,074 · +52.1%
- By 2100
- 303,216 · +54.7%
Race, ethnicity, and origin ACS 2023
- Neighborhood character
- Predominantly White (74%)
- Race & ethnicity
- White 74% Black 11% Two or more races 10% Hispanic / Latino 6% Asian 1%
- Hispanic origin (detail)
- Mexican 3% Puerto Rican 2% Cuban 1%
- Common ancestry
- Italian 3% Slovak 2% Serbian 2%
- Foreign-born
- 3% · Canada
- Languages at home
- 94% English-only · Spanish 3%
Political lean MEDSL · Santa Rosa
- 2024 margin
- Solid R (+51.0) · D 24.1% · R 75.0%
- 2008→2024 swing
- -3.0pp toward R · 2008: -47.9pp · 2024: -51.0pp
- All cycles
- 2024: R+51.0 2020: R+46.5 2016: R+53.5 2012: R+52.6 2008: R+47.9
Not yet ingested
- Civics
- —
Market trends
- HPI YoY
- ▼ -38.35%
- Current HPI
- 301.8819
- Rent YoY
- ▲ 4.53%
- Metro
- Pensacola-Ferry Pass-Brent, FL
- State GDP YoY
- ▲ 3.28%
- F500 in state
- 36
Industry mix (Fortune 500 HQ in FL)
| Industry | F500 HQs | Revenue |
|---|---|---|
| Industrial Technology | 2 | $29B |
|
||
| Insurance | 2 | $17B |
|
||
| Retail | 1 | $60B |
|
||
| Technology Distribution | 1 | $58B |
|
||
| Homebuilding | 1 | $35B |
|
||
| Technology Manufacturing | 1 | $35B |
|
||
Price history
+0.0% since first listed2 events — show timeline
- 2026-05-07 Listed $255,900 ECAR
- 2026-05-05 Listed $255,900 PARMLS
Cash-flow waterfall
monthlySold comps — $/sqft
last 12 mo · ≤1 miLoading sold comps…